A Statistical Analysis of RNA Folding Algorithms Through Thermodynamic Parameter Perturbation
Abstract
Computational RNA secondary structure prediction is rather well established. However, such prediction algorithms always depend on a large number of experimentally measured parameters. Here, we study how sensitive structure prediction algorithms are to changes in these parameters. We find that already for changes corresponding to the actual experimental error to which these parameters have been determined 30% of the structure are falsly predicted and the ground state structure is preserved under parameter perturbation in only 5% of all cases. We establish that base pairing probabilities calculated in a thermal ensemble are a viable though not perfect measure for the reliability of the prediction of individual structure elements. A new measure of stability using parameter perturbation is proposed, and its limitations discussed.
Introduction
In an endeavor to understand the workings of any organism, one cannot ignore the importance of ribonucleic acids (RNA) science_paper . RNA molecules transmit genetic information through the cell. They are also intimately involved in many important biological processes such as translation, regulation, and splicing. In addition to its importance for today’s organisms RNA is also an interesting molecule to study due to its likely role as a major player during the origin of life rnaworld .
The function of a given RNA is determined by its physical structure. This structure is encoded in the sequence of the four nucleotides (or bases) A, U, G, and C from which each RNA molecule is composed. Determining that structure in the laboratory is a laborious, and often unsuccessful, undertaking. Thus, it has become an interdisciplinary task to determine these structures from the sequences alone.
The encoding of a structure in the sequence is realized by specific interactions between the bases. The by far most important of these interactions is the formation of A–U and G–C base pairs, also known as Watson-Crick pairs. With the formation of each base pair, the Gibbs free energy of the structure is lowered, and thus, the structure’s stability is increased. Since the sequence of bases that defines the RNA is finite, the number of possible structures into which a given RNA can fold is also finite. The most thermodynamically likely structure to be formed is the structure with the lowest free energy known as the minimum free energy structure.
Although the number of possible structures for a given sequence is enormous, computer algorithms, such as the Vienna Package hofac or MFOLD zuker , can find the minimum free energy structure or the full partition function of the ensemble of all structures given a sequence in a time that is proportional to the third power of the sequence length due to a recursive relationship dege68 ; wate78 ; mccaskill . The problem with these algorithms lies in the calculation of the free energies of the structures. The contribution to the free energy attributed to a base pairing or the formation of various substructures such as various kinds of loops is measured experimentally and used as parameters in the RNA folding algorithm. For various reasons, these parameters contain errors. On the one hand, several effects such as steric interactions between different regions of the structure, pseudo-knots, base triplets, or even interactions with proteins or other RNA molecules are not reflected at all in the underlying free energy model. All these effects result in systematic errors in the free energy parameters. On the other hand, there are ordinary, non-systematic errors of measurement associated with these parameters as well. Thus, while the algorithm guarantees to find the minimum energy structure within the energy model provided by the experimentally determined parameters, this structure does not have to be the true (and thus biologically realized) minimum free energy structure.
The goal of this paper is not to discuss the causes of these experimental errors but simply, to investigate the consequences these errors have regarding structure prediction. Our approach is to randomly modify the measured free energy parameters within a range comparable to the experimental errors and to record how much the predicted minimum free energy structures change. We find that already around 30% of the structures are changed if the free energy parameters are varied within the experimental error. While this is a rather sobering result, we at least find that base pairing probabilities evaluated in a thermal ensemble are very good priors to estimate which parts of the structure prediction are reliable and which are not.
Materials and Methods
In this section we will discuss how RNA structure prediction algorithms work and how we model experimental error in the free energy parameters. This will provide the necessary background for our study.
RNA secondary structure:
The strongest interaction between the bases of an RNA molecule is the formation of Watson-Crick base pairs. Therefore, one distinguishes two levels of structure, namely secondary and tertiary structure (with the primary structure just being another name for the sequence of the molecule.) A secondary structure is defined as the collection of all base pairs that have formed without regard to any spatial organization of the backbone. The tertiary structure then includes the actual spatial organization and elements formed by less stable interactions than base pairing such as base triplets, backbone contacts mediated by divalent ions, etc. Since base pairing is energetically more important than the other interactions, it is meaningful to talk about the secondary structure of an RNA molecule without considering the tertiary structure tinocobustamante . This is the point of view of the algorithms that we will study here; therefore we also will discuss secondary structure only for the remainder of this paper.
In order to make secondary structure prediction computationally feasible, it is necessary to exclude so-called pseudoknots from the allowed secondary structures. Such a pseudoknot exists if bases and form a base pair and bases and form a base pair and these two base pairs are nested as or . While these pseudoknots do appear in biological structures, they are bound to be short due to kinetic constraints. Thus, they can be omitted in secondary structure prediction tinocobustamante and be considered part of the tertiary structure of a molecule.
Energy model:
A secondary structure as defined above can be drawn as shown in Fig. 1. It can be decomposed into a large number of loops that are either stacking loops, bulges, interior loops, hairpins, or multiloops as also indicated in the figure. The main assumption of the generally accepted free energy model is that the total free energy of a secondary structure is the sum of independent contributions from all of its loops. These loop contributions depend on the identity of the bases in a loop and on the length of the loop. E.g., the free energy of a stacking loop depends on the identity of all four bases that form the two base pairs a stacking loop is formed by leading to (after taking into account symmetry) different free energy parameters for stacking loops (if in addition to G–C, and A–U also the wobble base pair G–U is allowed). For short bulges and interior loops the number of parameters increases by a factor of four for every unpaired base in the loop. Longer loops are typically only characterized by their length and by the identity of the unpaired bases immediately next to the base pairs defining the loop in order to avoid an explosion of parameters. Nevertheless, a complete free energy model is described by on the order of a thousand parameters that are determined experimentally mathews . Since all these parameters are true free energies, i.e., differences of energetic contributions such as chemical binding energy and bending energy and entropic contributions from the integrated out spatial degrees of freedom of the backbone and the surrounding water, each parameter depends on the temperature. In our study we will keep the temperature constant at physiological C.

Perturbations of the energy model:
In order to study the sensitivity of structure prediction to thermodynamic parameters, one must perturb the parameters. For simplicity we assume that the error in the parameters is roughly Gaussian distributed. We model these errors by adding to every single free energy parameter a Gaussian random variable with mean zero and standard deviation, , i.e., with a probability density
| (1) |
In doing so we take great care to preserve the inherent symmetry in the parameters (e.g. the energy of a stacking loop made from a GC-pair and an AU-pair (–GA– paired with –UC–) being equal to the energy of a stacking loop made from an UA-pair and a CG-pair, i.e., –UC– paired with –GA–). The parameter serves as a measure of the magnitude of the experimental error inherent in the parameters.
We will explore a whole range of different values for the parameter to understand the sensitivity of predicted structures to perturbations of the free energy parameters. In order to get an idea what experimental errors on the free energy parameters are in reality, it is most illustrative to look at the stacking energies since stacking energies have been measured in many different laboratories. In the case of the more studied DNA stacking energies seven independent measurements have been systematically compared santalucia . This study reports in addition the detailed free energy parameters the stacking energies averaged over the different types of stacking for each of the seven independent experiments. If we take the average of these averages we find it to be kcal/mol. Since the experimental procedure for the determination of RNA free energy parameters is the same as for DNA free energy parameters we conclude that a good estimate for the experimental error is kcal/mol. Another indication that this is the order of magnitude of the experimental error of the stacking free energies is that the additive free energy model itself is experimentally known to break down at this level of precision kierzek . This implies that this uncertainty is not due to a lack of experimental techniques of higher precision (which could in principle be overcome by new experimental developments) but that these uncertainties are unavoidable on principle grounds. Since we do not have very good estimates of the experimental error of the other free energy parameters we uniformly apply the same error estimate to all free energy parameters.
| Accession | Length | ||||||||||||
|---|---|---|---|---|---|---|---|---|---|---|---|---|---|
| Random | 190 | 0 | 100.0% | 147 | 10.5% | 314 | 7.4% | 576 | 7.3% | 829 | 1.1% | 983 | 0.5% |
| Random | 210 | 1 | 95.7% | 291 | 2.3% | 541 | 2.2% | 846 | 1.0% | 977 | 0.6% | 989 | 0.1% |
| AJ228695 | 227 | 0 | 100.0% | 20 | 46.8% | 128 | 15.8% | 350 | 5.9% | 619 | 2.1% | 829 | 1.1% |
| Random | 230 | 15 | 34.0% | 195 | 5.5% | 445 | 3.5% | 855 | 1.6% | 994 | 0.1% | 991 | 0.2% |
| AJ228705 | 248 | 0 | 100.0% | 38 | 58.1% | 223 | 18.4% | 574 | 6.4% | 873 | 1.8% | 965 | 0.6% |
| U83261 | 243 | 4 | 98.0% | 49 | 23.1% | 241 | 8.8% | 591 | 3.4% | 880 | 1.0% | 976 | 0.2% |
| Y13474 | 256 | 0 | 100.0% | 23 | 86.1% | 167 | 32.7% | 491 | 6.0% | 794 | 1.2% | 940 | 0.3% |
| Random | 270 | 4 | 76.2% | 353 | 3.4% | 681 | 1.3% | 926 | 0.2% | 993 | 0.2% | 999 | 0.1% |
| Random | 290 | 1 | 99.9% | 134 | 23.1% | 513 | 1.7% | 908 | 0.2% | 996 | 0.1% | 995 | 0.1% |
| Random | 330 | 9 | 58.8% | 327 | 7.1% | 909 | 1.1% | 986 | 0.2% | 997 | 0.1% | 999 | 0.1% |
| Random | 350 | 2 | 79.5% | 243 | 8.1% | 581 | 2.2% | 990 | 0.1% | 998 | 0.1% | 999 | 0.1% |
| M38691 | 376 | 6 | 61.5% | 516 | 2.6% | 941 | 0.2% | 996 | 0.1% | 1000 | 0.1% | 1000 | 0.1% |
| Random | 390 | 6 | 27.1% | 321 | 11.8% | 846 | 0.5% | 997 | 0.1% | 999 | 0.1% | 1000 | 0.1% |
| V01416 | 426 | 7 | 40.4% | 219 | 9.4% | 749 | 1.7% | 977 | 0.4% | 999 | 0.2% | 1000 | 0.1% |
Results
If the predicted minimum free energy (mfe) structure, also referred to as the ground state, has a far lower free energy than any alternative structure, the ground state is said to be thermodynamically stable. For the purposes of this paper, we are interested in another type of stability. We will call a structure unstable with respect to parameter perturbation should the predicted mfe structure require a strict adherence to one or more thermodynamic parameters in order to remain the predicted mfe structure. We will quantify this stability in the following in two different ways.
Distance of structures:
The first way we study this instability is by looking at what fraction of a structure is still predicted correctly once parameters are perturbed. To this end, we need some quantitative method of comparison for structures. In this study, we will use the normalized tree distance hofac to quantify the amount by which mfe structures at different free energy parameter choices differ. We convinced ourselves that other solely structure based measures such as the string distance hofac lead to the similar results as the ones presented here. The tree distance is based on a metric that views a secondary structure as being defined by a tree diagram where the leafs of the tree are the bases and the topology of the tree represents the structure in an intuitive way. The tree distance is then defined as the number of elementary operations on the tree such as cutting a branch and attaching it at a different place in the tree. For a more detailed description of this difference measure the reader is referred to Ref. fontana . Since the tree distance is a number between zero (for identical structures) and the length of the sequence, we rescale the tree distance by the length of the sequence. This scaling allows us to compare the stability of sequences of different lengths and permits a more intuitive interpretation of the data. For example, a scaled distance of stands for a 20% difference in structure.
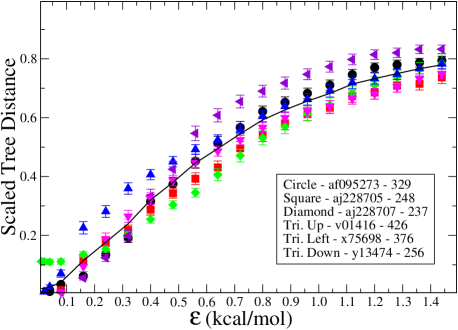
For our study we choose a series of natural sequences (namely group I introns) with length varying between 227 and 685, that is, RNA sequences which have been observed in biological systems. For each of these sequences the mfe structure is predicted by the computer algorithm from the Vienna package hofac using the accepted experimentally measured parameters mathews . In addition, we determine the mfe structures of the same sequences for a hundred sets of randomly perturbed energy parameters for each uncertainty . We calculate the scaled tree distance between each mfe structure calculated with perturbed parameters and the corresponding mfe structure obtained with unperturbed parameters (i.e. the experimentally measured values without alteration) and average these distances over the realizations for each sequence and each .
Fig. 2 shows these averaged distances as a function of the perturbation parameter . One should note the overall instability of the structure prediction of these natural sequences. As can be seen in Fig. 2, there is already a significant deviation of about 30% from the ground state structure at kcal/mol which roughly corresponds to the actual experimental error of the parameters santalucia . For kcal/mol already half of the structure can no longer be predicted.
Ground state probability:
An alternative, and as it turns out even more sensitive, measure of stability is the probability that the ground state structure will be the predicted structure at a given perturbation . To estimate this quantity we determine the mfe structure of our sequences for sets of randomly perturbed parameters for each perturbation strength and classify the parameter sets according to the mfe structures. Since we catalog the parameter sets which produce each structure, the frequency at which the “correct” (i.e., calculated with the accepted free energy parameters) structure occurs can be determined, as well as the number of alternative structures possible at a given .
As can be seen in table 1, the ground state structure is most likely not the true structure for one sequence for as small as , and for all sequences for of . At the experimental error rate, i.e., , only a mere 5% of the parameter perturbations reproduce the same ground state. For this part of the study we also include data on randomly generated sequences of varying length in addition to data on the group I introns used in the rest of this manuscript. Table 1 shows that the ground state stability for these sequences is even worse than for the group I introns. From this data, one can see that the current error in the thermodynamic parameters casts serious doubt upon the structural predictions made by folding algorithms. Since this error is at least to a good part due to fundamental limitations in the energy model and thus cannot be significantly reduced just by better measurements, predictions from folding algorithms should never be taken at face value but always be subjected to critical crosschecking.
Reliability estimation:

Given that we obviously have to live with the fact that on the order of 30% of a secondary structure will be incorrectly predicted just because of the uncertainties in the free energy parameters, the question comes up if it is at least possible to find out which parts of the structure are the reliable ones and which are the unreliable ones. If the RNA secondary structure prediction algorithm is used to calculate the full partition function for a given sequence instead of the mfe structure only, it can assign to every pair of bases a probability that these two bases are paired within a thermal ensemble mccaskill . Since these probabilities can be calculated in the same time as the mfe structure, these probabilities are a convenient measure for the reliability of the prediction of an individual base pair. However, it is not a priori clear if a high probability in the thermal ensemble corresponds to stability with respect to uncertainties in the free energy parameters.
To study if the thermal probabilities have any meaning for the stability of a base pair with respect to parameter changes, we compare the thermal ensemble directly to an ensemble of mfe structures calculated with perturbed parameters. To this end we calculate the mfe structure for a given sequence for different sets of perturbed free energy parameters. We catalog the resulting base pairs, and determine the frequency with which they occur. Then, we compare this frequency to the thermal ensemble probability calculated at the accepted parameters for each individual base pair.
The comparison of the base pair frequencies versus the thermal ensemble probabilities is shown in Fig. 3 for a representative sequence (we convinced ourselves that the results are qualitatively similar for all sequences). We observe that at small , since few or no alternative structures are predicted, the plot appears to be very much a step function; base pairs which the thermal ensemble predicts to have a significant probability ( 40% or more) occur while less likely base pairs do not. As is increased, more alternative structures begin to appear, and one can see the edges of the step begin to smooth. By kcal/mol a strong correlation is apparent even though there is a clear spread. If increased beyond kcal/mol, the correlation between the base pair frequency and the thermal ensemble probability differs in no significant qualitative way. From these correlations we deduce that as the level of parameter perturbations reaches the value of kcal/mol the pool of alternative secondary structures minimizing perturbed energy parameters and the pool of suboptimal structures probed in the thermal ensemble become similar. This is in a way surprising since the thermal energy itself is about kcal/mol and thus much smaller than the perturbation of the total free energy of a structure obtained by perturbing every free energy parameter by kcal/mol. It might imply that the base pair probability of an individual base pair is only sensitive to perturbations of a few key free energy parameters that delineate different low free energy structures from each other. Whatever the reason for the observed correlation, we can conclude that the easily calculable thermal probabilities are a good estimate for the sensitivity of a given base pair to parameter perturbations.
Discussion
We studied the sensitivity of RNA secondary structure prediction to perturbations of the free energy parameters. The main result is that if the free energy parameters are perturbed within a range that is supposed to be the experimental uncertainty with which these parameters have been determined, about 30% of the structure turns out to be unreliable and the chance of predicting the same ground state as with the unperturbed parameters is only 5% even for moderately sized sequences with lengths up to 426. Given this imprecision, we found that at least base pairing probabilities calculated in a thermal ensemble are reasonably well correlated with the probabilities that a base pair will be unaffected by uncertainties in the free energy parameters. These results support the commonly employed method of using thermal ensemble probabilities to sort out which parts of the structure can be trusted and which cannot. However, although calculation of the thermal ensemble zuker1998 ; mathews2004 is expedient, it offers only knowledge of how base pairings will behave on a individual basis, and not how they will behave in concert. The ground state probability method gives one not only a probabilistic measure of the accuracy of the prediction, but also all the probable alternative structures and some gauge of their likelihood of being the true structure. Should one have the computer power, one should always check the ground state and individual base pair probabilities using the method outlined in this paper. Doing so is imperative if the thermal ensemble suggests a dubious structure prediction. The amount of time sacrificed for the additional information is dependent upon how accurate one wishes the probabilities to be. With advances in computer chip technology, the extra factor of to in computation time involved in using the ground state probability as opposed to using the thermal ensemble may soon become a more practical investment in cases where it is of big importance to know in addition to the predicted structure which parts of the structure are likely to be correctly predicted and which should be discarded as simple artifacts of the imprecisions of the free energy model.
Acknowledgments
This research was supported by the Research Experience for Undergraduates programs of the National Science Foundation through grant number PHY-0242665.
References
- (1) Couzin,J. (2002) Small RNAs make big splash. Science 298, 2296.
- (2) Gilbert,W. (1986) Origin of life-the RNA world. Nature 319, 618 .
- (3) Hofacker,I.L., W. Fontana,W., Stadler,P.F., Bonhoeffer L.S., Tacker,M. and Schuster,P. (1994) Fast folding and comparison of RNA secondary structure. Monatsh. Chem. 125, 167.
- (4) Zuker,M. and Jacobson,A.B. (1995) Well-determined regions in RNA secondary structure prediction-analysis of small-subunit ribosomal RNA. Nucl. Acids Res. 23, 2791.
- (5) de Gennes,P.G. (1968) Statistics of branching and hairpin helixes for dAT copolymer. Biopolymers 6, 715.
- (6) Waterman,M.S. (1978) Secondary structure of single-stranded nucleic acids. Adv. Math. Suppl. Studies 1, 167.
- (7) McCaskill,J.S. (1990) The equilibrium partition-function and base pair binding probabilities for RNA secondary structures. Biopolymers, 29 1105.
- (8) Tinoco,I. Jr. and Bustamante,C. (1999) How RNA folds. J. Mol. Biol. 293, 271.
- (9) Mathews,D.H., Sabina,J., Zuker,M. and Turner,D.H. (1999) Expanded sequence dependence of thermodynamic parameters improves prediction of RNA secondary structure. J. Mol. Biol. 288, 911.
- (10) SantaLucia,J. (1998) A unified view of polymer, dumbbell, and oligonucleotide DNA nearest-neighbor thermodynamics. Proc. Natl. Acad. Sci. USA 95, 1460.
- (11) Kierzek,R., Caruthers,M.H., Longfellow,C.E., Swinton,D., Turner,D.H. and Freier,S.M. (1986) Polymer-supported RNA-synthesis and its application to test the nearest-neighbor model for duplex stability. Biochemistry 25, 7840.
- (12) Fontana,W., Konings,D.A., Stadler,P.F. and Schuster,P. (1993) Statistics of RNA secondary structures. Biopolymers 33, 1389.
- (13) Zuker,M. and Jacobson,A.B. (1998) Using reliability information to annotate RNA secondary structures. RNA 4, 669.
- (14) Mathews,D.H. (2004) Using an RNA secondary structure partition function to determine confidence in base pairs predicted by free energy minimization. RNA 10, 1178.