The influence of geometry, surface character and flexibility on the permeation of ions and water through biological pores
Abstract
A hydrophobic constriction site can act as an efficient barrier to ion and water permeation if its diameter is less than the diameter of an ion’s first hydration shell. This hydrophobic gating mechanism is thought to operate in a number of ion channels, e.g. the nicotinic receptor, bacterial mechanosensitive channels (MscL and MscS) and perhaps in some potassium channels (e.g. KcsA, MthK, and KvAP). Simplified pore models allow one to investigate the primary characteristics of a conduction pathway, namely its geometry (shape, pore length, and radius), the chemical character of the pore wall surface, and its local flexibility and surface roughness. Our extended (ca. 0.1 s) molecular dynamic simulations show that a short hydrophobic pore is closed to water for radii smaller than 0.45 nm. By increasing the polarity of the pore wall (and thus reducing its hydrophobicity) the transition radius can be decreased until for hydrophilic pores liquid water is stable down to a radius comparable to a water molecule’s radius. Ions behave similarly but the transition from conducting to non-conducting pores is even steeper and occurs at a radius of 0.65 nm for hydrophobic pores. The presence of water vapour in a constriction zone indicates a barrier for ion permeation. A thermodynamic model can explain the behaviour of water in nanopores in terms of the surface tensions, which leads to a simple measure of “hydrophobicity” in this context. Furthermore, increased local flexibility decreases the permeability of polar species. An increase in temperature has the same effect, and we hypothesise that both effects can be explained by a decrease in the effective solvent-surface attraction which in turn leads to an increase in the solvent-wall surface free energy.
1 Introduction
Although only about 3 nm thick, the membranes of living cells present an efficient barrier to polar substances such as water or ions. Transport of water and ions into and out of the cell is facilitated by specialised proteins. For molecules that move down their electro-osmotic gradients the proteins are ion channels [1] and water pores (aquaporins) [2]. They share common functional characteristics such as high specificity (for instance, the potassium channel KcsA prefers potassium ions over sodium ions, aquaporins allow the flow of water but not of ions or protons) and transport rates comparable to diffusion in bulk solution. Ion channels can also be switched (“gated”) between an open (ion conducting) and closed (ion blocking) state by external signals such as changes in transmembrane voltage, binding of a ligand, mechanical stress etc.
In recent years a number of near atomic resolution structures of ion channels [3, 4, 5, 6, 7, 8, 9, 10] and aquaporins [11, 12, 13, 14] have been published. Based on these structures an atomistic understanding of the transport and gating properties is emerging. If we view transport proteins as molecular machines which are designed by evolution to perform selective and efficient transport that can be controlled, i.e. gated, then we can ask what the “building blocks” of these machines are. This involves not only identification and structural characterisation of the protein domains involved in gating, but also, at a more abstract level, understanding the underlying physical principles.
Here we address the questions of what are physical properties that are important for the permeation of ions and water, and what is their effect? In particular we will focus on how the flow of ions and water can be controlled, i.e. we will investigate possible gating mechanisms. This interest is based on the observation that the putative gate in many known ion channel structures (in particular, the nicotinic acetylcholine receptor nAChR [10], the bacterial potassium channels KcsA [3] and KirBac1.1 [9], and the mechanosensitive channels MscL [4] and MscS [6]) is formed by a constriction made from hydrophobic residues. For example, the closed state nAChR structure displays an ion pathway which is still wide enough (radius nm) to admit three water molecules (radius of a water molecule nm) or one potassium ion ( nm) with half of its first hydration shell intact. It is somewhat surprising that a pore does not have to be completely physically occluded to prevent the flow of ions. On the other hand ions can readily move through the KcsA [3, 5] selectivity filter although its radius is less than 0.15 nm. When an ion enters the filter it has to shed its hydration shell at a high cost in free energy—the solvation free energy for a potassium ion is about kJ mol-1 [15]. The filter is lined by backbone oxygen atoms which coordinate the potassium ion and substitute for its hydration shell, thus reducing the desolvation barrier of kJ mol-1 to about kJ mol-1 [16]. The putative gates differ from the selectivity filter in that they are lined by hydrophobic residues. For nAChR [17, 10] and MscL [4, 18] it was already hypothesised that these residues cannot substitute for water molecules so that the energetic cost of desolvation prevents the passage of the ion.
It appears that the geometry of a pore (its radius, length and shape) and the chemical character of the pore wall have a great influence on the permeation of ions and water. In addition, local flexibility (i.e. fluctuations in the protein structure as opposed to concerted larger scale motions) of the pore lining might play a role, as seen in simulations of K+ permeation through KcsA [16].
It seems difficult to comprehend the dynamical nature of transport phenomena from static crystal structures alone. Computational methods can be used to complement the experimentally observed picture. In particular, classical molecular dynamics (MD) can be used to investigate the behaviour of water or ionic solutions in the environment presented by a protein. This realistic environment, however, makes it difficult to disentangle the contributions of various pore properties. In order to be able to reduce the number of parameters simplified pore models can be designed to capture the characteristics in question [19, 20, 21, 22, 23, 24, 25]. We focus on the influence of geometry, pore wall character and flexibility. In previous studies we investigated the behaviour of water in these “nanopores”. In particular, we found that below a critical radius liquid water becomes unstable in the pore and the pore is predominantly filled with water vapour [25]. We hypothesised that a pore environment which cannot sustain liquid water would also present a high energetic barrier to an ion [21]. Although it seems plausible that absence of water would imply the absence of ions it has not been demonstrated previously.
In this work we explicitly consider ions in model pores and explore dimensions, pore wall character, and flexibility in more detail than in our previous work. We also present a simple thermodynamic model based on surface energies that explains the observed behaviour of water in hydrophobic pores.
2 Methods and Theory
2.1 Model
The pore models were constructed as described previously [25]. Briefly, they consist of concentric rings of methane-like pseudo-atoms of van der Waals radius nm (figure 1). These are held in their equilibrium position by harmonic constraints with spring constant . A pore consists of two mouth regions (length nm, i.e. one layer of pseudo atoms, and radius nm) at either end of the constriction site of length (varied between nm and nm) and radius (varied between nm and nm). The pore was embedded in a membrane mimetic, a slab of pseudo atoms held on a cubic lattice with unit cell length nm with harmonic springs of strength . Pores with a polar surface were created by placing partial charges of on atomic sites nm apart. The resulting dipole moments pointed parallel to the pore axis with a magnitude of D each, which is comparable to the dipole moment of the peptide bond (ca. D [26]).

2.2 Molecular Dynamics
MD simulations were performed with gromacs v3.1.4 [29] and the SPC water model [30]. The Lennard-Jones-parameters for the interaction between a methane-like pseudo-atom and the water oxygen are kJ mol-1 and nm; parameters for sodium and chloride ions are taken from the Gromacs force field. The integration time step was fs and coordinates were saved every ps. With periodic boundary conditions, long range electrostatic interactions were computed with a particle mesh Ewald method (real space cutoff nm, grid spacing nm, 4th order interpolation [31]) while the short range van der Waals forces were calculated within a radius of nm. This treatment of electrostatic effects is known to influence the permeation of ions, especially in narrow pores. These artifacts need to be accounted for in order to obtain quantitative predictions of ionic currents [32]. However, though most likely present in our case, too, they are less important because of our emphasis on principles and order-of-magnitude effects. The neighbour list (radius nm) was updated every 10 steps. Weak coupling algorithms [33] were used to simulate at constant temperature ( K, time constant ps) and pressure ( bar, compressibility bar-1, time constant ps) with the and dimensions of the simulation cell held fixed at nm. The total thickness of the water reservoir in the -direction was nm, ensuring bulk-like water behaviour far from the membrane mimetic. The initial system configuration was created by solvating the slab-embedded pore model with water. For simulations with ions, some water molecules were replaced with ions to reach the target concentration. Initially there were always ions present in pores with nm. A typical simulation box measured nm3 and contained about water molecules and pseudo atoms (and between 25 to 28 Na+ and Cl- ions each).
2.3 State based analysis
We define discrete states by mapping equilibrium states of the whole system (snapshots from the MD equilibrium trajectory) onto numbers . The same approach is used in statistical mechanics to map different microscopic states to one macroscopic state, characterised by the value of a state variable, here called . This approach is used to label the two phase states that the pore water exhibits in our simulations. We either find liquid-filled pores or vapour-filled ones. Due to the small pore volumes “vapour” typically refers to zero or one water molecule in the cavity. We use the density in the pore as an indicator of the phase state. As described previously [25] we assign the state using a Schmitt-trigger procedure [34] in order to avoid spurious state changes due to fluctuations from the interfacial region. When the water density rises above of the density of bulk water, ( g cm-3 at K and bar) the liquid state, i.e. , is assigned to the phase state at time . When drops below the vapour state () is assigned. The pore in the liquid-filled state is termed “open” because our simulations show that significant amounts of water pass through it; furthermore, we also demonstrate in this work that a pore that sustains a liquid environment potentially allows ions to permeate. A vapour-plugged pore, however, will prevent ion permeation and is said to be “closed”.
Liquid-filled pores and vapour-filled pores are assumed to be in equilibrium. The “openness” (or probability for the occurrence of the liquid, i.e. open, state is
| (1) |
where denotes the total simulation time, the total time that the pore is open, whereas is the total time in the vapour or closed state. If then equilibrium is on the side of liquid (and vapour is a meta stable state), otherwise the stable phase state is vapour. The equilibrium is governed by the equilibrium constant
| (2) |
which is trivially related to the openness. [Note that for or it is meaningless to compute because it indicates that the simulation time was too short to sample any state changes.]
2.4 Thermodynamic model for liquid-vapour equilibrium in pores
We investigate a subsystem of the whole simulation system comprising of the pore of volume . The subsystem can exchange water molecules with the bulk water outside the pore, which acts as a particle reservoir at average chemical potential . is implicitly determined by the constant average density of water in the bulk system, which in turn is prescribed by simulating at constant pressure. Hence we can use the grand potential as the free energy to describe the subsystem in the closed and open state [24]. The equilibrium constant is determined by the free energy difference between the closed (vapour) and open (liquid) state,
| (3) |
using . Following Evans [35], we write the free energy difference between the vapour and the liquid state with the corresponding surface contributions as
| (4) |
Here the index indicates the solid pore wall, the liquid and the vapour phase; for instance is the surface tension or surface free energy per area of the liquid-vapour interface. The system is fairly close to bulk phase coexistence so we can expand the pressure around the saturation chemical potential in a Taylor series
| (5) |
where at saturation . This leads to a simple parabolic form for the free energy difference between the two states:
| (6) |
where we define the distance of the state from saturation , the difference in densities at saturation, and the difference in surface free energies of the two phases with the wall, . The term is small for nm as the system is close to phase coexistence (for nm it is about times smaller than when estimated from , K) and will be neglected. Only the difference between the surface free energies enters the model so we express it as the contact angle , using the macroscopic definition from Young’s equation (see, for instance, Ref. [36]). Then equation 6 becomes
| (7) |
(equation 7 is similar to the simple model derived by Allen et al. [24] but it includes and hence instead of just .) For fixed pore length and a given pore material, characterised by , the graph of over the pore radius describes a parabola containing the origin. Although it is not a priori obvious that such a macroscopic treatment (equation 6 or equation 7) of a nanoscale system is meaningful the MD results for the free energy difference presented in section 3.1 can be adequately explained within this model.
3 Results and Discussion
First we investigate the behaviour of pure water in nanopores and quantify the influence of geometry, pore surface and local flexibility on the equilibrium between liquid and vapour filled pores. Then simulations for a NaCl electrolyte are analysed and compared to the pure water case. The intention behind these studies is to explore more fully the ways in which a hydrophobic gate may be opened, and how other factors might modulate such hydrophobic gating. This is particularly important in the context of current models for the gating of nAChR [37, 10] that suggest that the transition between the closed and open states of the pore involves both an increase in pore radius and in polarity. We also note that recent discussion of the state (open vs. closed) of MscS have suggested a hydrophobic gating mechanism [38], similar to that proposed for nAChR [21].
3.1 Pure water
A large number of simulations were run for water in model pores (total simulation time s) in order to investigate the influence of pore radius () and pore surface character (hydrophobic vs. amphipathic vs. hydrophilic). Local flexibility (wall atom positional root mean square deviations (RMSDs) ) and temperature dependence in the range were examined for a hydrophobic nm pore.
Pore dimensions and surface character
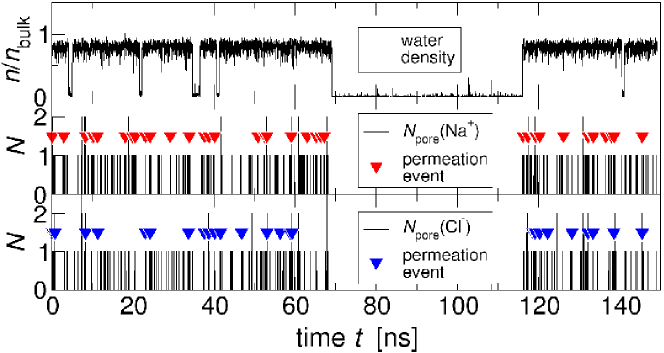
The water density in short nanopores oscillates between liquid and vapour on a nanosecond time scale as seen in figure 2, a manifestation of capillary evaporation and condensation at the nanoscale [25]. In figure 3 the openness and the free energy difference between vapour and liquid states is shown for different pore surfaces. For hydrophobic and amphipathic pores a strong dependence of the pore state on the radius is apparent. The stable thermodynamic state switches from vapour ( or ) to liquid ( or ) at a critical radius (using in equation 7). is nm for the hydrophobic pore and nm for the amphipathic one. The functional form equation 6 fits the data from the MD simulations (table 1) well (the continuous lines in figure 3).
| pore surface character | ||||||||
|---|---|---|---|---|---|---|---|---|
| bare CH4 | 0 | “hydrophobic” | ||||||
| two dipoles | D2 | “amphipathic” | ||||||
| four dipoles | D4 | “hydrophilic” | ||||||
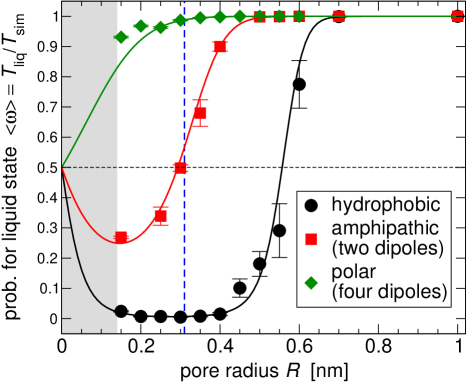
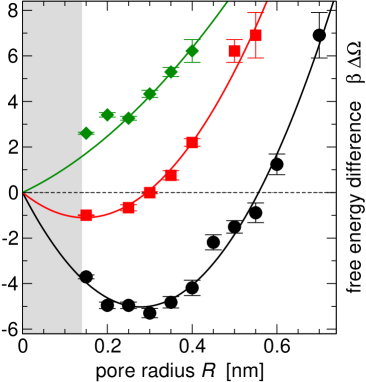
The coefficient of the quadratic term, , is positive and similar for both the hydrophobic and the amphipathic (two dipoles, abbreviated D2) pores (table 1), consistent with the model equation 6, which predicts this coefficient to be independent of the pore wall. For the polar pore (four dipoles, D4) the data is more ambiguous. Only if the first two data points at small radii are excluded from the fit as outliers is this coefficient positive (but still three times smaller than the one for the less hydrophilic pores). The outliers show that a high density of local charges leads to a higher probability of the pore being liquid-filled than predicted by the macroscopic model, possibly indicating a shortcoming of the model to subsume inhomogeneous potentials into the surface tension terms. For our system parameters, the coefficient is in fact dominated by the water liquid-vapour surface tension (see section 2.4) and hence we will use its value as an approximation to . , the difference in surface tensions between the wall and vapour or liquid, becomes more positive with increasing polarity of the pore wall. It effectively measures the hydrophobicity of the wall. This becomes even more apparent when the (macroscopic) contact angle is formally computed (table 1). Macroscopically, a hydrophobic surface can be defined as one with . This allows us to call the apolar pore () “hydrophobic” compared to the “amphipathic” pore D2 (; still hydrophobic but with some “hydrophilic” patches). A “hydrophilic” pore like the D4 system () is characterised by or and liquid is always the preferred phase in the pore, regardless of .
Experimental macroscopic contact angles for water on flat methyl (–CH3) terminated self assembled monolayers are reported up to [40, 41]. A “microscopic contact angle” of was calculated for a droplet of 90 water molecules (radius nm) on a methyl terminated film from MD simulations [42], consistent with our result of . MD simulations seem to overestimate the experimental equilibrium contact angle. In this context we note that although the macroscopic equilibrium contact angle is only established about nm from the contact line, the local contact angle in the core structure of the contact line (in the region – nm from the contact line) in water (and electrolytes) is predicted to be larger than due to electrostatic screening effects [36].
From the model free energy the openness can be calculated (equation 8) and displayed together with the MD results (figure 3). Because the model effectively treats the liquid as a structureless continuum it is not meaningful to extrapolate to radii smaller than the radius of a water molecule (the shaded region in figure 3). Nevertheless, the MD results lie on the model curve even in the direct vicinity of this region. Further tests of equation 7 by varying the length of the pore together with the radius confirm the model qualitatively (data not shown).
Our model implies that for both nano- and mesoscale pores the cost of creating the liquid-vapour interface is the only force driving the filling of a hydrophobic () pore. Little free energy is gained by creating a bulk-like liquid in the pore instead of vapour.
Local flexibility
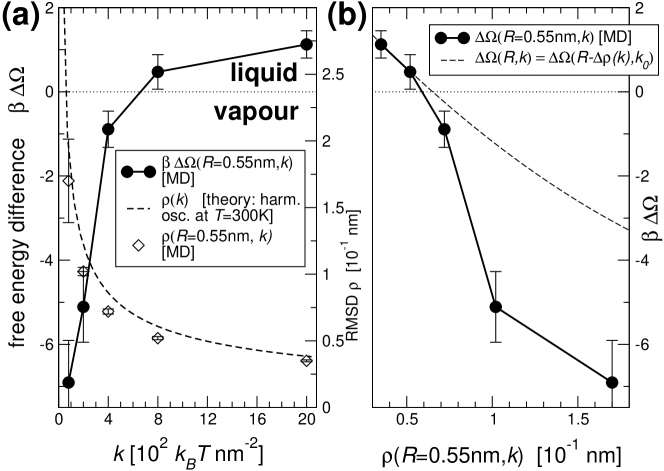
The influence of local fluctuations in protein structure can be modelled by changing the harmonic spring constant that holds the pore wall atoms at their equilibrium positions. In a simplified picture of a harmonic oscillator with an average energy per degree of freedom the RMSD is directly related to by . This simple model overestimates the measured RMSDs by only 10–20% (table 2), showing that the wall atoms behave like almost independent, thermally driven, harmonic oscillators (figure 4a).
| restraint force constant | RMSD [ nm] | ||||||
|---|---|---|---|---|---|---|---|
| [nm-2] | MD | theory | MD | MD | |||
At a fixed radius, increasing the flexibility (smaller , hence greater ) shifts the equilibrium towards vapour (figure 4). Conversely, a more rigid wall favours the condensation of water in the pore. Thus, water does not “push away” the pore walls to fill the pore but rather fluctuating pore walls appear to disfavour the formation of adjacent water layers. This effect cannot be explained with the assumption that the water molecules encounter a more narrow pore “on average”. Even if one assumes that the pore is narrowed by the RMSD of an atom down to an effective radius , the effect is still much stronger. When the thermodynamic model and the parameters for the hydrophobic pore (from table 1 where ) are used to predict then the prediction compared to the simulation results underestimates the effect for the more flexible pores but is in agreement for more rigid pores (figure 4b). We hypothesise that the random positional fluctuations of the wall atoms change the effective potential between the wall atom and water molecules by “smearing out” the attractive well of the interaction potential. Preliminary calculations showed that an increase in flexibility (or temperature) would always decrease the well depth of the Lennard-Jones potential, which is used to describe the interaction between a water molecule and the methane molecules of the pore wall. Nijmeijer et al. [43] demonstrated the dependence of the surface tension on the well depth of the interaction potential analytically. MD simulations of a water droplet with 1000 molecules ( nm) on a graphite-like surface with varying well depth yielded a contact angle that varied from to [44]. Thus it is the well depth of the interaction potential which ultimately determines the thermodynamic equilibrium in the pore. This is made explicit by considering equation 6 and noting that depends on the water-wall surface tensions through , which in turn depend on . For the case of water in confined geometries it was shown that capillary condensation and evaporation phenomena depend sensitively on [45, 46, 25] (or more precisely, on the effective well depth, the product of the wall atom density with [25]).
3.2 NaCl electrolyte
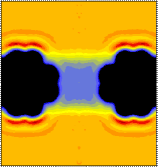
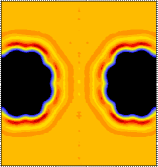
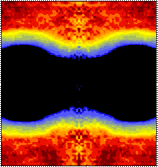
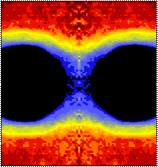
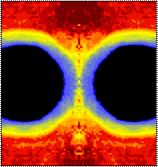
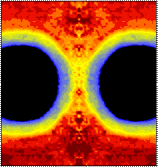
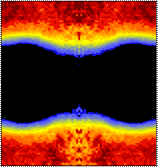
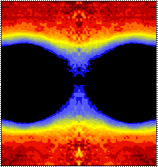
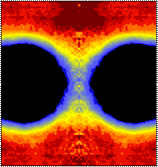
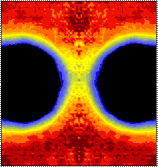
As mentioned in the Introduction it has been hypothesised that a local hydrophobic environment would present a significant desolvation barrier to ion permeation. Our simulations of model pores bathed in a M NaCl solution exhibit a striking change in the behaviour of the ions for pore radii nm. Figure 5 shows that in pores of comparable dimensions to the closed nAChR pore ( nm) ions have a vanishing probability of entering the pore, but at the open-state radius nm the pore density rises to half the bulk value.
| 0.35 nm | 0.6 nm | 0.65 nm | 0.75 nm | |
|---|---|---|---|---|
|
water |
 |
 |
 |
 |
|
M Na+ |
 |
 |
 |
 |
|
M Cl- |
 |
 |
 |
 |
density scale:
water:
ions: mol l-1
![]()
The average density of ions in the centre of the pore (figure 6) also exhibits a sharp increase near nm, similar to the behaviour of the openness (figure 3).
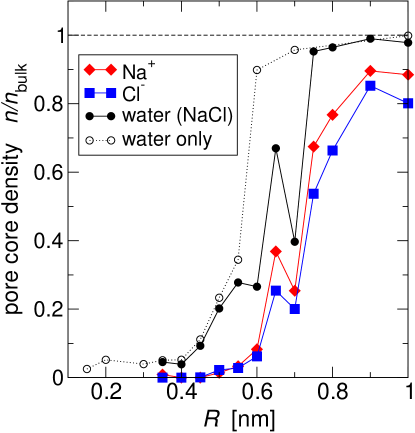
The radially averaged densities show two pronounced water layers with an interlayer distance nm near the membrane mimetic. The ionic density drops off sharply at the maximum of the outermost water layer and vanishes completely at the maximum of the water layer closest to the surface. Sodium and chloride ions are both present at the same distance from the surface. Because the membrane mimetic carries no charge and represents a low dielectric region (as do the less mobile bound water layers) it is energetically more favourable for the ions to be solvated in the high dielectric region of the bulk-like water. The bound water layers are not a consequence of the presence of the ions as they also form in pure water near a hydrophobic surface with the same interlayer spacing of nm [25], and in this case even a third water layer is discernible with nm. Water ordering in cylindrical and slit pores in the absence of ions was also observed in simulations by other groups [19, 20, 47, 24, 48, 49]. Effectively, ions are excluded from a zone of thickness nm (Na+) or nm (Cl-) from the surface. The ion exclusion zone stretches into the pore without interruption so that at nm there is only a narrow channel of easily displaceable water which can admit ions. For wider pores, the ion density in the pore approaches bulk values (figure 6).
Although the absence of ionic density can be taken as a strong indication for a closed pore the presence of equilibrium density does not necessarily imply a functionally open state, as the latter also requires rapid permeation of ions through a pore. As MD simulations output the trajectories of water and ions, the equilibrium flux (), i.e. the total number of particles per nanosecond which completely permeate the pore, can be measured. Figure 7 shows for ions and water molecules (both for water in a M NaCl electrolyte and for pure water) in hydrophobic pores of varying radius on a logarithmic scale. Water flux is about three orders of magnitude larger than ion flux and increases rapidly with increasing radii while is smaller than the critical radius nm. Beyond (when liquid becomes the stable phase) the slope in the logarithmic plot decreases from nm-1 to nm-1. The water current density reaches a constant value of so the increase for is only due to the increase in pore diameter. The increase for correlates with the openness (figure 3), indicating that the main contribution to the flux stems from the open-state periods [25]. The presence of ions slightly shifts from nm for pure water to nm for M NaCl electrolyte. Qualitatively, this is explained by the increase of surface tension with ionic concentration [50]. This leads to a higher contact angle [51], which is also observed in our simulations where it increases from to . Hence, increases for electrolytes compared to pure water.
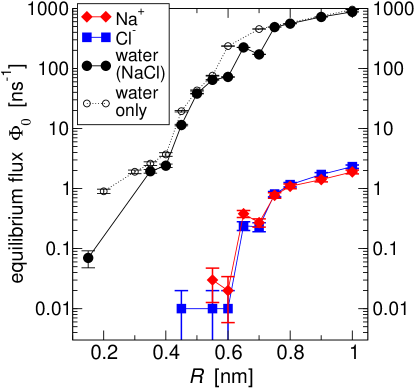
The total number of ions that successfully permeate the pore per nanosecond shows an increase over almost two orders of magnitude when the pore radius is increased from nm to nm. Thus the pore “opens” at a radius much larger than the bare ionic radius. Ions permeate only when the pore is filled with liquid water (typical data in figure 2) and Na+ permeation events are not correlated with Cl- ions passing through the pore.
Because the simulations are in thermodynamic equilibrium the net flux through the pore is zero for all . In order to compare the MD equilibrium flux , which is determined by the intrinsic free energy barrier to ion permeation, to experimentally measured non-equilibrium fluxes of ions of charge at a driving transmembrane voltage we employ rate theory and estimate
| (9) |
For nm, mV, and K we obtain ns-1, which is 40 times larger than the experimental value of ns-1 for nAChR at M ionic concentration (calculated from a conductance of ca. pS [1]). The discrepancy between our estimate and the experimental data is not unexpected as equation 9 has only qualitative character. Furthermore, nAChR presents a more complex pore lining surface than the model pore, and if the difference in bath concentrations and access resistance was taken into account the discrepancy would likely be reduced by an order of magnitude. Nevertheless, the estimate demonstrates that the intrinsic barrier to ion permeation is small beyond the critical radius.
3.3 Sensing external parameters
In the simplest model of sensing a system exists in an equilibrium with two states. External stimuli shift the equilibrium which elicits a cellular response. For example, a temperature-sensing channel at normal temperature might be in the closed state. Elevated temperature shifts the equilibrium to the open state and the influx of ions initiates a signalling cascade that terminates in the sensation of heat. However, the exact mechanisms of gating by temperature of e.g. TRP channels remain obscure [52].
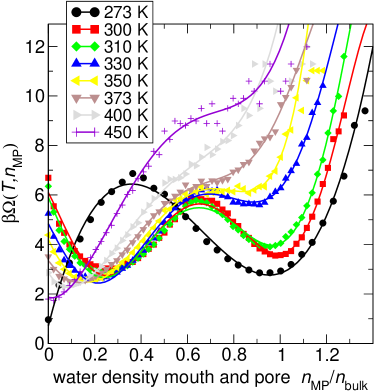

We tested the influence of temperature in the range from K to K on water in the nm hydrophobic pore (data points for K represent “supercritical” water because the critical point for the SPC water model is close to K). The free energy landscape of the water-pore system depends on the temperature (figure 8a). With increasing temperature the liquid state (i.e. near water bulk density) decreases in stability. Accordingly, the openness decreases with temperature so that the vapour state, i.e. the closed stated, dominates at higher temperatures (figure 8b). The decrease in openness with increasing indicates that the difference of the wall surface tensions must become even more negative, i.e. vapour in contact with the wall is increasingly favoured. The effect would be similar to the one discussed for increased flexibility of wall atoms as the major effect of temperature would be to smear out the interaction potential between water molecules and wall atoms. This example demonstrates in principle how an external signal, an increase in temperature from K to K, decreases the openness, and correspondingly the flux of water molecules, by a factor of six.
4 Conclusions and outlook
We have explicitly demonstrated a hydrophobic gating mechanism for ions, using simplified hydrophobic pores as models for the closed gates of ion channels. There is a critical radius above which a pore becomes effectively permeable to water or ions. nm for water and nm for ions, is much larger than the radius for a water molecule or a bare ion alone. This correlates nicely with the current view that the closed state structures of many ion channels contain gates formed by hydrophobic constriction sites. In nAChR the radius of the putative gate is nm, nm in MscL, and nm in KcsA. Models of KcsA and of Kv channels in their open states, based on the MthK and KvAP structures respectively, have gate radii of about nm [53], whereas the open-state nAChR structure opens up to about nm. Our simulations show that the polarity of the pore wall can shift the critical radius considerably. This is reflected in the proposed gating mechanism of nAChR [37]. Not only does the radius of the constriction site increase but hydrophobic sidechains are also rotated out of the pore to expose the more polar, i.e. hydrophilic, peptide backbone. By combining hydrophobic gating with a change in surface polarity only a moderate change in radius is required to obtain a large physiological effect. Changes in local flexibility may also modulate the gating behaviour. It is too early to ascertain their importance as such changes in flexibility have not been widely investigated experimentally for channels (or any other proteins). There are suggestions of possible regulatory roles of changes in flexibility in e.g. KTN domains [54], and in the modulation of binding of TRAP protein to the Trp operon mRNA [55]. Temperature can also affect gating, in a fashion similar to local flexibility, but its direct effects seem too small to explain, for instance, the temperature sensitivity of TRP channels on their own.
A thermodynamic model based on surface energies fits remarkably well the data of the atomic-scale MD simulation, even for very small radii. Though such a macroscopic treatment is not a priori expected to give a satisfactory description of a microscopic system there are other examples as for instance classical nucleation theory, which shares some similarities with our and others’ models [24, 56]. It generally agrees quite well with experiments on the condensation of droplets from vapour, which implies that the use of macroscopic surface tension is valid even for droplets of radii of about nm [57]. It appears that in this case water structure (i.e. a hydrogen bond network) is only important insofar that it is responsible for different wall-fluid surface tensions. Our results seem to corroborate the conclusions of Maibaum and Chandler [58] that two-state behaviour of water in pores should only require a cold liquid close to phase coexistence and sufficiently different vapour-wall and liquid-wall surface tensions (which is, of course, where the “special” properties of water reside in such a model).
We have sketched out principles of gating mechanisms in ion channels, based on model channels. Ion channels in nature display complex conformational dynamics in relationship to gating. There is a need for better single molecule methods for ion channels to probe these phenomena experimentally. Combined electrical and optical methods look promising in this respect [59] although considerable improvements in time resolution are still required. In the meantime there is a continued role for simulations and theory to enable us to bridge between static structure and dynamic function.
In addition to hydrophobic gating per se, our studies suggest the possible importance of gate flexibility in regulation of biological activity. The relationship between static structures, conformational change, and intrinsic flexibility in relationship to proteins and signalling merits further active investigation. In a recent review of protein-protein interactions and conformational changes, Goh et al. [60] conclude that there is increasing support for a pre-existing equilibrium model. In such a model, proteins exist in a population of conformations, with ligand binding leading to a change in the probability distribution of the ensemble. Some evidence in support of this have been obtained from recent simulation studies of ligand binding proteins (e.g. [61]) but further (single-molecule) experimental and computational studies of a wider range of proteins are needed to more firmly establish the general importance of changes in flexibility.
Acknowledgements
We are grateful for the interest and encouragement of all our colleagues and for discussions with Paul Barrett, Kaihsu Tai, Campbell Millar, José Faraldo-Gómez, Benoît Roux and Nigel Unwin. This work was funded by The Wellcome Trust.
Abbreviations list
- MD
-
molecular dynamics
- SPC
-
simple point charge water model
- RMSD
-
root mean square deviation
- nAChR
-
nicotinic acetylcholine receptor
- MscS
-
mechanosensitive channel of small conductance (Escherichia coli)
- MscL
-
mechanosensitive channel of large conductance (Mycobacterium tuberculosis)
- KcsA
-
potassium channel (Streptomyces lividans)
- KirBac1.1
-
inward rectifier potassium channel (Burkholderia pseudomallei)
- MthK
-
calcium-gated potassium channel (Methanobacterium thermoautrophicum)
- KvAP
-
voltage-dependent potassium channel (Aeropyrum pernix)
- D2
-
model pore containing two dipoles (amphipathic)
- D4
-
model pore containing four dipoles (hydrophilic)
- TRP
-
transient receptor potential channel family
- KTN
-
potassium transport, nucleotide binding domain
- TRAP
-
trp RNA-binding attenuation protein
- trp
-
tryptophan
- mRNA
-
messenger RNA
Glossary
- Classical molecular dynamics
-
A computational scheme to calculate the time evolution of a microscopic system that is treated in atomic detail. Interactions are parametrised through classical two, three or four body potentials. A collection of these parameters is known as a “force field”. The dynamics are obtained by integrating Newton’s equations of motion.
- Gating
-
An ion channel can exist in an “open” state, which allows for ion permeation, and a “closed” state, when ions cannot pass the channel’s gate and thus are prevented from crossing the membrane. Such a channel can be switched between states by external signals.
- Surface tension, surface free energy
-
The free energy per area required to create an interface between two phases. It is always positive, i.e. it always costs free energy to create a surface compared to the homogeneous bulk phases.
- Contact angle
-
The angle which is formed between the tangent on a droplet of liquid where it is contact with the surface and the surface itself. The droplet is taken to be in equilibrium with its vapour. A surface material is called hydrophobic (“water-hating”) when the contact angle with water is greater than (the drop sits on the surface) and hydrophilic (“water-loving”) when it is smaller (the drop resembles a pancake).
References
- Hille [2001] Hille B, 2001 Ion Channels of Excitable Membranes, 3rd edn. (Sinauer Associates, Sunderland MA, U.S.A.).
- Fujiyoshi et al. [2002] Fujiyoshi Y, Mitsuoka K, de Groot B L, Philippsen A, Grubmüller H, Agre P and Engel A, 2002 Structure and function of water channels. Curr. Opin. Struct. Biol. 12 509–515.
- Doyle et al. [1998] Doyle D A, Morais-Cabral J, Pfützner R A, Kuo A, Gulbis J M, Cohen S L, Chait B T and MacKinnon R, 1998 The structure of the potassium channel: molecular basis of K+ conduction and selectivity. Science 280 69–77.
- Chang et al. [1998] Chang G, Spencer R H, Lee A T, Barclay M T and Rees D C, 1998 Structure of the MscL homolog from Mycobacterium tubercolosis: a gated mechanosensitive ion channel. Science 282 2220–2226.
- Zhou et al. [2001] Zhou Y, Morais-Cabral J H, Kaufman A and MacKinnon R, 2001 Chemistry of ion coordination and hydration revealed by a K+ channel-Fab complex at 2.0 Å resolution. Nature 414 43–48.
- Bass et al. [2002] Bass R B, Strop P, Barclay M and Rees D C, 2002 Crystal structure of Escherichia coli MscS, a voltage-modulated and mechanosensitive channel. Science 298 1582–1587.
- Jiang et al. [2002] Jiang Y, Lee A, Chen J, Cadene M, Chait B T and MacKinnon R, 2002 Crystal structure and mechanism of a calcium-gated potassium channel. Nature 417 515–22.
- Jiang et al. [2003] Jiang Y, Lee A, Chen J, Ruta V, Cadene M, Chait B T and MacKinnon R, 2003 X-ray structure of a voltage-dependent K+ channel. Nature 423 33–41.
- Kuo et al. [2003] Kuo A, Gulbis J M, Antcliff J F, Rahman T, Lowe E D, Zimmer J, Cuthbertson J, Ashcroft F M, Ezaki T and Doyle D A, 2003 Crystal structure of the potassium channel KirBac1.1 in the closed state. Science 300 1922–1926.
- Miyazawa et al. [2003] Miyazawa A, Fujiyoshi Y and Unwin N, 2003 Structure and gating mechanism of the acetylcholine receptor pore. Nature 423 949–955.
- Murata et al. [2000] Murata K, Mitsuoka K, Hirai T, Walz T, Agre P, Heymann J B, Engel A and Fujiyoshi Y, 2000 Structural determinants of water permeation through aquaporin-1. Nature 407 599–605.
- Fu et al. [2000] Fu D, Libson A, Miercke L J, Weitzman C, Nollert P, Krucinski J and Stroud R M, 2000 Structure of a glycerol-conducting channel and the basis for its selectivity. Science 290 481–486.
- Sui et al. [2001] Sui H, Han B G, Lee J K, Walian P and Jap B K, 2001 Structural basis of water-specific transport through the AQP1 water channel. Nature 414 872–878.
- Savage et al. [2003] Savage D F, Egea P F, Robles-Colmenares Y, O’Connell III J D and Stroud R M, 2003 Architecture and selectivity in aquaporins: 2.5 Å X-ray structure of aquaporin Z. PLoS Biology 1 334–340.
- Lyubartsev et al. [1998] Lyubartsev A P, Førrisdahl O K and Laaksonen A, 1998 Solvation free energies of methane and alkali halide ion pairs: An expanded ensemble molecular dynamics simulation study. J. Chem. Phys. 108 227–233.
- Bernèche and Roux [2001] Bernèche S and Roux B, 2001 Energetics of ion conduction through the K+ channel. Nature 414 73–77.
- Unwin [1993] Unwin N, 1993 Nicotinic acetylcholine-receptor at 9 Å resolution. J. Mol. Biol. 229 1101–1124.
- Moe et al. [2000] Moe P C, Levin G and Blount P, 2000 Correlating a protein structure with function of a bacterial mechanosensitive channel. J. Biol. Chem. 275 31121–31127.
- Lynden-Bell and Rasaiah [1996] Lynden-Bell R M and Rasaiah J C, 1996 Mobility and solvation of ions in channels. J. Chem. Phys. 105 9266–9280.
- Allen et al. [1999] Allen T W, Kuyucak S and Chung S H, 1999 The effect of hydrophobic and hydrophilic channel walls on the structure and diffusion of water and ions. J. Chem. Phys. 111 7985–7999.
- Beckstein et al. [2001] Beckstein O, Biggin P C and Sansom M S P, 2001 A hydrophobic gating mechanism for nanopores. J. Phys. Chem. B 105 12902–12905.
- Crozier et al. [2001] Crozier P S, Henderson D, Rowley R L and Busath D D, 2001 Model channel ion currents in NaCl-Extended Simple Point Charge water solution with applied-field molecular dynamics. Biophys. J. 81 3077–3089.
- Allen et al. [2002] Allen R, Melchionna S and Hansen J P, 2002 Intermittent permeation of cylindrical nanopores by water. Phys. Rev. Lett. 89 175502–1–175502–4.
- Allen et al. [2003] Allen R, Hansen J P and Melchionna S, 2003 Molecular dynamics investigation of water permeation through nanopores. J. Chem. Phys. 119 3905–3919.
- Beckstein and Sansom [2003] Beckstein O and Sansom M S P, 2003 Liquid-vapor oscillations of water in hydrophobic nanopores. Proc. Natl. Acad. Sci. USA 100 7063–7068.
- Eisenberg and Crothers [1979] Eisenberg D and Crothers D, 1979 Physical Chemistry with Applications to the Life Sciences (The Benjamin/Cummings Publishing Company, Menlo Park, California).
- Humphrey et al. [1996] Humphrey W, Dalke A and Schulten K, 1996 VMD – Visual Molecular Dynamics. J. Mol. Graph. 14 33–38, {http://www.ks.uiuc.edu/Research/vmd/}.
- Merritt and Bacon [1997] Merritt E A and Bacon D J, 1997 Raster3D: Photorealistic molecular graphics. Methods in Enzymology 277 505–524, http://www.bmsc.washington.edu/raster3d/raster3d.html.
- Lindahl et al. [2001] Lindahl E, Hess B and van der Spoel D, 2001 GROMACS 3.0: A package for molecular simulation and trajectory analysis. J. Mol. Mod. 7 306–317, {http://www.gromacs.org}.
- Hermans et al. [1984] Hermans J, Berendsen H J C, van Gunsteren W F and Postma J P M, 1984 A consistent empirical potential for water-protein interactions. Biopolymers 23 1513–1518.
- Darden et al. [1993] Darden T, York D and Pedersen L, 1993 Particle mesh Ewald – an method for Ewald sums in large systems. J. Chem. Phys. 98 10089–10092.
- Allen et al. [2004] Allen T W, Andersen O S and Roux B, 2004 Energetics of ion conduction through the gramicidin channel. Proc. Natl. Acad. Sci. USA 101 117–122.
- Berendsen et al. [1984] Berendsen H J C, Postma J P M, DiNola A and Haak J R, 1984 Molecular dynamics with coupling to an external bath. J. Chem. Phys. 81 3684–3690.
- Sakmann and Neher [1983] Sakmann B and Neher E, eds., 1983 Single-Channel Recordings (Plenum Press, New York).
- Evans [1990] Evans R, 1990 Fluids adsorbed in narrow pores: phase equilibria and structure. J. Phys.: Condens. Matter 2 8989–9007.
- de Gennes [1985] de Gennes P G, 1985 Wetting: statics and dynamics. Rev. Mod. Phys. 57 827–863.
- Unwin [2000] Unwin N, 2000 The Croonian Lecture 2000. Nicotinic acetylcholine receptor and the structural basis of fast synaptic transmission. Phil. Trans. Roy. Soc. London B 355 1813–1829.
- Anishkin and Sukharev [2004] Anishkin A and Sukharev S, 2004 Water dynamics and dewetting transitions in the small mechanosensitive channel MscS. Biophys. J. in press.
- Hess [1999] Hess B, 1999 Stochastic concepts in molecular simulation, Ph.D. thesis, Rijksuniversiteit Groningen, Groningen, {http://www.ub.rug.nl/eldoc/dis/science/b.hess/}.
- Wu et al. [2002] Wu Y, Sugimura H, Inoue Y and Takai O, 2002 Thin films with nanotextures for transparent and ultra water-repellent coatings produced from trimethylmethoxysilane by microwave plasma CVD. Chem. Vapor Depos. 8 47–50.
- Whitesides and Laibinis [1990] Whitesides G M and Laibinis P E, 1990 Wet chemical approaches to the characterization of organic surfaces: Self-assembled monolayers, wetting, and the physical-organic chemistry of the solid-liquid interface. Langmuir 6 87–96.
- Hautman and Klein [1991] Hautman J and Klein M L, 1991 Microscopic wetting phenomena. Phys. Rev. Lett. 67 1763–1766.
- Nijmeijer et al. [1991] Nijmeijer M J P, Bruin C, Bakker A F and van Leeuwen J M J, 1991 Determination of the location and order of the drying transition with a molecular dynamics simulation. Phys. Rev. B 44 834–837.
- Lundgren et al. [2002] Lundgren M, Allan N L, Cosgrove T and George N, 2002 Wetting of water and water/ethanol droplets on a non-polar surface: A molecular dynamics study. Langmuir 18 10462–10466.
- Hummer et al. [2001] Hummer G, Rasaiah J C and Noworyta J P, 2001 Water conduction through the hydrophobic channel of a carbon nanotube. Nature 414 188–190.
- Giaya and Thompson [2002] Giaya A and Thompson R W, 2002 Water confined in cylindrical micropores. J. Chem. Phys. 117 3464–3475.
- Mashl et al. [2003] Mashl R J, Joseph S, Aluru N R and Jakobsson E, 2003 Anomalously immobilized water: A new water phase induced by confinement in nanotubes. Nano Lett. 3 589–592.
- Spohr et al. [1998] Spohr E, Trokhymchuk A and Henderson D, 1998 Adsorption of water moelcules in slit pores. J. Electroanalyt. Chem. 450 281–287.
- Striolo et al. [2003] Striolo A, Chiavolo A A, Cummings P T and Gubbins K E, 2003 Water adsorption in carbon-slit nanopores. Langmuir 19 8583–8591.
- Dill and Bromberg [2003] Dill K A and Bromberg S, 2003 Molecular Driving Forces (Garland Science, New York).
- Williams [1975] Williams R, 1975 Interfacial free energies between polymers and aqueous electrolyte solutions. J. Phys. Chem. 79 1274–1276.
- Clapham [2003] Clapham D E, 2003 TRP channels as cellular sensors. Nature 426 517–524.
- Beckstein et al. [2003] Beckstein O, Biggin P, Bond P, Bright J, Domene C, Grottesi A, Holyoake J and Sansom M, 2003 Ion channel gating: insights via molecular simulations. FEBS Lett. 555 85–90.
- Roosild et al. [2002] Roosild T P, Miller S, Booth I R and Choe S, 2002 A mechanism of regulating transmembrane potassium flux through a ligand-mediated conformational switch. Cell 109 781–791.
- McElroy et al. [2002] McElroy C, Manfredo A, Wendt A, Gollnick P and Foster M, 2002 TROSY-NMR studies of the 91 kDa TRAP protein reveal allosteric control of a gene regulatory protein by ligand-altered flexibility. J. Mol. Biol. 323 463–473.
- Huang et al. [2003] Huang X, Margulis C J and Berne B J, 2003 Dewetting-induced collapse of hydrophobic particles. Proc. Natl. Acad. Sci. USA 100 11953–11958.
- Adamson [1990] Adamson A W, 1990 Physical Chemistry of Surfaces, 5th edn. (John Wiley & Sons, Inc, New York).
- Maibaum and Chandler [2003] Maibaum L and Chandler D, 2003 A coarse-grained model of water confined in a hydrophobic tube. J. Phys. Chem. B 107 1189–1193.
- Harms et al. [2003] Harms G S, Orr G, Montal M, Thrall B D, Colson S D and Lu H P, 2003 Probing conformational changes of gramicidin ion channels by single-molecule patch-clamp fluorescence microscopy. Biophys. J. 85 1826–1838.
- Goh et al. [2004] Goh C S, Milburn D and Gerstein M, 2004 Conformational changes associated with protein-protein interactions. Curr. Opin. Struct. Biol. 14 104–109.
- Pang et al. [2003] Pang A, Arinaminpathy Y, Sansom M S P, and Biggin P C, 2003 Interdomain dynamics and ligand binding: Molecular dynamics simulations of glutamine binding protein. FEBS Lett. 550 168–174.