Modularity “for free” in genome architecture?
Abstract
Abstract
Background Recent models of genome-proteome
evolution have shown that some of the key traits displayed by the
global structure of cellular networks might be a natural result of a
duplication-diversification (DD) process. One of the consequences of
such evolution is the emergence of a small world architecture together
with a scale-free distribution of interactions. Here we show that the
domain of parameter space were such structure emerges is related to a
phase transition phenomenon. At this transition point, modular
architecture spontaneously emerges as a byproduct of the DD process.
Results Although the DD models lack any
functionality and are thus free from meeting functional constraints,
they show the observed features displayed by the real proteome maps
when tuned close to a sharp transition point separating a highly
connected graph from a disconnected system. Close to such boundary,
the maps are shown to display scale-free hierarchical organization,
behave as small worlds and exhibit modularity.
Conclusions It is conjectured that natural selection tuned the average connectivity in such a way that the network reaches a sparse graph of connections. One consequence of such scenario is that the scaling laws and the essential ingredients for building a modular net emerge for free close to such transition.
I Introduction
The intimate structure of cellular life is largely associated to the networks of interactions among different types of molecules. The structure of cellular networks, from the genome and the proteome to the metabolome strongly departs from a simple random graph SoleSatorras2002 . Instead, these nets display a highly heterogeneous architecture: most units (genes, proteins or metabolites) are linked to a few other units but invariably a few units exhibit a large number of links. Such heterogeneity has been also found in a wide spectrum of complex systems, from natural to artificial BornholdtBook . More importantly, the topological organization of complex nets might pervade their efficiency, their robustness and their fragility under perturbations Albert2000 .
The analysis of network structure and dynamics offers a new window to answer questions relating evolution of biocomplexity SoleCOMPLEXITYNETS . Networks are organized in highly non-random ways and the topological organization of their connectivity allow to quantitatively define some characteristic traits. Understanding the origins of such properties requires an understanding of the evolutionary mechanisms that generate these networks. Since properly defined quantitative traits can be measured, models are strongly constrained to reproduce a well-defined set of features.
From a statistical point of view, protein-protein or gene-gene interaction maps can be viewed as a random network BollobasBook ; BornholdtBook , in which the vertices represent the proteins (genes) and an edge between two vertices indicates the presence of an interaction between the respective proteins. In this paper we restrict our analysis to an undirected graph of protein-protein interactions, but some of our conclusions can be translated to regulatory networks.
Mathematically, the proteome graph is defined by a pair , where is the set of proteins and is the set of edges/connections between proteins. The adjacency matrix indicates that an interaction exists between proteins () or that the interaction is absent (). Two connected proteins are thus called adjacent and the degree of a given protein is the number of edges that connect it with other proteins.
The analysis of metabolic pathways, protein interaction maps, genetic regulatory networks and gene expression data reveals that cellular webs belong to a class of network topologies known as scale-free (SF) networks Jeong2000 ; Fell2000 . A SF net is characterized by a so-called degree distribution displaying power-law behavior. Here is the probability of finding a unit which is linked to other units and typically decays as with . Here links correspond, for protein maps, to protein-protein interactions. These networks are also small worlds: the average number of steps required in order to jump from one protein to another through the network is very small Fell2000 .
Scale-free graphs have been shown to emerge from different types of mechanisms Albert2001 ; DorogovtsevBook ; Newman2003 ; Caldarelli2003 . Most of them involve (explicitly or implicitly) a multiplicative process known as preferential attachment Barabasi1999 . In its standard form, it relies on a popularity principle (rich gets richer): as new node are added to the system, they tend to attach preferentially to nodes with higher degree, in the Barabasi-Albert (BA) model, this process leads to a SF distribution with Barabasi1999 .
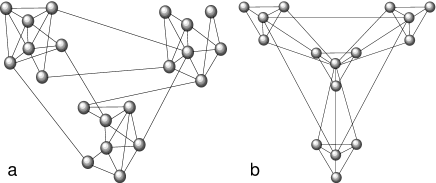
An additional feature is the presence of modular architecture with well-defined hierarchical properties Ravasz2002 . An example of modular network is shown in figure 1a. Here three sets of nodes appear more connected among them than with other nodes in the graph. Three modules are thus naturally defined (although only from a topological point of view). In this particular model (defined in Ravasz2002 ) nodes inside each module are randomly wired with some probability , as in so-called Erdös-Renyi (ER) graphs. They are also linked to nodes in other modules with a probability . Such networks exhibit a Poissonian degree distribution. Cellular networks, however, are not poissonian, but are certainly modular, exhibiting hierarchical organization Ravasz2002 .
In table I we summarize the differences between networks generated through random wiring (ER), preferential attachment (from the BA model) and the actual proteome map. It is interesting that none of the models gives modular architecture Ravasz2002 . Protein modules, for example, result from the binding of multiple protein molecules forming stable complexes. The presence of hierarchies has been shown to be measurable from the so called clustering coefficient which measures the fraction of neighbors of this node that are neighbours among them, i. e.
| (1) |
In this formula, is the number of links between neighbours of (with degree) , being thus the total number of possible links between neighbours of . The average of , that is, , describes in general the clustering coefficient of a network. This measure has been observed to be much higher in real networks than for random graphs in a variety of fields DorogovtsevBook , and in particular, it has also been shown to display a scale-free distribution Ravasz2002 .
It is generally acknowledged that modules define functional units and as such are the target of selection Hartwell1999 ; Sole2002_PHYSA . In this context, some authors suggested that general “design principles’ -profoundly shaped by the constraints of evolution-govern the structure and function of modules” Hartwell1999 (see also WagnerG1996b ; vonDassow1999 ).
Modules have been found in biological systems at multiple levels, from RNA structures Ancel2000 to the cerebral cortex (see SoleCOMPLEXITYNETS and references therein). This widespread character of modular organization pervades the functional association between compartmentalization and evolution. Modules have been variously defined as functionally buffered, robust, independently controlled, plastic in composition and interconnectivity and evolutionarily conserved. The evolutionary conservation of modules is clearly appreciated in gene networks involved in early development vonDassow2000 ; Munro; SoleTREE . The argument is that the special features of some of these modules are tightly linked to their robustness under different sources of noise.
The modular character of biological networks is assumed to be a consequence of both their robustness and evolvability WagnerG1996b . In this context, modularity would evolve through a decrease of pleiotropy WagnerAltenberg . Since they somewhat define separated compartments, they would act as buffers against lethal mutations perhaps facilitating variation Wolf2003 . In a different context, it has been suggested that modularity might arise from the intrinsic structure of the non-metric mapping between genotype and phenotype Stadler2001 . Although functionality must pervade the selection of some modular structures, here we show, by exploring available data and simple models of proteome evolution, that proto-modules might actually result from a duplication-divergence process without any predefined functional meaning. If correct, this observation would actually indicate that modular structures would be already in place as a byproduct of genome growth.
| Property | ER graph | BA model | proteome |
| independent | |||
| independent | |||
| Poissonian | |||
| Modules | no | no | yes |
II Results and Discussion
II.1 Phase transition in the proteome evolution model
Any model involving genome evolution must take into account the leading mechanism that appears to be responsible of its growth: gene duplication. Through gene duplication OhonoBook new elements are incorporated to the system, initially introducing an element of redundancy, since genes are duplicated and thus their connections with others too. Afterwards, divergence or loss of function occurs and either new functions/interactions are developed or pseudogenes (i. e. nonfunctional copies of duplicated genes) generated.
In trying to understand genome evolution under a network perspective, two possible approaches can be followed. First, the network architecture is given and the dynamics of gene regulation and its stability can be explored by changing well-defined network parameters, such as average connectivity Kauffman1993 ; Kauffman1969 ; Aldana2003 . A different approach would consider the process itself of network growth. A simple model of this process can be constructed by using a graph representation of the genome, where genes are the nodes and links are the edges. At each time step a duplication event takes place, and the number of genes in the system provides a natural time scale, although the rate of link rewiring i much faster than the rate of duplication (see below). Two independent studies, involving both analytic results and data analysis, presented simple models of proteome network evolution through gene duplication and diversification. These models were able to explain a large part of the observed complexity of protein network architecture, particularly the presence of small world patterns and the scale-free behavior. Their results were compared with some of the statistical pattern with those observed from proteome maps Sole2001SFI ; Sole2002_ACS ; Vazquez2001 ; Vazquez2003 ; SoleSatorras2002 . Two other studies presented closely related models using protein domains as the basic units Wuchty2001 ; Rzhetsky2001 again revealing that the complex patterns found in cellular interaction maps emerge from these microscopic laws of genome evolution. Further work has confirmed these results Bahn2002 ; Huynen2003 confirm the basic predictions presented in those original papers. Further work in this area involves the exploration of the origins of the protein universe structure, again under simple models of duplication and diversification Koonin2002 ; Shakhnovich2002 . Although previous papers have explored some average traits of these interaction maps (such as their scale-free structure and the presence of small-world architecture) here we analyse the patterns of correlations emerging from them and in particular the presence or absence of modular organization.
The time evolution can be described in terms of the number of links, i. e. we can write down a discrete equation for the link dynamics:
| (2) |
or, using the approximation , the continuous model:
| (3) |
Using the chain rule, we have
| (4) |
and the previous dynamical equation for links is transformed into a differential equation for the average degree:
| (5) |
Here the functional form of will depend on some given (perhaps time-dependent) parameters such as rate of removal or creation of links as well as of the internal state, as defined by the distribution of links at a given step, here indicated as (with ).
Different functional forms might be chosen, including rates of change that depend on the degree of the node, as suggested by some studies. Although duplication rate would be expected to depend on the number of links too, this seems controversial KooninBMC2003 ; FraserBMC2003 ; BloomBMC2003 .
The simplest situation would involve pure duplication with no link removal or rewiring. This situation corresponds to and thus we would have with a straightforward analytic solution:
| (6) |
where and are the initial number of links and average degree, respectively. As a consequence, an explosive increase in the connectivity will be obtained. Since cellular networks are sparse, we conclude that links have to be deleted at a fast pace in order to reach a low, finite number of links per unit.
The model analysed in Sole2002_ACS is defined by the following rules. We start form a set of connected nodes, and each time step we perform the following operations
-
(i)
One node of the graph is selected at random and duplicated
-
(ii)
The links emanating from the newly generated node are removed with probability .
-
(iii)
New links (not previously present after the duplication step) are created between the new node and all any other node with probability . Although available data indicate that new interactions are likely to be formed preferentially towards proteins with high degree here we do not consider this constraint.
Step (i) implements gene duplication, in which both the original and the replicated proteins retain the same structural properties and, consequently, the same set of interactions. The rewiring steps (ii) and (iii) implement the possible mutations of the replicated gene, which translate into the deletion and addition of interactions with different proteins, respectively. The process is repeated until proteins have been obtained.
The model described in Vazquez2003 is very similar, but introduces some relevant differences. Here duplication (i) is also followed by two probabilistic rules which operate independently. The first (ii) is node deletion. For each of the nodes linked to the two and its duplicate , we choose randomly one of the two links and remove it with probability . Additionally, a new interaction connecting the two proteins (the parent and the duplicated) is introduced with probability . The last rule will naturally increase the number of triangles in the system and thus provide a source of high clustering. The rewiring process seems to be more appropriately defined, since the removal of one of the alternative links allows to “conserve” the function that was somehow present before the duplication event. In Sole’s model, the whole set of links of the duplicated gene are preserved and loss of connections affects only the new copy. By using Vázquez’s approach, more flexibility is allowed and the interaction map is more likely to remain connected. As defined, it is important to note that duplicates will diverge only to some extent: if a duplicated gene with degree is duplicated, only will be removed on average. To reach higher levels of divergence (as suggested in the real proteome) we need to remove links from the rest of the map (and not just from the duplicate). Such a refinement is well based and has been also considered (see discussion) providing essentially the same results in relation with network architecture (Solé et al., in preparation).
The two models collapse into a single mean field description where the average connectivity follows the dynamics:
| (7) |
where in Solé’s model and in Vázquez’s model. Actually, in a previous paper Ric1; Ric2 we showed that in order to have convergence in the system towards a scale-free stationary distribution we need a very small rate of link addition (consistently with observations). If we assume that then a single link is added on average each step and thus the two models are identical in the low-addition limit: specifically, if the graph is sparse, we have . In this case we have a dynamical equation
| (8) |
which has an associated general solution:
| (9) |
where .
This gives:
| (10) |
if , the previous system converges to a graph with a finite average degree
| (11) |
Otherwise, the average connectivity will be . The critical removal rate thus defines a phase transition separating a phase with a highly-connected system () from a sparse phase () where a finite number of links will be observed. At this phase, the network becomes fragmented into many pieces. It is interesting to note that, under the present conditions, the long-term behavior of the average connectivity does not depend on the rate of link addition. What is really important is that the rate of link addition and link removal are similar, so that can reach a stationary value. Moreover, it can be shown that although no explicit preferential attachment is included here, the multiplicative nature of the process (in which proteins having more links are more likely to have them copied) actually leads to an effective preferential attachment VazquezPRE2003 .
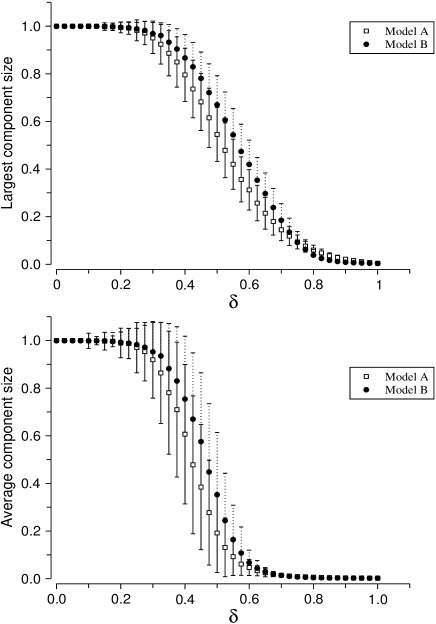
We can test this prediction by studying the behavior of the model under different rates of link deletion. In order to measure the impact of this rate on network’s architecture, we use two different, but closely related measures: (1) the normalized largest component size and (2) the average, normalized component size . If is the set of connected components (subgraphs) of the proteome map, so that
| (12) |
and indicates their size (so that ), we define:
| (13) |
| (14) |
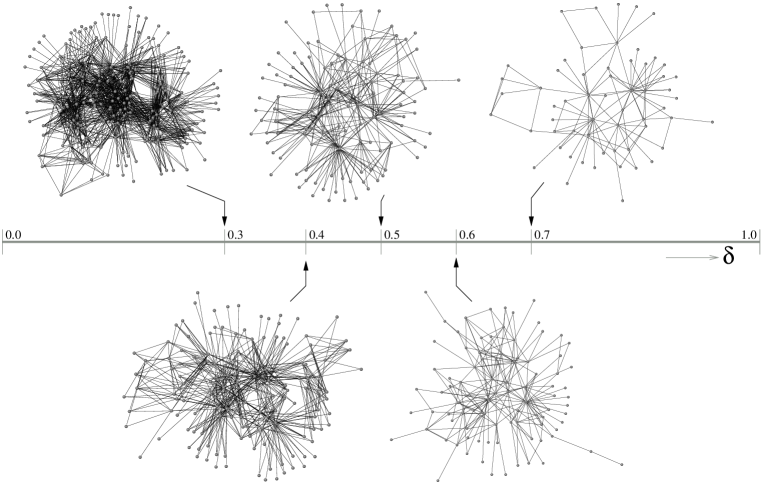
In figure 3(a-b) we display the two measures against for a protein network. Close to we can appreciate a clear change. The two phases are clearly identified, with the connected one showing and the fragmented phase showing . In 3(a) we can see that decreases slowly close to , where only about half of the nodes remain connected within the largest component. The sharpness of the transition becomes much more obvious in 3(b). Here we clearly appreciate the impact of rewiring on network’s structure, indicating that a large fraction of the overall network structure is formed by small, isolated components.In figure 4 we can see some examples of the graphs generated (largest components) obtained at different rates of deletion.
III Hierarchical organization, modularity and correlations
Previous papers on genome/proteome architecture have mainly described the heterogeneous character of the protein-protein map as well as a few large-scale features as the clustering coefficient or the network’s diameter. Beyond such measures, which only contain a limited part of network’s structure, correlations offer a much better view of their internal organization.
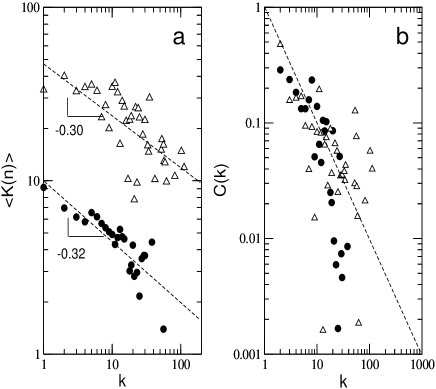
One measure of correlations can be easily obtained by looking at the set of conditional probabilities that a protein having links is connected to a protein with links MaslovSneppen . If no correlations exist (as it would occur in a purely random network) then we would have . We can analyse the average connectivity defined as:
| (15) |
(which is just in the absence of correlations). Data from PIN gives a scaling law with , as shown in figure 5(a) (open triangles). The result from Solé’s model close to the phase transition is also shown (black circles), with . This scaling law indicates that there is strong anticorrelation among nodes with low and high degree. Hubs tend to be unconnected among them, and instead they are connected with low-degree proteins. This type of network is also known as disassortative. The scaling appears to behave the same way in both data and model, but the higher average connectivity predicted by the model actually shifts the in silico law towards higher values. This difference is easily removed when the model is expanded allowing to remove links in a correlated way not restricted to the recently duplicated node.
Similarly, the presence of hierarchical organization can be highlighted by looking at the clustering-degree function . As discussed in the introduction, this function provides a statistical test for the presence of hierarchies in graph structure. As we can see in figure 5(b), both the proteome map and its in silico counterpart display a non-uniform behaviour of the clustering against degree. This gives further support to the presence of modular structure (see below).
A more detailed, complete view of the correlation structure of both model and real maps is given by correlation profiles (CP) as defined in MaslovSneppen . In order to compute it, we calculate the joint probability with , that two proteins are connected to each other. We also compute the probability obtained by randomizing the same network (i. e. a null model with no correlations). Significant correlations will be observed through systematic deviations of the ration
| (16) |
from the null model (i. e. deviations from ). In figure 6 the results from the CP are shown for both real yeast proteome (a) and different models (b-d).
Two prominent features are observed in 6(Y). The first, consistently with the previous analysis of , is the presence of anticorrelation between nodes of given degree. This is indicated by the red spots: nodes with high degree are not connected among them, but typically linked to proteins with low degree. A second feature is the presence of significant correlation among proteins with degrees close to . Actually, a wider domain close to the diagonal is implicated, indicating the presence of sets of proteins forming multiprotein complexes MaslovSneppen . Both DD models (figures 6(A,B), here (A) Solé’s model and (B) Vazquez’s model) naturally give the red spots at the correct locations in the CP. Additional correlations are shown near the zone. In (B) two spots are observed around this location, whereas in (C) the correlation is present close to the diagonal but although less pronounced. The first feature is a result of the intrinsic dynamics shown by the DD models, in which rapid divergence after duplication allows initially linked hubs to become disconnected. The second feature provides a good example of how truly functional constrains (those defined by protein complexes) shape real genome architecture. As discussed by Maslov and Sneppen, multiprotein complexes are largely responsible for this feature. The fact that the DD models do not display this structure is an indication that the lack of functionality is likely to explain the lack of the observed pattern.
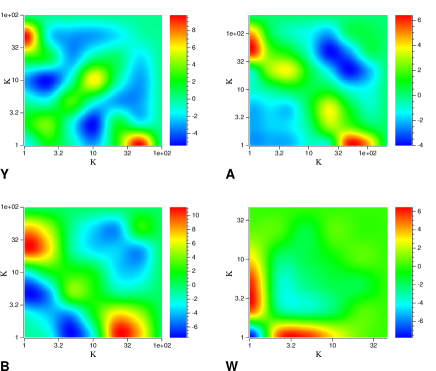
For comparison, we also display the correlation profile obtained from a different model of proteome evolution WagnerA2003 . This is actually a particular example of a model presented by Dorogovtsev and Mendes, DorogovtsevBook (DM) in which no change in the number of nodes is allowed, only rewiring. Here duplicated genes play no role and thus no correlations from duplication are preserved. Interactions are added and eliminated at given rates, being these rewiring rules applied using preferential attachment. Under a strict balance between addition and deletion (again, we have a phase transition between explosion and fragmentation) a power law in the degree distribution is obtained. But any correlation is lost under this type of approach (such as the lack of clustering or modularity). This is illustrated in figure 6(d) where the correlation profile obtained from the DM model parameters used in WagnerSFI2002 ; WagnerA2003 is shown. A visual inspection reveals a proteome map with little relation with the observed one. This results should prevent us of performing comparisons between model and real network data limited to a single topological property.
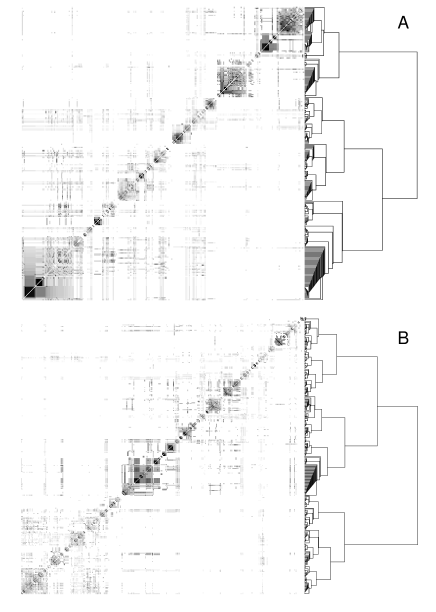
The previous correlations displayed by DD models and the evidence of a hierarchical organization strongly indicate that some type of modular architecture should be expected. In order to properly detect modules, we use the topological overlap method Ravasz2002 . An overlap matrix is defined as:
| (17) |
Here is the number of proteins to which both and are linked. The denominator gives the smallest degree of the pair . Since both terms are constrained to the interval , the overlap matrix is normalized, i. e. . This matrix can be then displayed as a two-dimensional plot with a color scale indicating the relative amount of overlap between two given nodes. The set of nodes is also arranged with an appropriate algorithm so that elements belonging to the same module appear close within the matrix. Two examples of these maps are shown in figure 7, for the two models explored here. We can clearly appreciate the presence of proto-modules, as shown by the clusters of closely connected elements. A hierarchy of such clusters, defining a set of nested modular structures, is observed.
IV Discussion
The emergence of modularity is one of the key problems of evolutionary biology. Modules are common to both natural and artificial systems Hartwell1999 and it is generally agreed that modularization allows a well-defined functional separation with enhanced robustness against component failure. One should expect to observe modules as slowly emerging from small subgraphs performing some functional role (such allowing bistability, or the creation of stripes in the early embryo) and adding more components able to tune their performance and increase their adaptability and robustness. In this way, compartments performing specialized functions should be expected to emerge. This might have been the case of the evolution of ontogeny in neural circuitry: a process of parcellation would have been shaping neural structures through a mechanism involving segregation and isolation. It is actually interesting to note that such a parcellation process deals with two essential components: the presence of some redundancy in cell-cell (neural) interactions followed by loss of one or more inputs to a cell. In other words, we need first to have several neighboring neurons, likely to have been obtained from cell duplication of a common parental strain. The initial set of neurons will be more densely connected and afterwards, specialization will occur by loosing some links. This process strongly reminds us the one taking place in the proteome map, although some fundamental differences are also present.
The proteome model provides a surprising counterexample of these intuition. Here local rules are able to shape some key features of global structure. Such as scenario seems to be rather general, and might have implications for the origins of metabolic paths too (Lehmann, Ravasz and Wuchty, submitted paper). Instead of slowly creating modules from significantly rewiring sub-parts of the graph, modules appear to be present as a consequence of the DD process. As illustrated by the previous figure, proto-modules spontaneously emerge and are thus a pre-pattern. Such a pre-defined structure could then be used in order to perform cellular functions. It is interesting to compare these structures with those present in technology graphs Ferrer2001a ; Valverde2002 .
What can be learn in general from this example? On the one hand, this study provides an example of modularity “for free”: there is no need of natural selection fine-tuning the system in order to obtain a large amount of correlations. Close to the narrow domain of high deletion rates scale-free architecture emerges in a natural way. Such a conjecture agrees with the view of evolution as constrained and to some extent shaped by emergent properties Kauffman1993 ; Signs . But several relevant questions emerge. One deals with the rates of link addition and removal. Why are we observing these high rates leading to a sparse graph? Two main possibilities emerge. One has to do with the requirement of a sparse graph in order to avoid dynamic instabilities. Specifically, if the activity of the network is taken into account, positive and negative links between different parts of a regulatory network can trigger the emergence of chaotic dynamics SoleSatorras2002 . Feedback loops in particular are known to destabilize complex networks and a sparse graph would easily avoid them to break system’s stability. By tuning the average degree, selection might have reached a stable, robust network with proto-modules embedded within its basic architecture. Another is that such proto-modules might have been the real target of selecting a sparse graph. Modules themselves isolate different parts of the system and thus a mechanism favoring their emergence (even as proto-structures) might have been successfully chosen. Further studies should consider these possibilities by exploring the internal organization of the protomodules, to be compared with the one observed in real maps.
Acknowledgements.
The authors would like to thank the members of the Complex Systems Lab for useful discussions. This work was supported by a grant BFM2001-2154 (RVS), the Generalitat de Catalunya (PFD, 2001FI/00732) and The Santa Fe Institute.References
- [1] R. Albert and A.-L. Barabási. Statistical mechanics of complex networks. Rev. Mod. Phys., 74(47–97), 2002.
- [2] R. Albert, H. Jeong, and A.-L. Barabási. Error and attack tolerance of complex networks. Nature, 406:378–382, 2000.
- [3] L. W. Ancel and W. Fontana. Plasticity, evolvability and modularity in rna. J. Exp. Zool., 288:242–283, 2000.
- [4] H. Bahn, D. J. Galas, and T. G. Dewey. A duplication growth model of gene expression networks. Bioinformatics, 18:1486–1493, 2002.
- [5] A.-L. Barabási and R. Albert. Emergence of Scaling in Random Networks. Science, 286:509–512, 1999.
- [6] J. D. Bloom and C. Adami. Apparent dependence of protein evolutionary rate on number of interactions is linked to biases in protein-protein interactions data sets. BMC Evol. Biol., 3(21), 2003.
- [7] B. Bollobás. Random Graphs. Cambridge University Press, 2001. 2nd Edition.
- [8] S. Bornholdt and H. G. Schuster, editors. Handbook of graphs and networks. John Wiley-VCH, 2002.
- [9] G. Caldarelli, A. Capocci, P. De Los Rios, and M. A. Muñoz. Scale-free networks from varying vertex intrinsic fitness. Phys. Rev. Lett., 89(258702), 2003.
- [10] N. V. Dokholyan, D. Shakhnovich, and E. I. Shakhnovich. Expanding protein universe and its origin from the biological big bang. 2002, 99:14132–14136, Proc. Natl. Acad. Sci. USA.
- [11] S. N. Dorogovtsev and J. F. F. Mendes. Evolution of networks. From biological nets to Internet and WWW. Oxford University Press, Oxford, 2003.
- [12] D. Fell and D. Wagner. The small world of metabolism. Nat. Biotech., 18:1121–1122, 2000.
- [13] R. Ferrer i Cancho, C. Janssen, and R. V. Solé. The topology of technology graphs: small world pattern in electronic circuits. Phys. Rev. E, 64:046119, 2001.
- [14] H. B. Fraser, D. P. Wall, and A. E. Hirsh. A simple dependence between protein evolution rate and the number of protein-protein interactions. BMC Evol. Biol., 3(11), 2003.
- [15] L.H. Hartwell, J.J. Hopfield, S. Leibler, and A.W. Murray. From molecular to modular cell biology. Nature, 402:C47–C52, 1999.
- [16] H. Jeong, B. Tombor, R. Albert, Z. N. Oltvai, and A.-L. Barabási. The large-scale organization of metabolic networks. Nature, 407:651–654, 2000.
- [17] K. Jordan, I, Y. I. Wolf, and E. V. Koonin. No simple dependence between protein evolution rate and the number of protein-protein interactions: only the most prolific interactors tend to evolve slowly. BMC Evol. Biol., 3(1), 2003.
- [18] S. A. Kauffman. The origins of order. Oxford U. Press, New York, 1993.
- [19] S.A. Kauffman. Metabolic stability and epigenesis in randomly constructed genetic nets. J.Theor.Biol., 22:437–467, 1969.
- [20] Aldana M. and P. Cluzel. A natural class of robust networks. Proc. Natl. Acad. Sci. USA, 100:8710–8714, 2003.
- [21] S. Maslov and K. Sneppen. Specificity and stability in topology of protein networks. Science, 296:910–913, 2002.
- [22] M. Newman. Handbook of Graphs and Networks, chapter Random graphs as models of networks, pages 147–169. John Wiley-VCH, 2002.
- [23] S. Ohono. Evolution by gene duplication. Springer, Berlin, 1970.
- [24] E. Ravasz, A. L. Somera, D. A. Mongru, Z. N. Oltvai, and A.-L. Barabási. Hierarchical organization of modularity in metabolic networks. Science, 297:1551–1555, 2002.
- [25] A. Rzhetsky and S. M. Gomez. Birth of scale-free molecular networks and the number of distinct dna and protein domains per genome. Bioinformatics, 17:998–996, 2001.
- [26] R. V. Solé, R. Ferrer, J. M. Montoya, and S. Valverde. Selection, tinkering, and emergence in complex networks. Complexity, 8(1):20–33, 2002.
- [27] R. V. Solé, R. Pastor-Satorras, E. Smith, and T. Kepler. A model of large-scale proteome evolution. Santa Fe Institute Working Paper 01-08-041, 2001.
- [28] R. V. Solé, R. Pastor-Satorras, E. Smith, and T. Kepler. A model of large-scale proteome evolution. Adv. Complex Systems, 5:43–54, 2002.
- [29] R. V. Solé, I. Salazar-Ciudad, and S.A. Newman. Gene network dynamics and the evolution of development. Trends Ecol. Evol., 15:479–480, 2000.
- [30] R.V. Solé and R. Pastor-Satorras. Handbook of Graphs and Networks, chapter Complex networks in genomics and proteomics, pages 147–169. John Wiley-VCH, 2002.
- [31] R. V. Solé and B. C. Goodwin. Signs of Life: how complexity pervades biology. Basic Books, 2001.
- [32] R. V. Solé, I. Salazar, and J. Garcia-Fernández. Common pattern formation, modularity and phase transitions in a gene network model of morphogenesis. Physica A, 305:640–647, 2002.
- [33] N. M. Stadler, P. F. Stadler, G. P. Wagner, and W. Fontana. The topology of the possible: formal spaces underlying patterns of evolutionary change. J. Theor. Biol., 213:241–274, 2001.
- [34] Koonin E. V., Wolf Y. I., and Karev G. P. The structure of the protein universe and genome evolution. Nature, 420:218–223, 2002.
- [35] S. Valverde, R. Ferrer i Cancho, and R. V. Solé. Scale free networks from optimal design. Europh. Lett., 60:512–517, 2002.
- [36] V. van Noort, B. Snel, and M. Huynen. The yeast co-expression network has a small-world, scale-free architecture and can be explained by a simple model. J. Mol. Biol., 2003.
- [37] G. von Dassow, E. Meir, E. Munro, and G. M. Odell. The segment polarity network is a robust developmental module. Nature, 406:188–192, 2000.
- [38] G. von Dassow and E. Munro. Modularity in animal development and evolution: elements of a conceptual framework for evodevo. J. Exp. Zool., 406(6792):188–192, 1999.
- [39] A. Vázquez. Growing network with local rules: Preferential attachment, clustering hierarchy, and degree correlations. Phys. Rev. E., 67(056104), 2003.
- [40] A. Vázquez, A. Flammini, A. Maritan, and A. Vespigniani. Modeling of protein interaction networks. Cond-mat/0108043, 2001.
- [41] A. Vázquez, A. Flammini, A. Maritan, and A. Vespigniani. Modeling of protein interaction networks. ComPlexUs, 1:38–44, 2003.
- [42] A. Wagner. How the global structure of the protein interaction networks evolves. Santa Fe Institute Working Paper 02-08-041, 2002.
- [43] A. Wagner. How the global structure of the protein interaction networks evolves. Proc. Royal Soc. London B, 270:457–466, 2003.
- [44] G. P. Wagner. Homologues, natural kinds, and the evolution of modularity. Am. Zool., 36:36–43, 1996.
- [45] G. P. Wagner and L. Altenberg. Complex adaptations and the evolution of evolvability. Evolution, 50:967–976, 1996.
- [46] S. Wuchty. Scale-free behavior in protein domain networks. volume 18, pages 1694–1702. 2001.
- [47] A. Wuensche. Motifs, modules and games in bacteria. volume 6, pages 125–134. 2003.