chernovamaths.ox.ac.uk (Anna Chernova)
Response kinetics of tethered bacteria to stepwise changes in nutrient concentration
Abstract
We examined the changes in swimming behaviour of the bacterium Rhodobacter sphaeroides in response to stepwise changes in a nutrient (propionate), following the prestimulus motion, the initial response and the adaptation to the sustained concentration of the chemical. This was carried out by tethering motile cells by their flagella to glass slides and following the rotational behaviour of their cell bodies in response to the nutrient change. Computerised motion analysis was used to analyse the behaviour. Distributions of run and stop times were obtained from rotation data for tethered cells. Exponential and Weibull fits for these distributions, and variability in individual responses are discussed.
In terms of parameters derived from the run and stop time distributions, we compare the responses to stepwise changes in the nutrient concentration and the long-term behaviour of 84 cells under twelve propionate concentration levels from 1 to 25 .
We discuss traditional assumptions for the random walk approximation to bacterial swimming and compare them with the observed R. sphaeroides motile behaviour.
Keywords:
bacterial chemotaxis, Rhodobacter sphaeroides, flagellar motor, Poisson process.
Introduction
Bacteria populations exhibit intricate spatio-temporal patterns as a result of reacting actively to environmental cues, such as nutrient concentration, light levels, oxygen concentration, osmolarity, pH, presence of toxins or metabolites, electrochemical stimuli, etc. Individual cells integrate these signals to produce a balanced response, resulting in active locomotion.
Bacterial locomotion in general can be achieved by different means, but most species swim using flagellum-driven motility. Rhodobacter sphaeroides is a purple non-sulphur photosynthetic bacterium. It has a single subpolar flagellum, which propels the cell forward, rotating only clockwise. When the flagellar motor stops, the functional helix relaxes to a short wavelength, large amplitude structure and Brownian motion appears to cause reorientation of the cell body as described in [1]. When the motor starts to rotate again, a functional helix reforms and the cell swims in a new direction. Bacterial motion usually can be described as a random walk with a good approximation. From the mathematical point of view it is often assumed that times of runs and stops are distributed exponentially.
A wide range of phenomena occur when a signalling cue is non-uniformly distributed in space and/or time. Such stimuli can lead to directed or biased motion of cells, i.e. can cause a tactic response [9]. This study is a step towards understanding the physical nature of taxis in bacteria subjected to changes in chemoattractant concentration. We start with a description of the experiment and analysis of data and then present results of fitting times of runs and stops with a generalisation of the exponential distribution.
Description of the experimental setup
We are exploiting data for temporal sensing in R. sphaeroides, which has been investigated using tethered cells and stepwise changes in the concentration of proprionate. The data were collected by H. Packer (Microbiology Unit, Department of Biochemistry, Oxford University).
Growth conditions. Rhodobacter sphaeroides WS8N (a wild type nalidixic acid resistant strain) was grown at aerobically in the dark as described in IngArm [4].
Tethering. In order to analyse the behaviour of individual bacterial flagellar motors, cells were tethered by their flagella using antiflagellar antibody in a flow chamber and the behaviour of individual motors was analysed using motion analysis. Cells were harvested by gentle centrifugation, washed and resuspended in nitrogen 10 mM Na HEPES buffer (pH 7.2) containing 50 g/ml of chloramphenicol, aerated by shaking at . The cells were starved for 45 mins and tethered in the flow chamber as described in [6, 3].
Motion analysis. The tethered cells were viewed via a phase-contrast microscope with an attached video camera. Measurement of cell rotation was made using the AROT7 software on a Bactracker. The software can analyse up to 10 cells per field. Cells that were rotating without touching others were measured. Data points were taken at the video frame rate (50 Hz for interlaced images) and the raw data were downloaded as ASCII files for analysis.
Tethered cells were subject to stepwise addition of propionate at the twelve levels with concentrations from 1 to 25 (i.e. from sub-saturating to saturating concentrations) over 3-5 minutes time interval.
Data analysis
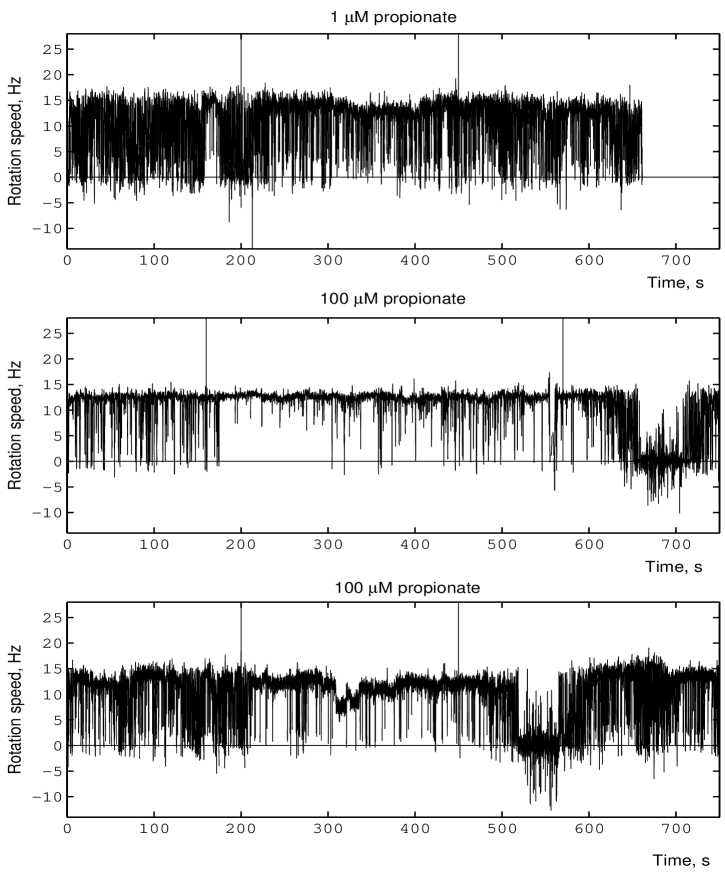
During the experiment rotation speed of a single tethered cell was recorded every 0.02 . Typical time series of responses are shown in Figure 1.
The raw ASCII data files were processed to eliminate system noise, each point in the curve was replaced by the weighted average of its nearest nine neighbours by the method of Savitzky-Golay described in [8]. An advantage of this filter is its sensitivity, so that subtle changes in bacterial motor dynamics are preserved in the data. The noise arising due to vibrational forces acting on a stopped cell must be treated separately.
A typical distribution of rotation speed data (pre-stimulus period) is shown in Figure 2. The distribution is bimodal. The first peak around zero corresponds to stops of the motor; the negative values of the rotation speed appear when the cell, subject to vibrational forces, turns in the opposite direction. Vibrational forces contribute in a different manner to the distribution of speeds around the second maximum. A physical reason for this is the small value of the Reynold’s number for a bacterium in liquid medium, which means that a moving cell is surrounded by a relatively more stable environment than a stopped one.
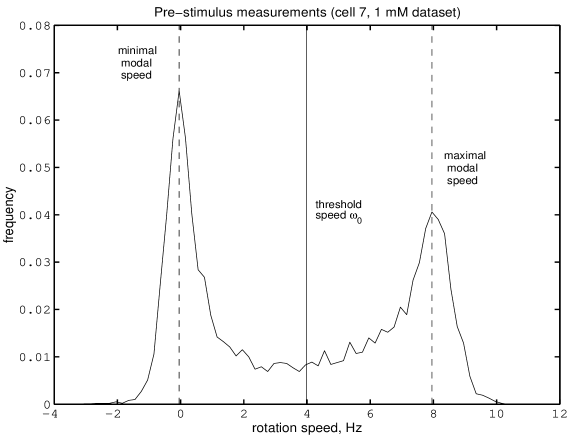
The complexity of the frequency distribution of the rotation speed of a moving R. sphaeroides cell reflects the intricate behaviour of the bacterial motor. In comparison with the virtually constant-speed motor of Escherichia coli, in R. sphaeroides, the motor is known to be a variable-speed motor and the speed variation can be seen both in individual motors and between cells under the same external conditions. More detail on the stopstart mechanism of the motor in R. sphaeroides is given in [7].
For each cell the pre-stimulus records were used to define a threshold value of rotation speed. From the distributions of the rotation speed data we determined the two most frequent values (modes); the threshold was chosen to be half of the maximal modal speed (Figure 2). The cell was considered as stopped at time if the detected rotation speed was less than , otherwise the cell was assumed to be rotating (running).
Distributions of run and stop times
Implementing the threshold criteria for the rotation speed data, we obtain sequences of run and stop times for each cell. We computed mean values and standard deviations of run and stop times averaged over all the cells in one experiment (i.e. subjected to the same level of propionate) vs. the concentration of propionate. Relative mean durations of runs and stops, defined as differences between mean duration of runs (stops) in the presence of the nutrient and mean duration of runs (stops) over pre-stimulus period, are shown in Figure 3.
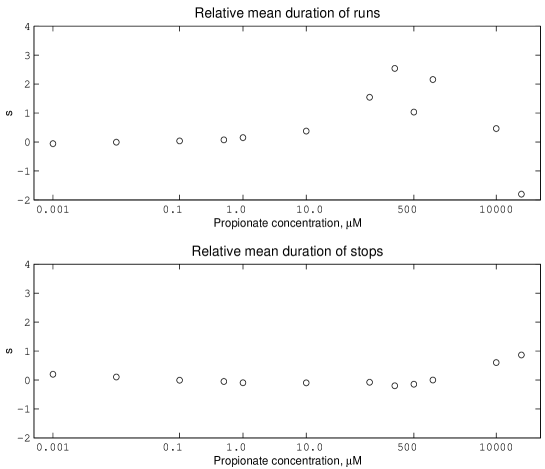
It was found that on the average the mean duration of runs remains approximately constant for cells which are subject to stepwise changes in propionate concentration from zero level to some , . The stepwise changes from 0 to some value , 1 , cause an increase in the mean time of runs, while as a result of the stepwise changes from 0 to , , the mean duration of runs decreases.
The mean duration of stops was not observed to change significantly in response to stepwise addition of propionate at the concentrations from 1 to 500 . When the change was from 0 to some concentration , , the average duration of stops increased, but the increase was not larger than 1 .
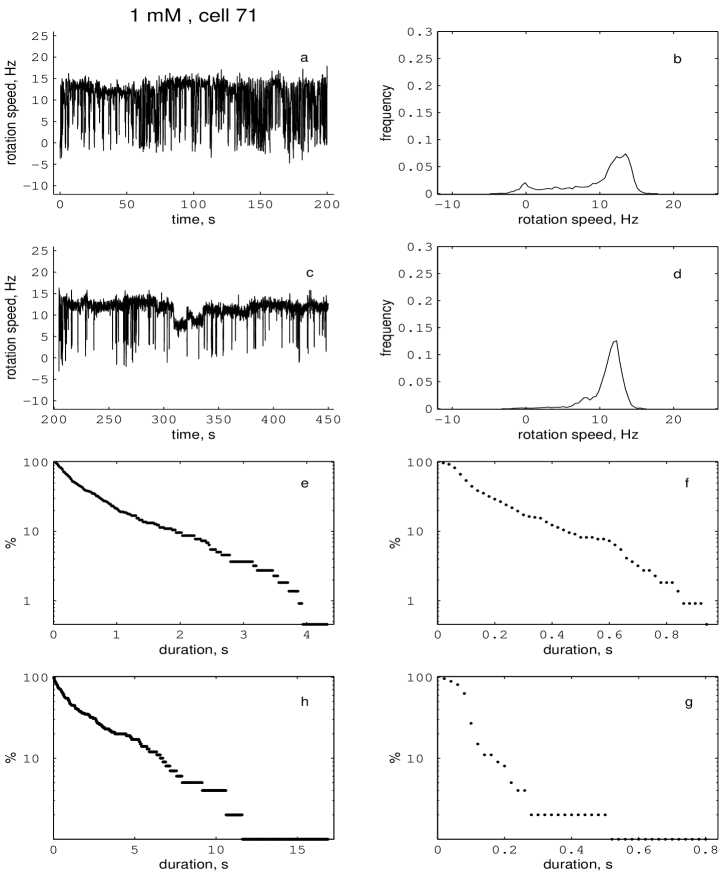
Figure 4 illustrates how a single cell responds to stepwise addition and the following new constant level of the nutrient (here from zero (background) concentration to 1 ): the cell tends to stop less frequently (the first mode disappears from the distribution of rotation speeds); duration of runs increases (up to 4 times in this instance); there are less long stops than at the background level.
Fitting with the Weibull distribution function
In traditional modelling of bacterial motion it is often assumed that the temporal part of the random walk can be described by a Poisson process, or, more generally, alternating renewal process with exponential holding times, i.e. waiting times between runs are distributed exponentially (see, for example, [2, 5]). Here we attempt to justify this assumption by analysing distributions of both run and stop times obtained from the data.
Distributions of run and stop times derived from the data were fitted with a Weibull distribution function, given by
| (1) |
with probability density function
| (2) |
The Weibull distribution is a generalisation of the exponential distribution, in the sense that if then the former reverts to the latter with parameter
| (3) |
A linear equation equivalent to (1) is
| (4) |
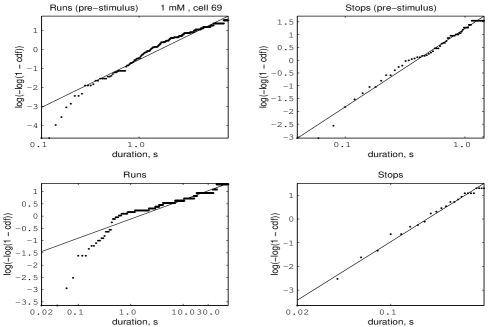
with , and . An example of fitting data for a single cell is presented in Figure 5. The cumulative distribution function (cdf) calculated from data was converted into a form suitable for linear fitting with (4).
Results
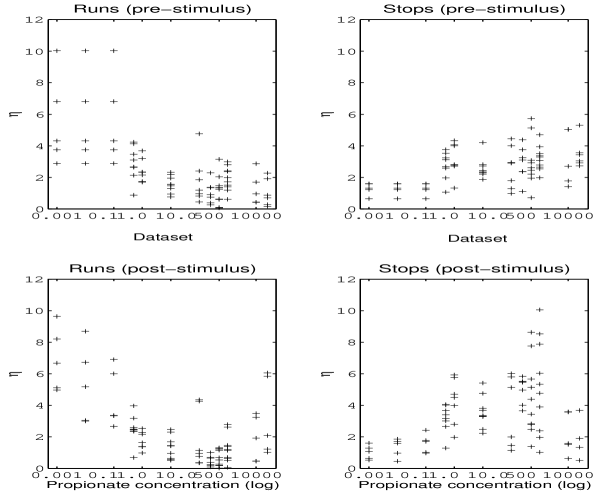
As can be seen from the Weibull parameter estimation, there is a significant variability in the cell behaviour. 97.7 percent of all values lie within the range from 0 to 12, and two values were found to be 65.04 (for run times, 25 propionate) and 223.20 (stop times, 25 propionate, different cell).
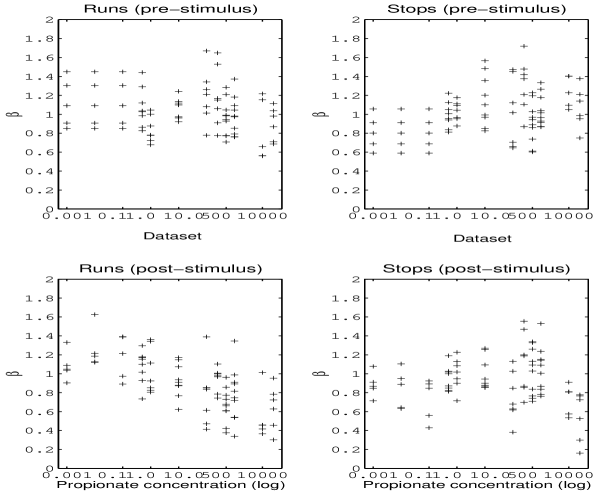
The second parameter, , significantly deviates from unity for both run and stop times before and after addition of nutrient.
One of the possible conclusions from analysis of norm of residuals of the fits is that the Weibull distribution is a better description for stop times (both in the pre-stimulus period and after change in the chemical concentration) than for run times.
The results of the analysis of run and stop times do not allow us to draw a single conclusion from the data, mainly due to a great diversity in individual cells’ behaviour. Cases of successful fitting of a runstop distribution with Weibull functions are found as often as cases with poor results of such fitting. In some instances, like for the distribution of run times for a cell subjected to 1 propionate (Figure 5), a linear combination of Weibull functions could be chosen for fitting.
Preliminary analysis of independence of successive time intervals also show a high variability among individual cells, and does not allow us to talk about a “typical behaviour”. On the average, however, the autocorrelation function calculated for the sequences of run and stop times does not differ significantly from the autocorrelation function of a Poisson process.
These complexities discovered in the data suggest that a detailed investigation into the run and stop times distributions can produce some interesting results. We have chosen the Weibull distribution function as a simplest generalisation of the exponential distribution. Such generalisation leads, in fact, to re-consideration of several modelling hypotheses for chemotaxis in bacteria. Experimental motivation of the generalisation and modification of the temporal and spatio-temporal models is a subject of our current research.
Acknowledgements
The authors thank Dr T. Alarcón, Dr R. Satnoianu and Dr D. Sumpter for helpful and stimulating discussions.
AAC gratefully acknowledges scholarships from ORS Award Scheme and Oxford University Bursary. This worked arose as a part of the project supported by the joint BBSRC/EPSRC Initiative in “Mathematical Modelling, Simulation and Prediction of Biological Systems”, grant 43-MMI 09782 awarded to J.P. Armitage and P.K.Maini. HLP thanks the NERC for their support.
References
- [1] Armitage, J.P., Macnab, R.M., 1987. Undirectional intermittent rotation of the flagellum of Rhodobacter sphaeroides. J. Bacteriol. 169, 514-518.
- [2] Berg, H.C., 2000. Motile behaviour of bacteria. Physics Today 93, 14225-14228.
- [3] Berg, H.C., Block, S.M., 1984. A miniature flow cell designed for rapid exchange of media under high-power microscope objectives. J. Gen. Microbiol. 130, 2915-2920.
- [4] Ingham, C.J., Armitage, J.P., 1987. Involvement of transport in R. sphaeroides chemotaxis. J. Bacteriol. 169, 5801-5807.
- [5] Othmer, H.G., Hillen, T., 2002. The diffusion limit of transport equations II: chemotaxis equation. SIAM J. Appl. Math. 62, 1222-1250.
- [6] Packer, H.L., Gauden, D.E., Armitage J.P., 1996. The behavioural response of Rhodobacter sphaeroides to temporal stimuli. Microbiology 142, 593-599.
- [7] Packer, H.L., Lawther, H., Armitage J.P., 1997. The Rhodobacter sphaeroides flagellar motor is a variable-speed rotor. FEBS Letters 409, 37-40.
- [8] A. Savitzky, A., Golay, M., 1964. Smoothing and differentiation of data by simplified least squares procedures. Anal. Chem. 36, 1627-1639.
- [9] Schnitzer, M.J., Block, S.M., Berg, H.C., Purcell, E.M., 1991. Strategies for chemotaxis. In: Armitage, J.P., Lackie, J.M. (Eds.), Biology of the chemotactic response, Society for General Microbiology Symposium. Cambridge University Press, Cambridge, UK, pp. 15-34.