Solidification pipes: from solder pots to igneous rocks
Abstract
When a substance that shrinks in volume as it solidifies (for example, lead) is melted in a container and then cooled, a deep hole is often found in the center after resolidification. We use a simple model to describe the shape of the pipe and compare it with experimental results.
pacs:
PACS. 81.30.FbIn an experiment that involves atomic beams of thallium [2], it was noticed that a deep narrow hole was formed in the thallium that melted and resolidified. The hole that formed was at the center of the container and extended from the surface to nearly the bottom. It was surmised that the phenomenon was due to the change in volume of thallium during solidification. Such formation is sometimes known as “pipe” in metallurgy [3]. In this note, we discuss a simple model of pipe formation and compare it with straightforward experiments that can be carried out in classrooms.
Suppose a molten substance is cooling in a circular cylinder. Assuming that solidification occurs from the side walls of the container inwards in the radial direction and neglecting the surface tension effects, we should expect the liquid level to drop as a layer of solid is formed because of the higher density of the solid. Consider a newly solidified layer of thickness . Let and be the solid and liquid densities respectively, and let be the height of solid as a function of radius . Equating the mass before and after solidification, one obtains a differential equation:
| (1) |
Keeping only first order differentials, we get:
| (2) |
With the boundary condition of , where and are the radius of the container and the initial liquid level respectively, the solution is:
| (3) |
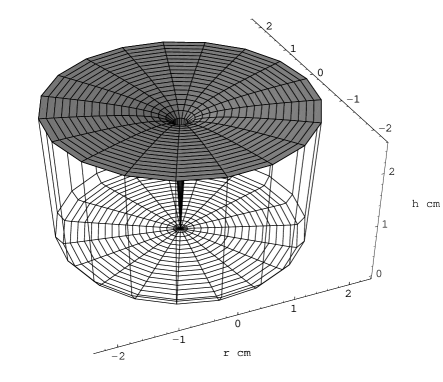
This solution (plotted in Fig. 1 for the parameters of an experiment described below) gives a sharp hole in the center, the shape of which, for a given container and liquid volume, is determined by , the fractional density change.
With this simple model in mind, we have performed solidification experiments with various substances (this time omitting the highly toxic thallium). The changes in densities upon solidification for these materials and for thallium are listed in Table I [3, 4, 5]. As expected, pipes are observed in all materials tested except Wood’s metal (an alloy of 50% Bi, 25% Pb, 12.5% Cd and 12.5% Sn). Indeed, Wood’s metal has the property that the volume changes little during solidification. Note that for substances that expand upon solidification (water, bismuth, antimony and gallium), no ”anti-pipe” is formed because the liquid is pushed out by the expanded solidified material and assumes a horizontal level.
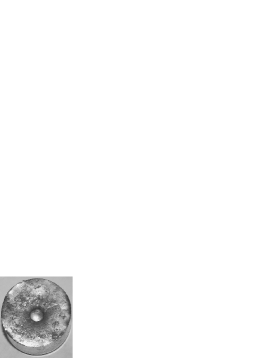
Photographs of several experimental samples are shown in Figures 2-5. Figure 2 shows a sample of conventional solder alloy (60% lead, 40% tin) that was melted and poured into a glass beaker where it cooled and solidified. The sample was then cut through the center of the pipe, the resulting cross-section is shown in Figure 3.
Comparing the shape of the pipe predicted by our simple model (Fig. 1) to the one observed experimentally (Figs. 2 and 3), one finds that, while the shape is reproduced qualitatively, there are also significant discrepancies. First, the pipe does not actually go to the bottom of the container as the model predicts. Second, the pipe in the experiment turns out to be much wider. Presumably this is because we have assumed that solidification occurs only from the sides (see below).
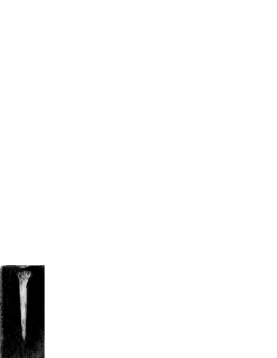
In fact, when cooling from the surface and the bottom becomes significant, other scenarios in addition to pipe formation are possible. Fig. 4 shows a solidified lead sample, in which a layer of solid on the surface covers the pipe, turning it into a cavity. We can see that the cavity width is greater than the pipe width predicted from Equation 3. Qualitatively this can be understood from the requirement of mass conservation: the material solidified on the top does not have a chance to fill the pipe.
To reduce the relative solidification rate from the surface, we attempted accelerated cooling from the sides by putting a beaker with molten solder into a water bath. This time, instead of a deep pipe, a surface recession shown in Fig. 5 was observed. To explain this observation, we modified the model by adding a term to account for solidification from the bottom.
Let be the ratio of the solidification rate of the bottom to that of the sides. In order to keep the model as simple as possible, we assume . (Note that this would not be a valid approximation for large . If the solidification from the bottom is sufficiently rapid, the entire substance solidifies before solidification from the sides reaches . In the cases discussed here, however, the liquid level is high and the cooling rate from the bottom is about the same as that from the sides, so the assumption can be safely granted.) The differential equation analogous to Equation 1, with the shorthand , is then:
| (5) | |||||
Simplifying, we get
| (6) |
The solution is a long algebraic expression, which we omit here, but the solution plot (for ) is given in Fig. 6. Comparing it to the picture of the sample (Fig. 5), one can find close resemblance between the two.
So far we have neglected the effect of surface tension (a simple discussion of surface tension is given in [7], for example). If wetting occurs at the solid-liquid interface of the solidifying substance, the surface of the liquid will not be flat, and the curvature of the surface will affect the final shape of the solid. However, it is reasonable to assume that this effect only becomes significant when the dimension of the contained liquid is ”capillary” — i.e., the radius of curvature of the surface near the wall, , becomes comparable to the radius of the liquid surface, . From dimensional analysis, we expect . Plugging in realistic parameters, for example, (for metal), , we obtain . This means that surface tension only becomes important near the center of the container. The effect should be observable at the bottom of the pipe. Qualitatively, we would expect the bottom to be more concave than predicted by our model due to the curved liquid surface, and this is indeed the case (see Fig. 3).
In conclusion, we have discussed the mechanism of formation of surface pipes upon resolidification of materials with . These prominent formations can often be observed in solder pots, candle containers, etc. They are important in metallurgy [3] where they have to be taken into account in casting processes. Similar formations also occur in igneous rocks due to density changes of magma on solidification [6]. However, it is often difficult to separate this effect from a large number of other factors that determine the structure and texture of igneous rocks.
The authors are grateful to D. E. Brown, D. DeMille, J. Demouthe, D. F. Kimball, S. M. Rochester, V. V. Yashchuk for useful discussions. This work was supported by National Science Foundation under CAREER Grant No. PHY-9733479.


REFERENCES
- [1] e-mail: budker@socrates.Berkeley.edu
- [2] D. DeMille, D. Budker, and E. D. Commins, Measurement of the Stark-induced amplitudes of the to transition in atomic thallium, Phys. Rev. A 50(6), 4657 (1994); Photoionization and photodissociation properties of observed in a hypersonic beam, Chem. Phys. Lett., 229(1-2), 35 (1994).
- [3] B. Chalmers, Principles of Solification (John Wiley & Sons, N.Y., 1964), pp. 285-287.
- [4] Metal Handbook 2, 9th ed., Amer. Soc. for Metals, Ohio (1979).
- [5] The Merck Index, 8th ed., Merck & Co., N.J. (1968).
- [6] F. Grout, Petrography and Petrology (McGraw-Hill, N.Y. 1932), p.36.
- [7] A. Kikoin and I. Kikion, Molecular Physics (Mir Publishers, 1978), pp. 320ff.