Effect of Optical Coating and Surface Treatments on Mechanical Loss in Fused Silica
Abstract
We report on the mechanical loss in fused silica samples with various surface treatments and compare them with samples having an optical coating. Mild surface treatments such as washing in detergent or acetone were not found to affect the mechanical loss of flame-drawn fused silica fibers stored in air. However, mechanical contact (with steel calipers) significantly increased the loss. The application of a high-reflective optical coating of the type used for the LIGO test masses was found to greatly increase the mechanical loss of commercially polished fused silica microscope slides. We discuss the implications for the noise budget of interferometers.
I Introduction
In samples made of high materials, such as fused silica or sapphire, a damaged or optically coated surface can be the dominant source of mechanical loss and could limit our ability to reduce thermal noise in interferometers. We apply a general method for quantifying surface loss to measurements of samples with optical coatings and differing surface treatments. This enables us to estimate the effect of coatings on the internal mode thermal noise of interferometer test masses as well as the effect of suspension filament surface damage on the pendulum mode thermal noise.
II Quantifying Surface Loss
Surface loss may be quantified by the dissipation depth , defined byAndri
| (1) |
where is the measured loss angle of the sample when all sources of extrinsic loss (such as recoil damping or clamping friction) have been eliminated, is the loss angle of the bulk material, is the volume of the sample, and is the surface area. The unitless is a geometrical factor that takes into account the relative amount of elastic deformation occurring at the surface and hence the emphasis placed on the condition of the surface due to the sample geometry and mode of oscillation. The geometrical factor is of order unity for simple geometries so that, as a rule of thumb, surface loss tends to dominate when is greater than the volume to surface area ratio. For fibers in transverse oscillation , while for ribbon or microscope slide geometries in transverse oscillation . Although and may in general be functions of frequency, no frequency dependence was seen in our measurements. In this paper we will use the constant value for the loss angle of bulk fused silica.
III Surface Treatment of Uncoated Samples
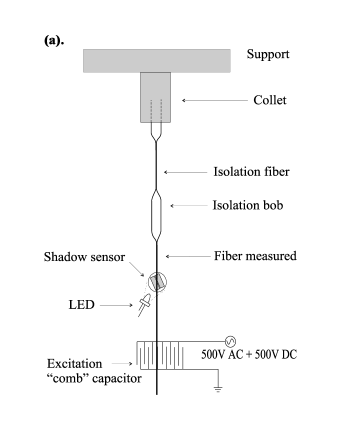
For uncoated samples the dissipation depth provides a quantitative measure of the physical condition of the surface. By measuring the quality factor of samples before and after different types of surface treatment, we calculated the dissipation depth associated with each treatment. We measured the quality factors of untreated and treated fused silica (Suprasil 2) fibers drawn in a natural gas and oxygen flame. We also measured the quality factor of a fused silica (Suprasil 2) microscope slide, both as supplied (mechanically polished) and as subsequently etched. Using an apparatus specifically designed for the purpose of reducing extrinsic sources of loss (Fig. 1a) we were generally able to reduce extrinsic losses sufficiently so that the dominant sources of loss remaining were thermoelastic loss, bulk loss, and surface loss.Andri In each case we measured the quality factors at frequencies where thermoelastic loss was negligible. In this regime the quality factors were frequency independent, although in a minority of cases random mode-to-mode differences in were apparent. This was most likely due to residual sources of excess loss. To reduce the systematic error due to such residual sources of excess loss we took the highest mode to be indicative of the quality factor resulting from bulk loss and surface loss alone.
To investigate the effects of washing surfaces in solvents we wiped a fiber with paper wipes (KimwipesTm) saturated with acetone. We also agitated a fiber in an ultrasonic bath of detergent and warm tap-water for a half hour, followed by a half hour ultrasonic bath of warm tap-water, followed by a second rinse with a stream of distilled water. After measuring the Q we then waited 14 days with the fiber under vacuum ( Torr) and re-measured the Q. In an attempt to simulate the effects of hydroxy-catalysis bondingGuo (silicate bonding) of fused silica surfaces we washed a fiber with ethyl alcohol and then submerged it in a 0.5 Molar solution of KOH and distilled water for 24.6 hrs, then rinsed in distilled water. Also, to investigate the effect of mechanical damage we lightly pinched two fibers at 1 cm intervals with stainless steel measurement calipers.
To remove the outer surface entirely (and with it any mechanical surface damage) we etched three fused silica fibers in solutions of hydrofluoric acid (HF) and distilled water. After etching, the fibers were rinsed with distilled water. The first etch was performed on a fiber of diameter and the etch removed from the surface. The second etch was performed on one of the fibers previously pinched with calipers. It had a pre-etch diameter of and the etch depth was . The third etch was performed on a fiber of pre-etch diameter . The etch depth was . Finally, we etched the microscope slide. As supplied, the microscope slide surface had received a commercial 80-50 (scratch-dig) polish. The etch removed from this surface.
Table 1 summarizes our results.
| sample | treatment | [m] | [m] 111 Change in from the as drawn or as supplied state. The uncertainty in is not the root of the quadratic sum of uncertainties in since not all the variables involved in calculating are independent between treatments. |
| Fiber B | as drawn | ||
| Fiber B | acetone | ||
| Fiber C | as drawn | ||
| Fiber C | calipers | ||
| Fiber F | as drawn | ||
| Fiber F | detergent solution, rinse | ||
| Fiber F | after 14 days in vacuum | ||
| Fiber F | 1.5 m HF etch | ||
| Fiber I | as drawn | ||
| Fiber I | calipers | ||
| Fiber I | 45m HF etch | ||
| Fiber L | as drawn | ||
| Fiber L | KOH, 0.5 M solution, rinse | ||
| Fiber M | as drawn | ||
| Fiber M | 90 m HF etch | ||
| Slide C | as supplied (polished) | ||
| Slice C | 100 m HF etch |
For three of the fibers, with surfaces as drawn, the dissipation depth is around . Fiber I has a surface that is initially worse (higher ) while Fiber M has a surface that is initially better. Although an effort was made not to touch the surfaces of the fibers with fingers or other objects during handling, conditions were not stringently uniform. The fibers were also stored for varying durations in clean glass tubes and could come into light contact with the inner surface of the tubes. Depending on the storage time or amount of contact, some deviation in can be expected.
Figure 2 shows how strongly different treatments affected the surface of fibers.
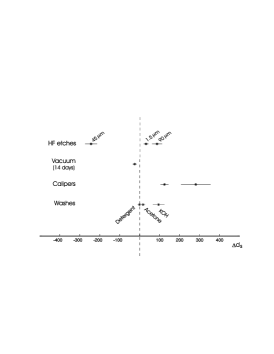
Most of the treatments either produced no change in the condition of the surface or they made it only slightly worse. However, pinching the surface at regular (1 cm) intervals with calipers significantly increased the dissipation depth, possibly due to small cracks formed by the mechanical contact. Similarly, the mechanically polished microscope slide had the highest measured . It is interesting to note that the surface of Fiber I, after being significantly damaged by calipers, was restored to a condition better than as drawn (or perhaps more appropriately better than “as stored and handled”) by the HF etch. The resulting dissipation depth agrees with the best as drawn case, having a value of about .
The question arises why most samples undergoing HF etches did not show significant surface improvement. In the case of the severely damaged slide, we believe the etch was too shallow. After etching, hairline scratches on the slide were visible to the naked eye. Etching opens up microscopic cracks imparted by the polishing process and their presence, post-etch, is evidence that the surface was still damaged. As for the fiber etches, only one (the etch of Fiber I) resulted in an improved dissipation depth. This may be due to the fact that Fiber I had an as drawn dissipation depth somewhat higher than any other fiber and may have been inadvertently damaged between drawing and installation in our apparatus. Mechanical damage can be repaired by HF etching kreidl ; doremus (though the etches must be sufficiently deep). The HF etch may thus have removed the damaged surface of Fiber I, reducing the dissipation depth from the initially measured value.
We should not neglect the possibility that chemical contamination of the surface, in particular contamination with atmospheric water,doremus may also lead to increased loss. The ubiquity of values in the range 100-200 could be due to the difficulty of isolating samples from atmospheric water. This would also explain the failure of the etches to reduce the dissipation depth below this range.
IV Surface Loss due to Optical Coating
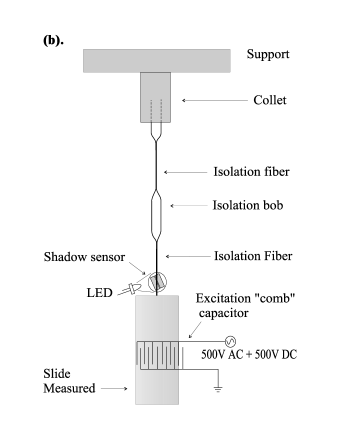
The surface loss due to optical coatings was investigated by measuring the quality factors of the modes of fused silica slides. We measured the s for three slides of dimensions 76 mm 25 mm 1 mm. The slides were suspended below a monolithic, fused-silica isolation system, as shown in Fig. 1b. The slides’ vibration was monitored by positioning the LED and shadow sensor around the suspending fiber directly above the slide.
Two of the three slides, A and B, were optically coated while the third slide, C, was retained uncoated as a control. (Slide C was later etched as reported in the preceding section.) As supplied, the slides had received a commercial 80-50 polish. The optical coating applied to Slide A and Slide B was a high-reflective (HR) coating thick consisting of 14 layers of alternating SiO2 and Ta2O5. The slides were coated by ion beam sputtering in the same coating run as optics for LIGO by Research Electro-Optics Corporation in Boulder Colorado. After the coating run they were baked at 450∘C to relieve stress.
The quality factors for each measured resonant mode of slides A and B and equivalent dissipation depths are shown in Table 2. The quality factors and equivalent dissipation depths for the measured modes of the uncoated Slide C (as supplied) are given for comparison.
| Slide | Surface treatment | Mode | Frequency | [m] | |
|---|---|---|---|---|---|
| A | HR-coating with no | 2 | 1022 Hz | ||
| visible damage | 3 | 1944 Hz | |||
| 4 | 2815 Hz | ||||
| B | HR-coating damaged | 2 | 952 Hz | ||
| at top by flame. | 3 | 1851 Hz | |||
| B | Damaged region removed | 2 | 962 Hz | ||
| C | Uncoated, as supplied | 2 | 1188 Hz | ||
| (“80-50” polish) | 3 | 2271 Hz |
The coated Slide B was suspended from the center of one of its short edges, as shown in Fig. 1b. When the supporting fiber was connected to the slide using a hydrogen-oxygen torch the coating became visibly damaged. Where the flame from the torch contacted the coating, the coating took on a milky appearance. This occurred in a crescent shape approximately 3 mm across at the top of the slide. The high value of for the second mode is believed to be due to this damage. To test this, the top 5 mm of this slide were immersed in a 50% solution (by weight) of HF and water for about 6 hours. Rinses with distilled water were applied periodically to remove flakes of the coating. The etch removed most of the damaged part of the coating and the was re-measured. The and dissipation depth of the second mode was now of the same magnitude as that measured for the third mode and for all modes of Slide B.
The coated Slide A was hung from a corner rather than from the center of the top edge. This was because, in the corner, the fused silica substrate was masked (by the supports) during the coating process. This left a region with no optical coating about 1 mm in radius and centered on the corner. The fiber was very carefully welded to the slide at this point. While some heat from the torch certainly reached the coated region, no damage to the coating could be seen afterwards. Both modes of Slide A showed similar Qs and similar dissipation depths as the modes of Slide B after the damaged region was removed. Since the uncoated Slide C has significantly less dissipation than the coated slides, and since the coated slides all show approximately the same level of dissipation, we conclude that the high dissipation depth associated with the coated slides, cm, is a result of the HR optical coating. If the coating is modeled as having homogeneous loss , and we assume that loss in the interface between the coating and substrate is negligible, then is simply Andri
| (2) |
where is the thickness of the coating. Thus, we obtain the preliminary result,
| (3) |
If our measurements are characteristic of the coatings for LIGO, this would lead to noticeably increased thermal noise for the LIGO test masses. However, the surfaces of the slides did not receive the same treatment prior to the coating as the LIGO test masses. They were not superpolished and no particular efforts were made to ensure the absolute cleanliness of the surfaces. It is possible that the interface between the coating and the silica is more lossy than a polished surface interface would be. Superpolished samples of fused silica have been obtained and research is continuing to determine the loss in superpolished and coated samples.
V Implications for Thermal Noise
Surface loss in the filaments suspending LIGO test masses could have implications for the interferometer noise budget.ribbon_paper Surface loss associated with fibers implies a lower limit on the level of pendulum mode thermal noise achievable using thin ribbon suspensions. While dissipation dilution implies reduced pendulum mode thermal noise as the ribbon thickness is reduced, the effects of surface loss are increased. The result is a diameter-independent lower limit for the pendulum mode thermal displacement noise spectral density
| (4) |
where is the angular frequency, is Boltzmann’s constant, is the temperature, is the acceleration due to gravity, is the suspended mass, is the length of the suspension, is Young’s modulus, and is the stress in the suspending ribbons. For typical values of the parameters and m, we have
While this is sufficient for the goals of LIGO II, it is clear from the dependence on that mechanical surface damage such as is induced by calipers must be prevented.
Surface loss due to optical coatings may significantly increase the thermal noise due to internal modes of the test masses. To relate the dissipation depth measured for an optical coating to the internal mode thermal noise we follow the work of LevinLevin and Bondu et alBondu . This enables an approximate calculation of the relevant . Using Eq. 1 we obtain after some analysis a preliminary estimate for the test-mass loss angle,
| (5) |
where is the radius at which the amplitude of the beam falls to of its maximum value. Since cm in LIGO I, and will be of the same order in LIGO II, it is clear that if cm, as measured for the coated slides, then the HR coating will be a significant contributor to test mass thermal noise.
References
- (1) A. M. Gretarsson, G. M. Harry, Rev. Sci. Instr., 70 4081 (1999).
- (2) S. Rowan, S.M. Twyford, J. Hough, D.-H. Gwo and R. Route Phys. Lett. A 246 471 (1998).
- (3) Uhlman and Kreidl ed., Elasticity and Strength in Glass, Academic Press, New York, 1980.
- (4) R. H. Doremus, Glass Science, Second Edition, John Wiley, New York, 1994.
- (5) A manuscript describing these effects is in preparation by the authors and by S. Rowan, G. Cagnoli, and J. Hough of University of Glasgow.
- (6) Y. Levin, Phys. Rev. D 57 659 (1998).
- (7) F. Bondu, P. Hello, J. Y. Vinet, Phys. Lett. A 246 227 (1998).