Electric-octupole and pure-electric-quadrupole effects in soft-x-ray photoemission
Abstract
Second-order [, ] nondipole effects in soft-x-ray photoemission are demonstrated via an experimental and theoretical study of angular distributions of neon valence photoelectrons in the 100–1200 eV photon-energy range. A newly derived theoretical expression for nondipolar angular distributions characterizes the second-order effects using four new parameters with primary contributions from pure-quadrupole and octupole-dipole interference terms. Independent-particle calculations of these parameters account for a significant portion of the existing discrepancy between experiment and theory for Ne first-order nondipole parameters.
pacs:
PACS: 32.80.Fb, 31.25.EbA mainstay of photoemission is the (electric-)dipole approximation (DA), in which all higher-order multipoles are neglected [2]. The range of validity of the DA has received renewed interest as recent experiments [3, 4] uncovered breakdowns at progressively lower photon energies. At high energies (5 keV), breakdown of the DA in photoionization is well-known, and a proper description requires inclusion of many multipoles [5]. For soft-x-ray (5 keV) photoionization, in contrast, first-order [] corrections to the DA generally have been considered sufficient [6]. At these relatively low energies, DA breakdown primarily leads to forward/backward asymmetries in photoelectron angular-distribution patterns. Especially striking have been observations of nondipole effects at energies below 1 keV [4], a region in which the DA is usually considered valid. In the present work, an experimental and theoretical analysis of neon valence photoemission demonstrates a new, and unexpected, breakdown: significant second-order [] nondipole effects, primarily due to electric-octupole and pure-electric-quadrupole interactions, in low-energy photoemission.
We begin with Cooper’s formula for the differential photoionization cross section of a subshell in a randomly oriented target using linearly polarized light [7]:
| (2) | |||||
where is the photoionization cross section, describes the angular distribution within the DA, and and are nondipole angular-distribution parameters characterizing the leading first-order corrections to the DA (mostly terms). The angles and are determined by the direction of the photoelectron relative to the photon-polarization and photon-propagation directions, respectively. The first two terms on the right of Eq. (2) constitute the usual DA expression for the differential cross section, and the DA notion of a ”magic angle” [, ] is preserved only in the plane perpendicular to .
At this level of approximation, recent rare-gas experiments [3, 4] observed significant modifications of photoelectron angular distributions from DA expectations, generally in good agreement with first-order independent-particle-approximation (IPA) calculations [7, 8]. The only exception is Ne [4]; while measured values of ( is negligible when ) agree fairly well with calculations, measured values of the combined parameter () are 30% larger than IPA predictions for energies near 1 keV.
The same experiment also found disagrees substantially with IPA calculations in this energy region, but is in close agreement with correlated calculations using the random-phase approximation (RPA) [9, 10], thereby identifying important electron-correlation effects well above the thresholds [11]. This result led to speculation [4] the discrepancy between measured and IPA-calculated values might also be due to interchannel-coupling effects. However, subsequent first-order nondipole calculations including electron correlation [12] disproved this notion; RPA values of Ne are in excellent agreement with the uncorrelated IPA results [7, 8].
In this work, we explain much of this discrepancy between theory and experiment for Ne . Beginning with theory, second-order [] corrections to the differential cross section, which arise from interferences between , , , , and , and from retardation corrections to amplitudes, are incorporated into Eq. (2):
| (5) | |||||
where the -parameters , and are introduced [13]. Three of them satisfy the constraint . Reference [13] contains complete formulae and a tabulation of first- and second-order parameters for all subshells of the rare gases helium to xenon.
For experiment, we first present results for Ne and determined assuming only first-order corrections, embodied in and , are needed to correctly interpret the data. The experiments were performed with an apparatus designed to measure deviations from the DA [14]; and are determined using angle-resolved photoemission intensities at and both and . Figure 1 compiles old [4] and new values for and (open squares) determined in this way. The solid curves represent calculations [7, 8, 12], which agree well with the results, but disagree with the results above 800 eV.
To obtain predictions (dotted curves in Fig. 1), we first carried out numerical IPA studies of second-order corrections for neon. Wavefunctions for bound-state and continuum electrons were obtained from the radial Dirac equation in a modified Hartree potential. Values for all angular-distribution parameters were calculated up to 2 keV. Our results for and are in excellent agreement with previous nonrelativistic IPA calculations [7]. Figure 2 shows values for , , and () obtained from our second-order IPA calculations. Primary contributions to these parameters come from and terms, with the octupole term contributing about 65% at 1 keV. A smaller contribution () comes from the term.
For our measurement geometry [14], Eq. (5) and our calculations can be used to estimate the influences of second-order effects on the analysis of experimental results for (). Specifically, an effective value of , including these influences, can be defined as
| (6) | |||||
| (7) |
using the notation . Using the results in Fig. 2, for and for can be determined and compared to the results in Fig. 1 to identify influences of second-order nondipole effects. (We stress the measurements are fine, only the assumptions behind their analysis are suspect.) This exercise yields the dotted curves in Fig. 1, providing excellent agreement with and clearly improved agreement with . The second-order corrections contained in account for much of the difference between the first-order theory and experiment for , demonstrating the first observation of effects in soft-x-ray photoemission.
To confirm this unexpected finding, we made additional measurements with our apparatus, which contains four electron analyzers in a chamber which can rotate about the photon beam. At a nominal angular position, two analyzers are at and in the plane perpendicular to the photon beam (), which we refer to as the dipole plane because first-order corrections vanish, while the other analyzers are positioned on the cone in the forward direction with respect to the photon beam, with one of them at and . Photoemission intensities in the magic-angle analyzers are independent of and can differ only because of nondipole effects. While the magic angle is no longer strictly valid when second-order effects are included, calculations show they can be unimportant in certain geometries (see below).
New measurements were performed at ten rotational positions, yielding 20 angle-resolved intensities for Ne and photoemission at different angles within the dipole plane, and 20 more at different angles and around the nondipole cone. From the calculated results for in Fig. 2, direct second-order effects on should be insignificant; near 1 keV, much smaller than our measurement uncertainties. Therefore, values of determined from the dipole-plane spectra should agree well with DA calculations, if effects due to , , and are negligible in the dipole plane. Using Fig. 2, the influence of these parameters on angle-resolved photoemission intensities can be predicted. In the dipole plane, we predict their effects will mostly cancel, and thus the excellent agreement [11] between experiment and theory for is not surprising.
In the nondipole cone, influences of the second-order parameters are superimposed on intensity variations due to the dipole and the first-order and parameters. However, for both and , our calculations predict effects due to , , and also mostly cancel around the nondipole cone. Furthermore, small residual effects around this cone are similar in sign and magnitude for and , which is relevant because intensity ratios are the raw input for data analysis. Assuming no influence of second-order effects in the nondipole cone, we modeled the measured ratios around this cone using Eq. (2) to derive values for and . These results (solid circles in Fig. 1) agree extremely well with first-order calculations [7, 8, 12], confirming our prediction of near cancellation of second-order effects in this geometry.
The above confirmation tests include two independent experimental methods to determine and : one relies on measurements at many angles in the nondipole cone, the other relies on comparison of magic-angle-only measurements in the dipole plane and the nondipole cone. For the former, second-order effects mostly vanish. For the latter, in contrast, the influences of , , and on Ne photoemission are expected to be opposite in sign for and , because of the terms in Eq. (5). Thus, second-order effects should be observable with the latter method, hence the differences in values for derived using the two methods.
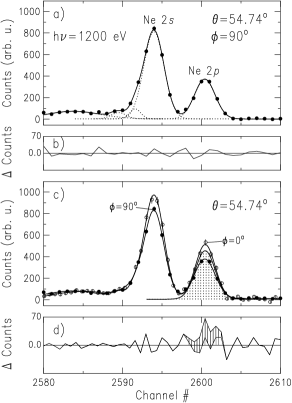
As a demonstration of the influence of second-order nondipole effects on angle-resolved-photoemission intensities, Fig. 3 compares spectra taken with the two magic-angle analyzers. Figure 3a contains a neon photoemission spectrum taken at =1200 eV, , and in the dipole plane, where influences of , , and vanish. Included are fit curves showing modeled peak shapes and photoemission satellites to the left of the peak. The overall fit (solid curve) matches the data very well, as indicated by the residual in Fig. 3b.
This spectrum and fit are reproduced in Fig. 3c and compared to a nondipole-cone spectrum at 1200 eV, , and . Intensity normalization between the spectra was achieved using from Fig. 1, for which experiment and theory agree well. By inspection, the ratio is different in the two spectra. One possible explanation is a differential influence of first-order nondipole effects on the and intensities. As a quantitative test of this hypothesis, we derived the dotted region in Fig. 3c by multiplying the fit to the peak in the dipole-plane spectrum by the expected differential effect on and peak intensities in the nondipole-cone spectrum determined from IPA-/RPA-predicted values for and (see Eq. (2)). If first-order effects alone explain the observed variation of the ratio, then the dotted region should coincide with the peak in the nondipole-cone spectrum. It does not, and thus the difference between the dotted region and the open-circle data () is attributed to the influence of second-order effects.
In conclusion, an experimental and theoretical study of valence photoemission from neon has demonstrated the first observation of second-order (primarily and ) nondipole effects on photoelectron angular distributions in the soft-x-ray region. A general expression for the differential photoionization cross section, including all contributions through second order, has been derived in a form convenient for comparison to experiment.
This work was supported by NSF and DOE EPSCoR. AD and WRJ were supported in part by NSF grant PHY-99-70666. DWL acknowledges UNLV Sabbatical Leave support. The experiments were performed at the Advanced Light Source at Lawrence Berkeley National Lab., supported by the DOE Materials Science Division, BES, OER under contract DE-AC03-76SF00098.
REFERENCES
- [1] Present address: ITAMP, Harvard-Smithsonian Center for Astrophysics, Cambridge, MA 02138.
- [2] H. A. Bethe and E. E. Salpeter, Quantum Mechanics of One- and Two-Electron Atoms (Springer-Verlag, Berlin, 1957).
- [3] B. Krässig, M. Jung, D. S. Gemmell, E. P. Kanter, T. LeBrun, S. H. Southworth, and L. Young, Phys. Rev. Lett. 75, 4736 (1995); M. Jung, B. Krässig, D. S. Gemmell, E. P. Kanter, T. LeBrun, S. H. Southworth, and L. Young, Phys. Rev. A 54, 2127 (1996).
- [4] O. Hemmers, P. Glans, D. L. Hansen, H. Wang, S. B. Whitfield, D. W. Lindle, R. Wehlitz, J. C. Levin, I. A. Sellin, R. C. C. Perera, E. W. B. Dias, H. S. Chakraborty, P. C. Deshmukh, and S. T. Manson, J. Phys. B 30, L727 (1997).
- [5] H. K. Tseng, R. H. Pratt, S. Yu, and A. Ron, Phys. Rev. A 17, 1061 (1978).
- [6] D. W. Lindle and O. Hemmers, J. Electron Spectrosc. 100, (1999) in press, and references therein.
- [7] J. W. Cooper, Phys. Rev. A 47, 1841 (1993); 42, 6942 (1990).
- [8] A. Bechler and R. H. Pratt, Phys. Rev. A 42, 6400 (1990); 39, 1774 (1989).
- [9] W. R. Johnson and C. D. Lin, Phys. Rev. A 20, 964 (1979); W. R. Johnson and K. T. Cheng, ibid. 20, 978 (1979).
- [10] M. Ya. Amusia and N. A. Cherepkov, Case Studies in Atomic Physics (North-Holland, Amsterdam, 1975), Vol. 5, p. 155.
- [11] E. W. B. Dias, H. S. Chakraborty, P. C. Deshmukh, S. T. Manson, O. Hemmers, P. Glans, D. L. Hansen, H. Wang, S. B. Whitfield, D. W. Lindle, R. Wehlitz, J. C. Levin, I. A. Sellin, and R. C. C. Perera, Phys. Rev. Lett. 78, 4553 (1997).
- [12] W. R. Johnson, A. Derevianko, K. T. Cheng, V. K. Dolmatov, and S. T. Manson, Phys. Rev. A 59, 3609 (1999).
- [13] A. Derevianko, W. R. Johnson, and K. T. Cheng, At. Data Nucl. Data Tables 74 (1999) in press. The parameters , , and in this work have been replaced here by , , and to avoid confusion with photon wavelength and frequency.
- [14] O. Hemmers, S. B. Whitfield, P. Glans, H. Wang, D. W. Lindle, R. Wehlitz, and I. A. Sellin, Rev. Sci. Instrum. 69, 3809 (1998).