A Minimal Model of B-DNA
Abstract
Recently it has been found that stable and accurate molecular dynamics (MD) of B-DNA duplexes can be obtained in relatively inexpensive computational conditions with the bulk solvent represented implicitly, but the minor groove filled with explicit water (J. Am. Chem. Soc. 1998, 120, 10928). The present paper further explores these simulation conditions in order to understand the main factors responsible for the observed surprisingly good agreement with experimental data. It appears that in the case of the EcoRI dodecamer certain sequence specific hydration patterns in the minor groove earlier known from experimental data are formed spontaneously in the course of MD simulations. The effect is reliably reproduced in several independent computational experiments in different simulation conditions. With all major groove water removed, closely similar results are obtained, with even better reproducibility. On the other hand, without explicit hydration, metastable dynamics around a B-DNA like state can be obtained which, however, only poorly compares with experimental data. It appears, therefore, that a right-handed DNA helix with explicitly hydrated minor groove is a minimal model system where the experimental properties of B-DNA can be reproduced with non-trivial sequence-dependent effects. Its small size makes possible virtually exhaustive sampling, which is a major advantage with respect to alternative approaches. An appendix is included with a correction to the implicit leapfrog integrator used in internal coordinate MD.
I Introduction
Understanding of the detailed molecular mechanisms of conformational dynamics of the double helical DNA is an important goal on the long way to control of genom functions. Computer simulations are the main theoretical instrument in such studies. An important recent progress in the methodology [1, 2, 3] has made possible molecular dynamics (MD) simulations of short DNA fragments in realistic water environment with explicit counterions (comprehensive surveys of the literature can be found in the recent reviews [4, 5]). In should be noted, however, that although in future these methods will probably be able to describe in full detail all interactions involved in the numerous biological functions of DNA, at present their capabilities are very limited. There are many important domains where they can hardly be applied, in the foreseeable future, for instance, dynamics of long linear DNA fragments or plasmids. Even for small oligomers these methods require supercomputer resources because the solute molecule must be placed in a large enough water box to accommodate all neutralizing counterions without exceeding reasonable levels of effective DNA and salt concentrations. This makes any methodological questions difficult, especially those concerning statistical reproducibility of results because, until now, almost all reports on the subject described observations made for single trajectories.
The foregoing arguments explain why it is necessary to find alternative conditions for MD simulations of B-DNA which would be less computationally demanding, but yet acceptably accurate. The utility of such DNA model would be twofold. On the one hand, it can give a unique opportunity to probe the properties of large systems of real biological importance where more rigorous approaches would be prohibitively expensive. On the other hand, for smaller molecules they can provide for an exhaustive sampling of the configurational space, which is a necessary prerequisite of a more systematic studies of detailed mechanisms involved in the conformational dynamics of double helical DNA. We have recently found that surprisingly stable dynamics of B-DNA duplexes can be obtained with semi-explicit treatment of long-range electrostatics effects. [6] Paradoxically, it appeared that this simplistic approach results in B-DNA conformations that are significantly closer to experimental data than ever before, including the recent more rigorous and expensive calculations. This relative success raised several intriguing questions concerning its origin. On the one hand, a better agreement with experimental data can always result from a fortunate cancelation of errors. On the other hand, it is possible that the earlier reported a priori more rigorous calculations failed to reveal the full accuracy of the recent atom parameter sets, notably AMBER94, [1] because of insufficient duration of trajectories or some problem in calculation of long range electrostatic interactions by the particle-mesh Ewald technique. [3] Both these possibilities should be checked, but the former is certainly easier to analyze because this does not require expensive computations.
In this paper we address some of the above questions by further exploring the dynamic behavior of B-DNA duplexes with partial explicit hydration shell. Our main objective is to justify what we call a “minimal B-DNA”, that is the least computationally demanding simulation conditions where the essential experimental features of this molecule can be reliably reproduced. It is shown that a good candidate is a B-DNA duplex with explicitly hydrated minor groove, empty major groove, and the electrostatic effects of the bulk solvent accounted for implicitly. We report also about relatively successful attempts to obtain stable dynamics without explicit hydration, which, however, give much worse agreement with experimental data. In contrast, dynamics of the minimal model reliably reproduces certain well-known sequence dependent effects, notably, modulation of the minor groove width and spontaneous formation of specific “spine” hydration pattern observed in many experimental structures. At the same time, for two very different sequences it converges to significantly different conformations which, however, are both close to the canonical B-DNA form. These results appear relatively insensitive to variations of parameters involved in the simplified treatment of long-range electrostatic interactions.
II Methods and Simulation Protocols
All new MD simulations reported here have been performed with the internal coordinate molecular dynamics (ICMD) method. [7, 8, 9, 10, 11] Here we employ a modified implicit leapfrog integrator detailed in the Appendix. We consider dynamics of two different DNA duplexes with sequences d(CGCGAATTCGCG)2 and d(GCGCGCGCGCGC)2. Most of the calculations were made with the first molecule often referred to in the literature as “EcoRI dodecamer”. The second dodecamer is used for comparison. The EcoRI sequence was the first to crystallize in the B-form of DNA [12] and since then it became perhaps the most studied DNA fragment both experimentally and theoretically. [13, 14, 15, 16, 17, 18, 19] In the recent years it has been often used in benchmark tests of new force fields and algorithms. [6, 20, 21, 22, 23, 24, 25, 26, 27, 28, 29] The DNA model was same as in our recent report, [6] namely, all torsions were free as well as bond angles centered at sugar atoms, while other bonds and angles were fixed, and the bases held rigid. The dynamic properties of this model, notably, the fastest motions and maximal possible time steps have already been studied. [6] AMBER94 [1] force field and atom parameters were used with TIP3P water [30] and no cut off schemes.
The solvent effects were taken into account by the mixed strategy [6] which we continue to explore and improve here. In this method, following to a long known approximate approach, [31, 32, 33] long range effects are taken into account implicitly by reducing phosphate charges and using a linear distance dependent dielectric function . On the other hand, the minor groove of the DNA molecule is filled up by explicit water with the water cloud somewhat protruding in space. In the initial hydration procedure the DNA molecule is first covered by a 5 Å thick water shell by placing it in a water box and eliminating overlapping and distant solvent molecules. To allow water molecules to penetrate into the minor groove, rather small cut-off distances are used as the overlap criteria, namely, 1.8 and 1.3 Å for oxygen and hydrogen water atoms, respectively. After that cylinder-like volumes around each strand are built from spheres centered at phosphorus atoms with radii of 12 Å. All water molecules that appear outside the intersection area of the two volumes are removed. The solvent remaining is next relaxed by energy minimization first with the solute held rigid and then with all degrees of freedom. This procedure gives a partially hydrated duplex, with the minor groove completely filled and a few solvent molecules in the major groove. In some calculations we additionally cleaned the major grove from the remaining water after the second minimization. The motivations for this additional step are discussed in the text.
The standard heating and equilibration protocols have been slightly modified compared with our previous studies. Dynamics was initiated with zero solvent temperature by giving the solute a kinetic energy corresponding to 300 K. During the initial short 2 ps run the temperature was weakly coupled to 250 K by the Berendsen algorithm [34] with a relaxation time of 1 ps. During the next 5 ps the temperature coupling was switched off and at the end of the whole 7 ps period the system temperature normally reached 200 K. Starting from this state the production trajectory was computed with the temperature coupled to 300 K with a relaxation time of 10 ps. This algorithm provides for a softer start and helps to reduce dissociation of hot water molecules during the early non-equilibrated phases of dynamics. [6] For trajectories starting from the canonical B-DNA form the energy minimization was applied both before and after hydration. Hydration of the Xray structure [12] was performed with all crystallographic water molecules kept in their places.
Normally we used time steps of 5 and 10 fs in heating and production runs, respectively. The possibility and the necessary conditions for this large time steps have been discussed elsewhere. [6, 40, 41] Duration of trajectories varied depending upon specific conditions discussed in the text. In calculations with the solvent shell a minimum duration of 5 ns was usually sufficient to arrive at stable levels of average helical parameters as well as rmsd’s from the reference conformations. In production runs conformations were saved with a 2.5 ps interval. Structures from the last nanosecond were used for computing an average conformation referred to as the final MD state of the corresponding trajectory. The reference canonical A and B forms were constructed with NUCGEN utility of AMBER [39] or JUMNA program. [33] Curves [42] and “Dials and Windows” procedures [43] were used for analysis of DNA conformations. XmMol program [44] was used for visual inspection and animation of trajectories.
III Results and Discussion
A General Outline of Simulations and Results
Tables I, II and Figs. 1 and 2 characterize in general the numerical experiments and results considered in detail in sections below. Table I summarizes variations of computational protocols for different trajectories. For brevity each trajectory is referred to by using a single-letter code with a prefix “TJ”. Trajectories from A to K computed for the EcoRI dodecamer differ either by the starting state, or by the details in the application of hydration procedures, or by the reduced phosphate charge. TJA, TJB, and TJC have been the subject of our previous report. [6] They are discussed together with the rest and are included in Table I for completeness. It is worth reminding here that TJC was computed by using the conventional Cartesian coordinate MD method starting from the same state as TJA. TJD and TJI also started from the same conformation, namely, the Xray structure, [12] with significantly different initial distribution of water molecules obtained by varying parameters of the hydration algorithm. TJE, TJF, and TJG were computed in the dehydrated state of the duplex to clarify the role of the explicit water and study the effect of phosphate screening. Similarly, TJH, TJI, TJJ, and TJK were calculated for the same model system with different phosphate screening parameters. Finally, TJL computed for another sequence checks the possibility of observing sequence dependent structural effects with this DNA model.


Figure 1 presents the final states of representative trajectories in Table I together with the canonical B-form and the Xray structure of the EcoRI dodecamer. The drawings are the outputs of Curves program [42] which also computes the optimal helical axis shown by a continuous roughly vertical line in each plate. Figure 2 shows variations of the minor groove widths for the same structures computed by the spline algorithm implemented in Curves. [45] On the right of each structure in Fig. 1 the rmsd from the canonical B-DNA is given. For EcoRI dodecamer the second value shows the rmsd from the Xray conformation. This structure is asymmetrical and, since the sequence is palindromic, the rmsd can be computed in two orientations. Both orientations were tried and the lower rmsd values are given in Fig. 1. It is seen that the structures are generally close to the two experimental B-DNA conformations, with a few exceptions to be discussed hereafter. The majority of the computed structures of the EcoRI dodecamer have a characteristic profile of the minor groove with a narrowing in the center, which is a well-known feature of the experimental crystallographic structure. [46] These results confirm our initial report on these simulation conditions. [6] Time dependencies of rmsd’s are not analyzed here systematically. We note only that for trajectories with the final rmsd values below 2 Å they were qualitatively similar to those reported for TJA, TJB and TJC. Namely, after the first 100 ps the rmsd from the canonical B-form and the Xray structure are usually found between 2.5 and 3.5 Å. In our earlier calculations [6] this large initial shift was either already present in the initial conformation or resulted from in vacuo energy minimization of the canonical B-DNA form, but it also occurs in trajectories starting from the Xray conformation. During the first two nanoseconds the rmsd values gradually decrease, with the 2 Å level commonly passed within the second nanosecond. The lowest rmsd values from experimental B-DNA conformations are usually reached within the first three nanoseconds and next the drift becomes below the level of fluctuations in the nanosecond time scale.
Selected averaged helical parameters corresponding to the structures in Fig. 1 are assembled in Table II. The complete set of these parameters have been discussed for TJA, TJB and TJC, [6] and here we note only that parameters not included in Table II do not show systematic deviations from experimental values. In contrast, Xdisp and inclination obtained in different simulations for EcoRI sequence show a small but systematic deviation. Propeller is generally well reproduced, and it is included in Table 1 because it plays an important structural role for AT-rich sequences [47] and is rather sensitive to simulation conditions. Finally, twist and rise are the key helical parameters responsible for the major part of rmsd’s. The time variation of the helical parameters in the present B-DNA model has already been characterized. [6] It is similar to the above described behavior of rmsd’s in the sense that it usually takes about 3 ns for the main parameters to come close to the standard B-DNA values. In all calculations reported here the initial large rmsd’s are accompanied by low average twist which usually raise from 32–33∘ to 34–35∘ during calculations.
B B-DNA Dynamics in the Dehydrated State
It is known since long ago that reasonably good duplex DNA conformations can be obtained by minimization of potential energy with implicit modeling of solvent effects, notably, by reducing phosphate charges and scaling of Coulomb forces with a distance dependent electrostatic function. [48] On the other hand, it is also known that these structures are not dynamically stable. [16] The dehydrated state presents non-negligible theoretical interest because the “naked DNA” is the core of the whole system and understanding its mechanics is important for distinguishing between the trends that originate from intra-duplex interactions and water effects. We briefly report here about a few interesting lessons that we have learned from ICMD simulations of B-DNA in the dehydrated state.
We hoped initially that, due to the reduced flexibility of the standard geometry DNA model, its structure could be more stable than in the earlier Cartesian coordinate MD simulations. It was found, however, that trajectories generally tend to be trapped in earlier described deformed states characterized by a collapsed minor groove. [16] Such transformations invariably start from a phosphate flip, which can next result in a significant deformation of the standard B-DNA shape, with partial local closing of the minor groove. This behavior seems to be an intrinsic defect of in vacuo conditions. However, the probability of collapsing transitions was high only during the first nanosecond when, in animation, the DNA molecule exhibited very violent periodical low frequency bending and stretching motions. This intermediate phase is caused by the heating procedures that commonly last less then 10 ps and always use some velocity scaling which, however, affects only normal modes that have non-zero instantaneous velocities. The slowest normal modes of a dodecamer B-DNA fragment have periods beyond 10 ps, [49] therefore, during heating, those that happen to be in their fast phase are strongly overheated. In vacuo the uneven distribution of the kinetic energy is rather persistent and it apparently takes hundreds of picoseconds to reach equipartition. In many test calculations we observed that if the structure managed to survive the first nanosecond, it continued to stay in a reasonably good B-DNA form for rather long time so that its average dynamic properties could well be characterized. transitions still occur, but the minor groove does not close immediately and many such transitions appear reversible.
Trajectories TJE, TJF, and TJG in Table I have been computed with special precautions that take into account the foregoing qualitative features. Dynamics were initiated with random velocities and during the first nanosecond the temperature was raised to 250 K by the Berendsen algorithm [34] with a relaxation time of 100 ps. Calculations were next continued with the standard parameters, that is with the bath temperature of 300 K and a 10 ps relaxation time. If a transition to a collapsed state was observed the calculations were restarted from one of the preceding conformations with random velocities at 300 K. Such restarts were repeated until a sufficiently long continuous trajectory have been obtained. In the case of TJF one restart was necessary to get a continuous 5 ns trajectory. TJG was also stable during 5 ns after one restart, but only the first 2.9 ns were used for analysis because a few reversible transitions that happened in its second part caused non-negligible temporary distortions. In contrast, in the case of TJG three restarts were necessary to obtain a 2.7 ns continuous run at the end of which the structure collapsed.

Figure 3 shows the time variations of rmsd from several reference structure for TJF. As wee see, the in vacuo dynamics are qualitatively different from that with explicit hydration. Namely, the short-time rmsd fluctuations are similar or even larger, but the trajectory apparently samples from a broad energy valley around one and the same state in which it appeared after equilibration. This system has an essentially constant list of atom-atom contacts. The local energy minima can occur due to complex energy profiles of base stacking, but they seem to be rather shallow and the trajectory passes above the barriers so that no distinct conformational transitions within the B-DNA family are observed. A few sharp peaks in the traces in Fig. 3 correspond to short-living transitions. The rmsd between the structures averaged over the five consecutive nanosecond intervals was as low as 0.1 Å. The final TJF state shown in Fig. 1 has rmsd of only 0.5 Å from the initial minimum energy structure.
Thus, a naked B-DNA duplex presents a relatively simple object with a single significant energy minimum which is rather broad. This state resembles the canonical B-DNA and is characterized by the rmsd’s of 3.1 and 4.5 Å, respectively, from B and A forms and some of its helical parameters shown in Table II are also between the canonical A and B-DNA values. The other two in vacuo trajectories were very similar. This means, in particular, that the shorter durations of TJE and TJG are quite sufficient for correct averaging. A visual analysis of the final TJF state superposed with the canonical B-DNA shows that the relatively high rmsd value results from the following main contributions: (i) lower negative Xdisp, (ii) much lower average twist, and (iii) small but non-negligible bending of the helical axis towards the center of the minor groove. The latter effect is very clear in superposition figures and it is nicely detected by the Curves algorithm. [42] The first two features give this structure some A-like character although one notes that in fact only these two helical parameters clearly deviate towards the A form. There was only very minor difference between the final states of these three in vacuo trajectories, which is discussed hereafter.
C Negative Role of Water Films in Major Groove
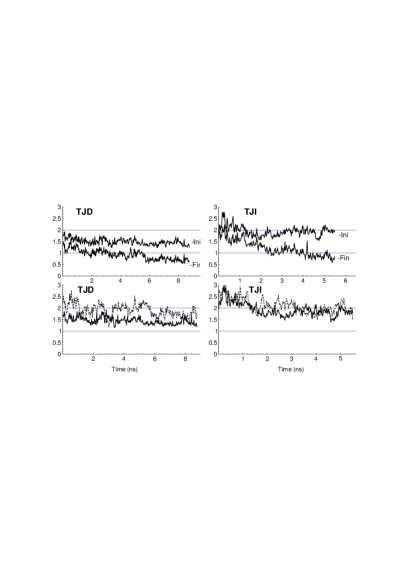
The hydration procedure described above has been designed to completely fill up the minor groove of B-DNA and also left in the major groove some small number of water molecules to which we initially did not pay much attention. The effect of this water is not negligible, however. Figure 4 compares the time variations of rmsd from reference conformations for TJD and TJI. In both cases the initial state of was prepared by hydrating the crystallographic structure which, because of the water crowding, has only slightly changed during energy minimization (the rmsd 1.25 Å). In the crystal conformation, the two opposite phosphate traces come close to each other in the middle, which is usually described as narrowing of the minor groove. [46] For this specific shape our hydration procedure left in the major groove a relatively large number of water molecules. The left two plates in Fig. 4 show that, in dynamics, the structure slowly returns to the initial state after first leaving it rapidly during heating. The lower plate shows the time variation of the rmsd from the crystal structure. Due to the symmetry of the sequence the rmsd comparison can be made in two ways giving the “proper” and “improper” rmsd values, the latter corresponding to the opposite assignment of the two strands. The crystal conformation itself is strongly asymmetric and characterized by a large “improper” rmsd of 1.7 Å. In dynamics, this initial asymmetry should relax, and the same level must be reached by the two rmsd values after an ultimate equilibration. Figure 4 shows that although the TJD trace of the “proper” rmsd reaches very low values it is systematically shifted downward from the “improper” trace. In other words, during these nine nanoseconds this symmetric DNA duplex always “remembers” the asymmetry of its initial state.
The right two plates in Fig. 4 exhibits analogous traces for TJI where all major groove water molecules were removed at the beginning. The total number of water molecules appears larger due to small variation of the hydration procedure, notably, the initial 5 Å shell was constructed with all crystallographic waters considered as part of the duplex. Note that the structure again moves out from the initial energy minimum and back, but the maximal rmsd value reaches 2.8 Å which is much larger than in the previous case. The deviation from the crystal conformation is also one angstrom larger, and, importantly, the two rmsd traces level after 3 ns indicating that the “memory” of the initial asymmetric conformation is essentially lost.
This example illustrates the general effect observed in many other simulations. When the number of water molecules is not sufficient to form a competent shell they cannot diffuse and tend to occupy fixed positions thus stabilizing some random conformations and slowing down the sampling. Very often they form films that connect several bases and phosphate groups and can induce local bending of the helical axis. To reduce these effects, in the last few trajectories in Table I the major grove was cleaned from the remaining water molecules before heating. This does not mean that we consider interactions in the major groove unimportant. The present DNA model essentially performs the structural analysis of water surrounded by the mobile DNA walls in the minor groove. The relatively small number of these molecules makes possible nearly exhaustive sampling. In doing so we implicitly assume that, due to much larger number of solvent molecules involved in hydration of the major groove, its water shell can easily take any necessary shape corresponding to a given DNA conformation. Our calculations show that an empty major groove is a much better approximation of such behavior than a faintly hydrated one.
D Characteristic Hydration Patterns
Figure 5 shows the final states of TJA and TJI with the most stable hydration sites in the minor groove. Atom coordinates from the trajectory points saved during the last nanosecond were superimposed, and the position fluctuations were computed for all water molecules. Figure 5 shows average oxygen positions for 20 least mobile water molecules in the minor groove, with the sites close enough for hydrogen bonding joined by the thick lines. The amplitudes of the position fluctuations range from 0.5 to 1.0 Å and are close to that of the neighboring DNA atoms indicating a tight binding. In case of TJA similar sites are also found in the major groove, but as we noted above they are not representative and we do not discuss them here. In TJA the slowest water molecules form a continuous cluster at the bottom of the minor groove. In contrast, in TJI several such clusters are separated by areas where water is more mobile. In both cases, however, in the middle of the minor groove a linear trace is found corresponding to the characteristic hydration pattern often observed in crystals and referred to as the “hydration spine”. [50]


Figure 6 shows schematically the time evolution of the minor groove hydration patterns in these two trajectories. The hydrogen bonding contacts shown for the central eight base pairs were taken from individual snapshots as follows. First, water molecules directly bound to bases were considered and the shortest water bridges between them were found. Only one and two member bridges are shown in the figure. The filled circles denote water molecules that keep their orientation in all subsequent snapshots. The orientation is considered to be maintained if there is at least one chain to a correct water-base contact. For clarity the opposite strands are shifted by one step with respect to the Watson-Crick pairing.
In TJA most hydration sites were vacant after heating while already at 1.25 ns they are all occupied, with the canonical spine structure formed in the middle which spans over six consecutive base pairs. The total number of water molecules selected by the foregoing rules slowly increases during the whole trajectory; the spine shortens and is gradually replaced by less economical patterns near both ends. The number of sites reaches 21 after 5 ns, but we note that the TJA plate in Fig. 6 actually shows 32 different water molecules, which manifests a certain level of exchange with the environment. It is readily seen that the three water molecules that form the first layer of the hydration spine are the most stable in this system. At the same time one notes that a transition from spine to ribbon type of hydration [51] occurs at the upper border of the spine.
The initial state for the TJI was prepared from the Xray structure with new water molecules added to already occupied experimental hydration cites. That is why in TJI the minor groove hydration is rather dense already after heating. The total number of solvent molecules selected by the chosen rules fluctuates at the level reached in TJA after 5 ns. As a whole the evolution of hydration patterns is rather different in TJI compared to TJA, but still water molecules at the bottom of the hydration spine are among the least movable. Note also that in this case a reversible transition from the spine to the ribbon type of hydration occurs at the upper spine border.
Spontaneous formation of the hydration spine in the middle of the minor groove has been observed in all trajectories computed for the EcoRI dodecamer. This characteristic water arrangement has been first encountered in the crystal structure of this duplex [50] and is generally considered as a characteristic feature of certain AT-rich sequences that tend to adopt an unusual conformation with a particularly narrow minor groove. [52] We may conclude, therefore, that the present B-DNA model nicely reproduces this well established experimental observation, which is the most probable origin of a surprisingly good correspondence between the computed and experimental DNA conformations. It can be noted also that the water structure in the minor groove is rather persistent and changes very slowly. As we discussed above, due to the initial “cleaning” of the major groove in TJI the DNA molecule lost the “memory” of the initial state much faster than in TJD. Figure 6 demonstrates, however, that throughout the trajectory the hydration patter is more spine-like in the lower part of the minor groove and more ribbon-like in the upper part, the feature inherited from the initial Xray structure where the spine expands from the center two times farther towards the narrower end of the minor groove. [53]
It should be noted, finally, that the spine may be also a model dependent feature. We have noticed that, although trajectories always start from a well minimized structure, the dynamics usually begins with rapid unwinding and extending of the DNA molecule, which narrows the minor groove and pushes much of the water out. This occurs regardless of the sequence and the spine is normally the first hydration pattern that sets up afterwards. The subsequent slow diffusion of water molecules into the minor groove usually takes several nanoseconds and often goes faster near the ends than in the middle. Nevertheless, the high stability of this specific hydration pattern in the center of the EcoRI dodecamer as well as for some other sequences like A-tracts, which are not considered here, is a sequence dependent feature. To support the last assertion we included in Tables I and II and also in Figs. 1 and 2 trajectory TJL computed in similar conditions for a GC-alternating dodecamer. Table II shows that, except for the twist, the final TJL state has average helical parameters even closer to the canonical B-DNA than EcoRI dodecamer. Notably, its inclination is negative and Xdisp is much less than in any EcoRI trajectory. In terms of rmsd it is similarly close to the canonical B-DNA. At the same time, the hydration patterns in the minor groove were very different from those discussed above and it is seen in Figs. 1 and 2 that the final TJL state has the minor groove evenly wider than in the canonical B-DNA form. The minor groove was narrow in the initial phase of the trajectory and then gradually opened. The distinct properties of regular sequences in this DNA model will be discussed in detail elsewhere.
E Long Range Electrostatics
The most surprising property of the present DNA model is that its trajectories converge to conformations that much better compare with experimental data than in more expensive calculations with explicit counterions and rigorous treatment of electrostatic interactions. [6] This would be less surprising if the adjustable parameters of the simple ad hoc treatment employed here were specifically fitted to experimental data, but, in fact, we have arbitrarily chosen one of the options earlier used in conformational analysis of DNA, not even the best recommended. [54] These observations suggest that the precision of calculation of long range electrostatic interactions may be generally less important for DNA structure than it is sometimes supposed. A comprehensive analysis of this fundamental issue is beyond the capabilities of this simple approach, nevertheless, it is interesting to check how this B-DNA model responds to variation of parameters involved in calculation of electrostatic interactions.
The in vacuo trajectories TJE, TJF, and TJG were computed with phosphate charges varied from -0.25 to -0.75. They produce very similar structures with rmsd between the final TJE and TJG states around 0.5 Å and the final TJF state at roughly 0.3 Å from the both. Table II exhibits very small, but regular variation of helical parameters. Namely, growing phosphate repulsion moves Xdisp, inclination and twist closer to the canonical B-DNA values, but propeller and rise in the opposite direction. The rmsd’s of the final MD states from the reference experimental DNA conformations are practically identical for all three trajectories.
The same range of phosphate charges is covered by trajectories TJH, TJI, TJJ and TJK where the minor groove has been hydrated. Table II shows that in this case variations of helical parameters are stronger and less regular, but some of them, notably, Xdisp, inclination and twist exhibit the same trends as in vacuo. Reduction of phosphate repulsion accentuates already existing small deviations from canonical B-DNA values towards A-DNA. The increased repulsion has an opposite effect and one may expect that, in terms of helical parameters, the best fitting of the computed and experimental conformations can be achieved with phosphate charges slightly below -0.6 aeu. Unexpectedly, however, variation of phosphate charges in an explicitly hydrated B-DNA model significantly affects the overall bending of the molecule which is seen in Fig. 1. In fact, all computed conformations of the EcoRI dodecamer except TJB are slightly bent towards the center of the minor groove. It appears that the increase in the phosphate repulsion also increases this bending, which is a non-trivial effect of the minor groove hydration since no such trend is observed in the in vacuo conditions. This effect deserves careful investigation because it in fact corresponds well to certain experimental observations. Gel retardation experiments with sequence repeats indicate that, in solution, the EcoRI dodecamer should be bent towards the center of the minor groove. [55] It is also known that DNA bending is generally reduced in high salt [56] which also reduces the persistence length of DNA, [57] with the latter effect attributed to reduced phosphate repulsion due to better screening. Comparison of the final states of TJH, TJI, TJJ and TJK suggests that, in the minimal B-DNA, bending is also somehow connected with phosphate repulsion and increased backbone stiffness also favors bending.
Because of the foregoing effect the rmsd’s from experimental B-DNA conformations does not follow the corresponding deviations of helical parameters. In the case of TJJ, for instance, the increased bending overshadows the small improvement in helical parameters with respect to the canonical B-DNA. These results generally show, however, that significant variations of the most arbitrary parameter involved in our simplistic treatment of the electrostatic effects still result in structures that are close to experimental B-DNA both in terms of helical parameters and atom rmsd’s. Note that the largest rmsd in Fig. 1 observed for TJH is lower than in all reported simulations with the particle-mesh Ewald method. [6] Although its helical parameters noticeably deviate from canonical values it still qualitatively reproduces the characteristic shape of the minor groove with a short hydration spine in the center.
F Concluding Discussion
The minimal model of B-DNA explored here consists of two qualitatively different components, namely, the DNA duplex and a water cloud docked in the minor groove. Dynamics simulations of a naked B-DNA duplex show that it presents a relatively simple object with a broad energy valley around a single state with an intermediate conformation between A and B DNA forms. This state is “fragile” in the sense that transitions, which are generally believed to introduce only subtle nuances in the B-DNA structure, [58] cause gross structural transitions to an essentially different DNA form with a collapsed minor groove. [16] With a water cloud docked in the minor groove the system acquires qualitatively different properties. Its potential energy landscape becomes rough, with multiple significant local minima corresponding to rearrangement of atom-atom contacts in water and at the DNA-water interface. Dynamics simulations of this system can be viewed as structural analysis of water near a mobile surface that carries a net negative charge and has a specific distribution of hydrogen bonding contacts.
The main advantage of these simulation conditions is the possibility of practically exhaustive sampling with the presently available computer resources. It should be noted that the sampling and the affordable duration of trajectories are not strict synonyms. The number of essential degrees of freedom is another important parameter that should not be ignored. We expect, for instance, that, in otherwise similar conditions, the rate of convergence would be lower for a B-DNA duplexes with both minor and major grooves hydrated explicitly. That is why, in our opinion, the minimal B-DNA should be distinguished and used, notably, for equilibration of the surface water in preparative phases of more expensive DNA simulations.
The properties of this system are non-trivial and sometimes counter-intuitive. We have shown here that the canonical B-DNA form presents a strong point of attractions in its conformational space, so that numerous trajectories of the EcoRI dodecamer and one long trajectory of the GC-alternating dodecamer converge to conformations with nearly canonical helical parameters. We have shown that the sequence specific features of the EcoRI dodecamer are nicely reproduced, namely, the profile of the minor groove and spontaneous formation of the characteristic “spine” hydration pattern which is generally considered as an indispensable part of this structure. [50] To our knowledge, none of the numerous earlier theoretical studies of this molecule could reach a comparable level of agreement with experimental data. All these observations justify the minimal model of B-DNA, confirm its credibility and suggest that it has a potentially wide scope of application.
A Corrected Implicit Leapfrog Integrator
The quasi-Hamiltonian equations of motion used in the ICMD method have the following general form [9]
| (A2) | |||||
| (A3) |
where the dot notation is used for time derivatives. Vectors , , and denote generalized coordinates, conjugate momenta, and generalized forces, respectively, is the mass matrix and is the inertial term. The implicit leapfrog integrator used for systems with flexible internal rings reads [10, 11]
| (A5) | |||||
| (A6) | |||||
| (A8) | |||||
| (A9) | |||||
| (A10) | |||||
| (A11) | |||||
| (A12) |
where the conventional notation is used for denoting on-step and half-step values. Vector denotes additional generalized forces that originate from ring closure constraints. The corresponding term is evaluated in Eq. (Af) and presents just an intermediate internal variable. Matrix denotes a projection operator. [10, 11] The lines marked by circles are iterated until convergence of Eqs. (Ab) and (Ac). For tree topologies this integrator is reduced to [9]
| (A14) | |||||
| (A15) | |||||
| (A16) | |||||
| (A17) | |||||
| (A18) |
These integrators had been in use for some time when an important failure has been revealed. Note that, unlike the classical leapfrog, algorithm Eqs. (A) computes both on-step and half-step coordinates, even though the forces need not be computed for half steps. The two sets of coordinates are coupled implicitly via the iterative cycle Eqs. (Ab-Ad) where and depend upon on-step and half-step coordinates, respectively. However, for each molecule the set of the generalized coordinates includes three Cartesian coordinates of the first atom [9] for which the inertial term in Eq. (A) is zero and thus the algorithm is reduced to the standard leapfrog. This means that the on-step and half-step translations are uncoupled and the corresponding half-step generalized coordinates can diverge. They, however, affect angular velocities via Eq. (Ad) thus becoming a hidden source of instabilities.

The above effect is exposed in Fig. 7a and 7b which show the time fluctuations of the potential energy computed for on-step and half-step coordinates, respectively, during a nanosecond trajectory of a hexamer DNA duplex with the sequence . The model system includes only two strands with no explicit water. During the first 100 ps no suspicious symptoms can be detected, but after that the half-step energies exhibit irregular fluctuations. They result from atom clashes which do not affect the trajectory, and just serve here as indicators of divergence. Figure 7 also explains why this problem has not been noticed immediately. Note that, in spite of the apparent difficulties, the trajectory has been successfully finished and we can add that the computed total energy was well conserved. For a single polymer chain this defect is indistinguishable regardless of the chain lengths. For ensembles of small molecules, like water, it produces a small increase in the drift of the total energy after many hundreds of picoseconds, which does not appear, however, if the trajectory is restarted periodically. It becomes significant only for DNA duplexes of 15 base pairs and longer, but in this case the instability develops too fast, without intermediate phase like in Fig. 7b, and results in sudden crashes of calculations which have been initially attributed to some unclear physical effects.
| (A19) |
This equation explicitly couples the on-step and half-step coordinates in the iteration cycle, which immediately eliminates all artifacts described above. Figures 7c and 7d demonstrate the performance of the refined integrator (A) for a trajectory starting from the same state as in Figs. 7a and 7b. It is not difficult to verify that Eq. (A19) does not change neither the order nor the time reversibility of integrators (A) and (A). It is not surprising, therefore, that in standard quality tests, which normally employ relatively short trajectories, this modification is absolutely neutral.
B Anonymous Comments
This section contains comments from anonymous referees of two peer-review journals where the manuscript has been considered for publication, but rejected.
1 Journal of Physical Chemistry
a First referee
Summary:
In this paper, the author reports on results obtained from dynamics calculations using a relatively new, “minimal” model for DNA salvation. This model consists essentially of hydrating the minor groove of the DNA and reducing the charges on the phosphate groups. Dynamics were carried out where only torsions and bond angles on sugars were free to change. Thus, this dynamics model consists of many fewer degrees of freedom than the typical “good quality” DNA model, and dynamics can be carried out with much less CPU time. A comparison of the results using the minimal model indicates that these results are in very good agreement with physical observation.
Review:
I am, quite frankly, very surprised at the results the author obtains with this minimal model. It is a widely-held belief that good realistic results for DNA dynamics can only be obtained with an explicit (periodic box) water model. More recently, it has been demonstrated that with standard molecular dynamics and explicit periodic water, one must also perform an Ewald type of calculations, whereby an infinite water lattice about the DNA is simulated. (See, in particular, the work of the Kollman and Darden groups). Certainly, the reduced phosphate model has been held in some disdain for years now as a semi-physical kludge.
That said, proof is the results, and I (and everyone else working in the DNA simulations field) will be very grateful if the minimal model holds up to additional testing.
And therein lies the rub… For while the tests performed in the current paper are enticing, they are not really complete enough to punch the conclusions home. In particular, a direct head-to-head comparison for the same DNA sequence to the results obtained an explicit (periodic box) water model and Ewald summation is missing. I understand that such an explicit water simulation is going to be much more cpu intensive. But it would considerably strengthen the conclusions of the paper to have such a comparison. In what ways do the results of the two methods agree and disagree? Without knowing that, we can’t really say, concertedly, whether the minimal model produces crudely acceptable results or something quantitatively better.
The other issue that worries me is alluded to in the paper. For the sequence used for the bulk of the simulations in this paper, it is well-known that the waters form a well-ordered “spine of hydration” in the minor groove. Could it be that the reason this minimal model works so well is that in this particular case is that the conformational preferences of the model are dominated by the spine of hydration? If so, it might be that the minimal model will fail for many other sequences. It would be reassuring to see the results of a number of other sequences, including some that are not expected to form a well-defined spine of hydration. The author does include results for one sequence, poly GC, as an indication that good results can be obtained even for sequences not generally observed to for the well-defined spine of hydration. But additional non-AT rich examples would be valuable.
Overall, I think the results presented in this paper are intriguing and food for additional thought. To make this paper considerably stronger, I would really like to see the comparison to explicit water dynamics. But with that issue addressed (as well the point about different sequences), this is definitely work I would like to see in print.
A final note: I am not fully convinced that J. Phy. Chem. would be the best place for this work. The emphasis here is really on the empirical biophysically-relevant results obtained with a previously published model. There is relatively little discussion of physics of the model itself. This is obviously and editorial judgment call, however.
b Second referee
This MS describes calculations attempting to model DNA with a partial solvent model in which the minor groove is filled with explicit water and the remainder of the environment of the molecule is treated with a distance dependent dielectric screening function. Molecular dynamics are performed to determine the trajectory of the molecule in phase space and compared with other relevant results.
In my consideration of this work, I cant really get beyond the problem of why in the world anyone would want to work on a model like this. Reports of MDs on DNA with fully explicit solvent including ions at various concentrations as well are typical of recent works and projects described in the current literature from the Kollman group, Pettitt group and others. Thus it is not necessary to make this approximation. Using this reduced model would end up having to be validated individually for each new sequence studied and there are surely cases it would fail. Thus it is misdirected effort to proceed in this manner in my opinion, since it is highly unlikely that this approach is the basis for methodology anyone would want to seriously peruse. The fact that reasonable results are obtained for the demonstration case does not ally my concerns.
2 Biopolymers
a First referee
The paper by Mazur is interesting and can be published in Biopolymers as is, but it would be appropriate to have the author comment on the applicability of this model. Briefly, he describes how a minimal model of DNA with only minor groove waters is stable under molecular dynamics for nanoseconds and stays closer to expt than full solvation model with counterions (he scales down the phosphate charges). In this manuscript he shows how this model is effected by phosphate charge and presence of major groove waters or exclusion of any waters. These are interesting issues. The point that I would like to have a comment is can such a model be sued for anything beside duplex DNA in the B form. It appears to be not appropriate for simulating the A to B transition because of the need to have changes in hydration of the grooves during this process.
b Second referee
There are some serious problems with this manuscript in both scholarship and technique. As such I can not recommend it for publication. To be specific:
1) Technically using the r-dielectric and explicit water is double counting. Either the waters to close proximity are counted in the explicit region or they are implicit. Allowing the r-dielectric in the explicit region is explicitly overcounting the hydration in that region. To add to that the phosphate charge reduction compound the physical picture nears to the point of having a non-physical model with, therefore, questional predictive power.
2) There is a deep problem with controls in this study. The amber force field has an A-state which is not accessible without the direct influence of coordinating ligands. Thus the B-states are all that left at ambient temperature and salt conditions. This has been explored rather intensely by a series of papers from the Kollman and Pettitt groups. The conclusion left the paper makes is thus that DNA in this force field is not stable with the r-dielectric, which is an old result, well known for some time.
c An adjudicator
I have a lot of trouble seeing what sort of future is for the model discussed here. At best, it applies only to B-form DNA with a particular force field, and involves some rather arbitrary elements (concerning phosphate charges, and which waters to include). The author’s argument that it could be used for “exhaustive” conformational searches does not seem very convincing to me: if no significant sequence-dependent effects were to be found, it would be of little interest, and if there were interesting structure variations, I find it hard to believe that many readers would trust the model used here, and calculations would need to be re-done anyway with more complete representations of the solvent and counterion environment. Given that the basic ideas have already been reported (ref. 6), I would lean against publication of the manuscript in its present form, which is largely devoted to comparisons to other vacuum-like models whose limitations are already widely appreciated.
REFERENCES
- [1] Cornell, W. D.; Cieplak, P.; Bayly, C. I.; Gould, I. R.; Merz, K. M.; Ferguson, D. M.; Spellmeyer, D. C.; Fox, T.; Caldwell, J. W.; Kollman, P. A. J. Am. Chem. Soc. 1995, 117, 5179.
- [2] MacKerell, A. D., Jr; Wiórkiewicz-Kuczera, J.; Karplus, M. J. Am. Chem. Soc. 1995, 117, 11946.
- [3] Darden, T.; York, D.; Pedersen, L. J. Chem. Phys. 1993, 98, 10089.
- [4] Ravishanker, G.; Auffinger, P.; Langley, D. R.; Jayaram, B.; Young, M. A.; Beveridge, D. L. in Reviews in Computational Chemistry; Lipkowitz, K. B.; Boyd, D. B., Ed.; VCH Publishers: New York, 1997; pp. 317–372.
- [5] Auffinger, P.; Westhof, E. Curr. Opin. Struct. Biol. 1998, 8, 227.
- [6] Mazur, A. K. J. Am. Chem. Soc. 1998, 120, 10928.
- [7] Mazur, A. K.; Abagyan, R. A. J. Biomol. Struct. Dyn. 1989, 6, 815.
- [8] Jain, A.; Vaidehi, N.; Rodriguez, G. J. Comput. Phys. 1993, 106, 258.
- [9] Mazur, A. K. J. Comput. Chem. 1997, 18, 1354.
- [10] Mazur, A. K., Preprint, xxx.lanl.gov/abs/physics/9808011.
- [11] Mazur, A. K., J. Chem. Phys., in press.
- [12] Drew, H. R.; Wing, R.; Takano, T.; Broka, C.; Tanaka, S.; Itakura, K.; Dickerson, R. E. Proc. Natl. Acad. USA 1981, 78, 2179.
- [13] Levitt, M. Cold Spring Harb. Symp. Quant. Biol. 47 1983, 47, 251.
- [14] Rao, S. N.; Kollman, P. Biopolymers 1990, 29, 517.
- [15] Srinvasan, J.; Withka, J. M.; Beveridge, D. L. Biophys. J. 1990, 58, 533.
- [16] Swaminathan, S.; Ravishanker, G.; Beveridge, D. L. J. Am. Chem. Soc. 1991, 113, 5027.
- [17] Miaskiewicz, K.; Osman, R.; Weinstein, H. J. Am. Chem. Soc. 1993, 115, 1526.
- [18] Kumar, S.; Duan, Y.; Kollman, P. A.; Rosenberg, J. M. J. Biomol. Struct. Dyn. 1994, 12, 487.
- [19] McConnell, K. J.; Nirmala, R.; Young, M. A.; Ravishanker, G.; Beveridge, D. L. J. Am. Chem. Soc. 1994, 116, 4461.
- [20] York, D. M.; Yang, W.; Lee, H.; Darden, T.; Pedersen, L. G. J. Am. Chem. Soc. 1995, 117, 5001.
- [21] Yang, L.; Pettitt, B. M. J. Phys. Chem. B 1996, 100, 2564.
- [22] MacKerell, A. D., Jr J. Phys Chem. B 1997, 101, 646.
- [23] Duan, Y.; Wlkosz, P.; Crowley, M.; Rosenberg, J. M. J. Mol. Biol. 1997, 272, 552.
- [24] Young, M. A.; Ravishanker, G.; Beveridge, D. L. Biophys. J. 1997, 73, 2313.
- [25] Young, M. A.; Jayaram, B.; Beveridge, D. L. J. Am. Chem. Soc. 1989, 119, 59.
- [26] Cieplak, P.; Cheatham, T. E., III; Kollman, P. A. J. Am. Chem. Soc. 1997, 119, 6722.
- [27] Sprous, D.; Young, M. A.; Beveridge, D. L. J. Phys. Chem. B 1998, 102, 4658.
- [28] Jayaram, B.; Sprous, D.; Young, M. A.; Beveridge, D. L. J. Am. Chem. Soc. 1998, 120, 10629.
- [29] Winger, R. H.; Liedl, K. R.; Rüdisser, S.; Pichler, A.; Hallbrucker, A.; Mayer, E. J. Phys. Chem. B 1998, 102, 8934.
- [30] Jorgensen, W. L.; Chandreskhar, J.; Madura, J. D.; Impey, R. W.; Klein, M. L. J. Chem. Phys 1991, 79, 926.
- [31] Tidor, B.; Irikura, K. K.; Brooks, B. R.; Karplus, M. J. Biomol. Struct. Dyn. 1983, 1, 231.
- [32] Mazur, J.; Jernigan, R. L. Biopolymers 1991, 31, 1615.
- [33] Lavery, R.; Zakrzewska, K.; Sklenar, H. Comput. Phys. Commun. 1995, 91, 135.
- [34] Berendsen, H. J. C.; Postma, J. P. M.; van Gunsteren, W. F.; DiNola, A.; Haak, J. R. J. Chem. Phys. 1984, 81, 3684.
- [35] Arnott, S.; Hukins, D. W. L. Biochem. Biophys. Res. Communs. 1972, 47, 1504.
- [36] McClarin, J. A.; Frederick, C. A.; Wang, B.-S.; Greene, P.; Boyer, H. W.; Grable, J.; Rosenberg, J. M. Science 1986, 234, 1526.
- [37] Berman, H. M.; Olson, W. K.; Beveridge, D. L.; Westbrook, J.; Gelbin, A.; Demeny, T.; Hsieh, S. H.; Srinivasan, A. R.; Schneider, B. Biophys J. 1992, 63, 751.
- [38] Bernstein, F. C.; Koetzle, T. F.; Williams, G. J. B.; Meyer, E. F.; Brice, M. D.; Rodgers, J. R.; Kennard, O.; Shimanouchi, T.; Tasumi, M. J. Mol. Biol 1977, 112, 535.
- [39] Pearlman, D. A.; Case, D. A.; Caldwell, J. C.; Ross, W. S.; Cheatham, T. E., III; Ferguson, D. M.; Seibel, G. L.; Singh, U. C.; Weiner, P. K.; Kollman, P. A. AMBER 4.1; University of California: San Francisco, CA, 1995.
- [40] Mazur, A. K. J. Comput. Phys. 1997, 136, 354.
- [41] Mazur, A. K. J. Phys. Chem. B 1998, 102, 473.
- [42] Lavery, R.; Sklenar, H. J. Biomol. Struct. Dyn. 1988, 6, 63.
- [43] Ravishanker, G.; Swaminathan, S.; Beveridge, D. L.; Lavery, R.; Sklenar, H. J. Biomol. Struct. Dyn. 1989, 6, 669.
- [44] Tuffery, P. J. Mol. Graph. 1995, 13, 67.
- [45] Stofer, E.; Lavery, R. Biopolymers 1994, 34, 337.
- [46] Kopka, M. L.; Fratini, A. V.; Drew, H. R.; Dickerson, R. E. J. Mol. Biol. 1983, 163, 129.
- [47] Coll, M.; Frederick, C. A.; Wang, A. H.-J.; Rich, A. Proc. Natl. Acad. Sci. USA 1987, 84, 8385.
- [48] Lavery, R. Adv. Comput. Biol. 1994, 1, 69.
- [49] Lin, D.; Matsumoto, A.; Gō, N. J. Chem. Phys 1997, 107, 3684.
- [50] Dickerson, R. E.; Drew, H. R.; Conner, B. N.; Wing, R. M.; Fratini, A. V.; Kopka, M. L. Science 1982, 216, 475.
- [51] Edwards, K. J.; Brown, D. G.; Spink, N.; Skelly, J. V.; Neidle, S. J. Mol. Biol. 1992, 226, 1161.
- [52] Dickerson, R. E. Methods Enzymol. 1992, 211, 67.
- [53] Drew, H. R.; Dickerson, R. E. J. Mol. Biol. 1981, 151, 535.
- [54] Flatters, D.; Zakrzewska, K.; Lavery, R. J. Comput. Chem. 1997, 18, 1043.
- [55] Diekmann, S.; McLaughlin, L. W. J. Mol. Biol. 1988, 202, 823.
- [56] Diekmann, S. in Nucleic Acids and Molecular Biology, Vol. 1; Eckstein, F.; Lilley, D. M. J., Ed.; Springer-Veralg: Berlin Heidelberg, 1987; pp. 138–156.
- [57] Hagerman, P. J. Ann. Rev. Biophys. Biophys. Chem. 1988, 17, 265.
- [58] Berman, H. M. Biopolymers 1997, 44, 23.