Monitoring the Stability of the ALEPH Vertex Detector
Abstract
The ALEPH Silicon Vertex Detector features an optical fibre laser system to monitor its mechanical stability. The operating principle and the general performance of the laser system are described. The experience obtained during 1997 and 1998 operations confirms the important role that such a system can have with respect to the detector alignment requirements. In particular, the laser system has been used to monitor short-term temperature-related effects and long-term movements. These results and a description of the laser-based alignment correction applied to the 1998 data are presented.
1 Introduction
The ALEPH Silicon Vertex Detector (VDET) has an active length of 40 cm and consists of two concentric cylindrical layers of 144 micro-strip silicon detectors of with double-sided readout. Six of them are glued together and instrumented with readout electronics on each end to form the VDET elementary unit (face). The inner layer ( radius) is formed by 9 faces, the outer layer ( radius) consists of 15 faces. Strips on -side run parallel to axis in the ALEPH reference system, allowing coordinates measurement; -side strips, running normal to axis, allow coordinate measurement. A detailed description of VDET can be found elsewhere [1].
2 Laser system
VDET features a laser system to monitor mechanical stability with respect to the external tracking devices. A large movement () of the VDET during data-taking could degrade significantly the -tagging performance. It is thus very important to keep this aspect under strict control. This is especially true at LEP2, where the detector alignment is performed on an initial sample of Z events and monitoring using the high energy data itself is difficult due to the reduced event rates.
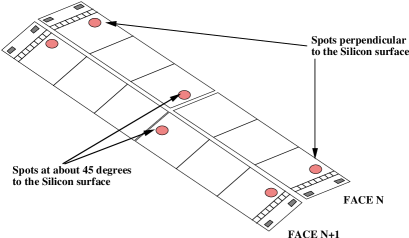
The system uses infrared light () from two pulsed laser diodes with an output power of each and a pulse length of . The light is distributed via optical fibres to prisms and lenses attached to the inner wall of the Inner Tracking Chamber (ITC, the closest outer detector). The lenses focus 44 light spots on 14 of the 15 VDET outer faces111One face is not equipped because the mechanical structure nearby does not allow the optic installation., normally 3 spots per face, two spots close to the ends of the face and one spot about in the middle of the face. All laser beams are nominally parallel to the plane; laser beams at the VDET ends are normal to the silicon surface while laser beams that point to the central wafers have an azimuthal incident angle close to 45 degrees, in order to be sensitive to movements normal to the face plane. Information on the VDET displacements with respect to the ITC are obtained by monitoring the laser beam impact position on the silicon wafers (laser spot) versus time: the spot position is sensitive only to displacements in the plane and the spot position is sensitive only to displacements along the direction. An section of the VDET indicating the nominal laser beam positions is shown in Fig. 1. In Fig. 2 a sketch of the typical laser spot positions on a face is shown.

For a detailed description of the VDET laser system see [2].
The laser system operates during standard data taking: the laser trigger, synchronized with the beam-crossing signal, is fired once per minute (approximately once per physics events) and the laser event is acquired as a standard physics event. After the installation 5 spots out of 44 spots were absent, probably due to misalignment of the optics or breakage of the optical fibre. For the remaining spots, the efficiency is essentially 100% due to the large pulse height of a spot cluster. During 1997 (1998) () laser events were collected.
3 Analysis of displacements
Each laser spot position is reconstructed event-by-event using a standard centre-of-gravity algorithm. A deviation, , is defined for each event and for each spot as the difference between the actual spot position and a nominal position.
The raw deviation for a typical spot as a function of time shows various features: a long term effect (Fig. 3 (a)), a medium term effect, present after quite long shutdown periods (Fig. 3 (b)), and a short term effect with a timescale of a few hours (Fig. 3 (c)).

3.1 Short and Medium Term Effects
The and deviations of the three spots of a face are plotted in Fig. 4 (a) and (b) for a four day period after a long shutdown. Also shown is a time chart of the VDET temperature over the same period (Fig. 4 (c)). The side shows clear short and medium term effects correlated with the temperature variations. In order to reduce the probability of radiation damage, VDET is completely ON only when LEP is in “stable beams”. The central spot, which is at and therefore sensitive to radial motion, shows the biggest deviation and is consistent with the expected face bowing due to the bimetallic effect (the face has a kevlar and carbon fibre beam glued on the silicon to ensure mechanical rigidity).

The medium term effect is visible in Fig. 4 (a) for the deviation of the central spot. It seems that “equilibrium” is only reached after about two days after a long shutdown. This medium term effect is also thought to be due to the face bowing. During standard running, OFF periods are short ( hours) and recovery from thermal expansion is partial; during long shutdowns (more than day) the recovery is complete and after that a certain time is needed to reach again the normal warming-cooling cycle.
The maximum bowing sagitta and the time constant involved in these temperature related phenomena can be estimated by fitting the following parametrisation over the 45∘ spot deviation versus time :
| (1) |
The fits have been done over a typical ON period just after a long shutdown (with ) and over a standard ON period far from a long shutdown (with free ). Depending on the face, the sagitta ranges from to with a mean of and the time constant varies from to 280 min with a mean of 160 min. For the tracking performance the short term displacements are small enough to be neglected, especially as they mainly affect the radial direction.
For the short term case the width of the residual distribution of data points with respect to the parametrisation in Eq. 1 is an estimate of the spatial resolution for a single event. Thanks to the large pulse height and the fact the cluster extends over more than one readout strip, the resolution is typically to .
3.2 Long-term Effects
The long term effect is visible in Fig. 5, where the spot deviations with respect to initial values are plotted versus time for the entire 1998 data taking period. Some spots are not displayed because they are missing or are not used in the analysis due to inadequate pulse height or unusual cluster profile. The side deviations show a systematic long term drift that depends on face number (see Fig. 7 for face numbering convention). The size of the displacements are as large as and are larger than the single hit resolution on a charged track (). On the contrary, the side deviations are smaller and quite similar.
During 1997 and 1998 this unexpected behaviour has been studied, parametrised and an alignment correction has been implemented.


The laser spots do not provide enough information to fully reconstruct the displacements of each individual face, nevertheless the observed deviations do not seem to be due to an independent motion of the faces. The observed long term deviations are thus parametrised assuming that VDET is moving as a rigid body with respect to the initial position, given by the alignment procedure with tracks performed at the beginning of data taking in a run at the resonance. The deviation of a spot is expressed as a function of the standard parameters used to describe the motion of rigid bodies, consisting of 3 angles and 3 translation vectors. These are then extracted by a fit procedure that minimises the squared differences between the observed and the predicted deviation of the spots.
The fit has been performed, with 3 out of the 6 parameters fixed to zero: the two rotation angles about the and axes, having found negligible displacement in and planes, and the translation along because the observed displacement is more consistent with a deformation rather than a global displacement. The result is shown in Fig. 6, where the three free parameters ( translation, translation and rotation) are plotted versus time starting from the initial run. A pictorial view of the corresponding VDET displacement is shown in Fig. 7; it is consistent with a rotation around the bottom face.
For the fit, the deviations have been averaged over a period of two days. The errors on the parameters are estimated “a posteriori” by forcing the to be equal to the number of degrees of freedom; the resulting uncertainty on the single spot deviation is plotted in Fig. 8 versus time. Although the single spot spatial resolution is better than that given in Fig. 8, the rigid body assumption does not take into account possible structural deformations, misalignment of the fibres or independent motion of the faces.
The time dependent motion of the VDET extracted from the laser system has also been independently confirmed using charged tracks in data acquired at high energy and also during a run at the resonance taken at the end of the 1998 data taking. To cope with the low statistics during the high energy running, the alignments were performed averaging over a month period. The values for the alignment parameters so obtained are also plotted in Fig. 6 and are generally in good agreement. In the translation, the alignment points are shifted with respect to laser points from about day 60. This is correlated with a beam loss into the Time Projection Chamber field cage that caused a measurable (10) relative displacement of the TPC with respect to the ITC. This emphasises that the alignment obtained directly from the data is also sensitive to any time dependence of the alignment of the other tracking chambers.
Based on the alignment parameters extracted from the laser system, a time dependent correction to the initial alignment has been applied to all the 1998 data. Fig. 9 shows the distribution of the sum of the impact parameters of the two muons in dimuon events before and after applying the alignment correction. Without the correction the mean of the distribution is shifted by , when the correction is applied the distribution is centered close to zero as expected.

The observed rotation of the VDET may be explained as follows: the VDET is supported by two “feet” which slot into two long metal rails located at the top and bottom of the ITC cylinder. It seems that the VDET is rotating around the lower foot (small cross in Fig. 7). Although the lower foot is rigid (made of metal), the upper foot had to be “springy” (made of plastic) in order to allow for distance variations between the top and bottom rails as the VDET slides along the rails during the installation process. It is thought that the plastic foot suffers some small deformation.

4 Conclusions
The laser based alignment system for the ALEPH vertex detector is operational. It allows reliable and high precision monitoring of the VDET position during data taking. It has allowed the study of small temperature related motions and revealed a long term rotation of the VDET. An alignment correction based on the information from this system has been successfully applied.
References
- [1] E. Focardi et al., Nucl. Instrum. Methods A 386 (1997) 18.
- [2] A.Wagner, H.Dietl, The Laser Calibration System for VDETII, ALEPH 97-006 (1997).