Studies of 100 m-thick silicon strip detector with analog VLSI readout
Abstract
We evaluate the performances of a 100 m-thick silicon strip detector (SSD) with a 300 MeV proton beam and a 90Sr -ray source. Signals from the SSD have been read out using a VLSI chip. Common-mode noise, signal separation efficiency and energy resolution are compared with those for the SSD’s with a thickness of 300 m and 500 m. Energy resolution for minimum ionizing particles (MIP’s) is improved by fitting the non-constant component in a common-mode noise with a linear function.
, , , , , , , , and ††thanks: Corresponding author. e-mail hotta@rcnp.osaka-u.ac.jp ††thanks: Present Address: Jefferson Laboratory, Newport News, VA 23606, USA
1 Introduction
A silicon strip detector (SSD) has the highest position resolution among the electric tracking devices in particle physics experiments. However, an error in measuring the track angle is dominated by the multiple scattering effect for particles with a low velocity. If the effect is reduced with a very thin SSD, new experiments which are impossible by the present technology will be realized. One example is a search for the violation in the decay of B mesons [1], in which the -violating transverse polarization in the decay will be measured to a precision of 10-2. In order to obtain the polarization the decay vertices of B and must be measured separately. A simulation shows that the experiment will be feasible only with very thin SSD’s at asymmetric-energy B factories.
In general, a thin SSD has a small signal-to-noise (S/N) ratio because the energy deposit in the detector is proportional to the thickness and its large capacitance results in a large noise. Thus careful treatment of a noise in the off-line analysis is important.
In this paper, we evaluate the performances of a 100 m-thick silicon strip detector. The performances are compared with those of the 300 m and 500 m-thick silicon strip detectors.
2 Detector
Single-sided silicon detectors with the dimensions of 1 cm 1.3 cm have been fabricated by Hamamatsu Photonics. The strip pitch is 100 m. The widths of implantation strips and aluminum electrodes are 42 m and 34 m, respectively. Three detectors with different thicknesses (100 m, 300 m, and 500 m) were tested. The 100 m-thick SSD was made by etching a 300 m-thick wafer. The analog VLSI chips (VA2111Produced by Integrated Detector and Electronics AS (IDEAS), Oslo, Norway.) [2] are used as a readout circuit of the detectors. An SSD and a VLSI chip were mounted on a printed circuit board called “hybrid board”.
3 Experiment
Two different particles were used for evaluation of the detector performances. A proton beam was used to measure the response of detectors for baryons or heavy particles. To see the response for light and high velocity particles which satisfy the minimum ionizing particle (MIP) condition (), electrons from a -ray source was used.
The experiment was carried out with a proton beam at the Research Center for Nuclear Physics, Osaka University. Scattered protons from a target were momentum analyzed by a magnetic spectrometer. A detector system that consists of an SSD and two trigger plastic scintillation counters was placed at the focal plane of the spectrometer. The momentum of detected protons was 800 MeV/ with the momentum spread of . The energy loss for a proton with 800 MeV/ is 68 keV for the 100 m-thick SSD, which is about 1.7 times larger than that for the minimum ionizing protons.
The readout system is schematically shown in Fig. 1.
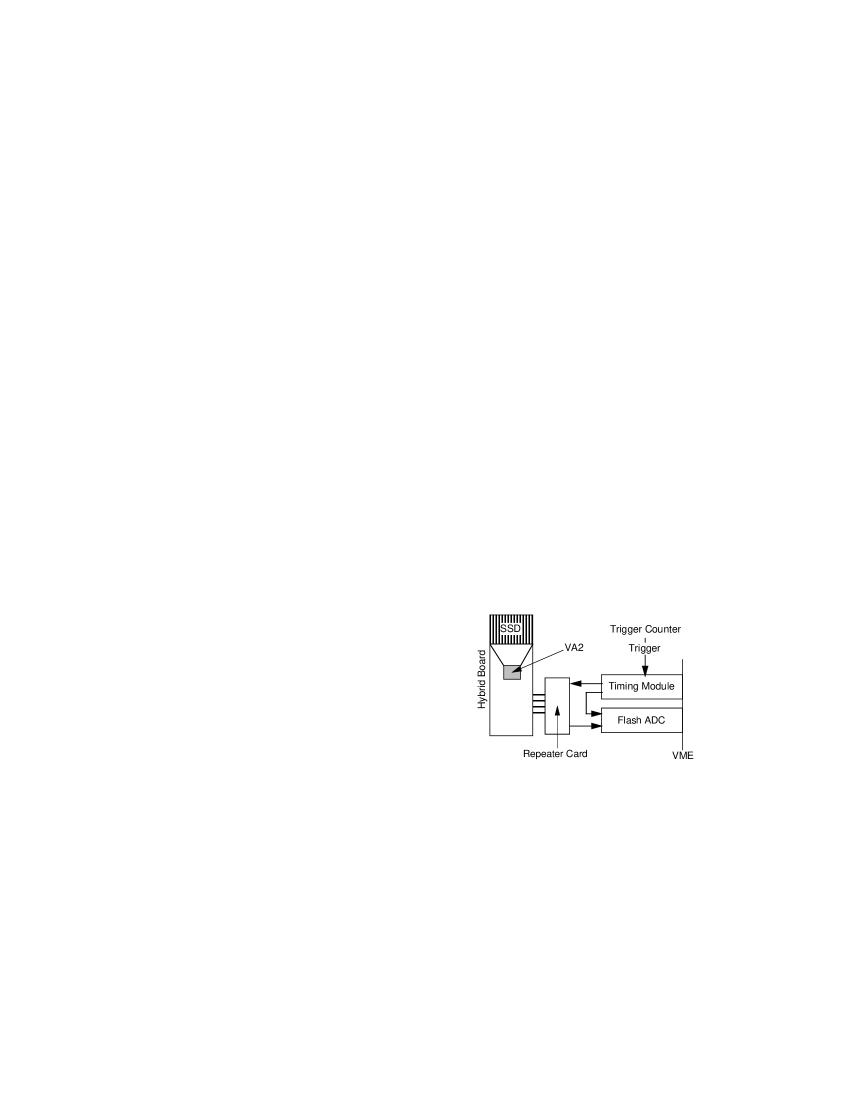
The hybrid board consisting of a silicon strip and a VA2 chip was connected to a “repeater card”, which contained level converters for logic signals, buffer amplifier for analog output signal, and adjustable bias supply for the VA2 chip. The VA2 chip was controlled by a VME based timing board which received a trigger signal and generated clock pulses for VA2 and a VME based flash ADC board. Analog multiplexed output from VA2 was sent to a flash ADC through the repeater card. Two layers of trigger counters were placed in front of the SSD. The repeater card was connected to the hybrid board with a ribbon cable for both the analog and logic signals. The length of the ribbon cable was about 15 cm.
In order to compare the characteristics of silicon strip detectors, the operation parameters of the VA2 readout chips were fixed to standard values without optimization for each measurement. Signal shaping time was about 700 ns. Signals were read out in 4 sec clock repetition. Typical trigger rate was about 30 Hz.
In addition to a proton beam test, measurements with a -ray source were also performed. The -ray source was placed at 15 mm from the SSD. A collimator with a size of 2 mm in diameter and 10 mm in thickness was used to irradiate electrons perpendicularly to the SSD. In order to realize the minimum ionizing condition, a high energy component of -rays was selected by a trigger scintillation counter placed behind the SSD. Operation parameters of the VA2 chip was the same as those at the proton beam test. Readout clock was 400 ns. The trigger rate at the -ray source test was about 7 Hz.
4 Analysis and Results
An output from each strip has a different offset level. These differences have been trimmed at the first step of the off-line analysis. Solid lines in Fig. 2 show the maximum pulse height distributions after the pedestal trimming for 100 m, 300 m, and 500 m-thick SSD’s at the proton beam test.

Note that we have neglected the effect of charge division among adjacent strip. Dotted lines show the same distributions under the condition that no charged particle hit the detector. The noise peak and proton signal peak have overlapped for the 100 m-thick SSD, while the proton signals are clearly distinguished from noises for the 500 m and 300 m-thick SSD’s.
For 100 m-thick SSD, a strong noise level correlation between non-adjacent channels has been observed. This indicates that the main component of the noise has a common phase and amplitude among the strips. This component called common-mode noise (CMN) has been calculated as an averaged pulse height over all strips. In the calculation, channels with significantly large pulse heights; larger than 3 standard deviation of the noise distribution, have been excluded. Fig. 3 shows the maximum pulse height distribution after the CMN subtraction for the 100 m SSD.

Proton events are clearly separated from the noise.
We have investigated the characteristics of noise more carefully. Fig. 4(a) shows the strip dependence of the noise width after the CMN subtraction. The width depends on the strip number, whereas pulse height differences between adjacent two strips shown in Fig. 4(b) have a constant value of about 6.
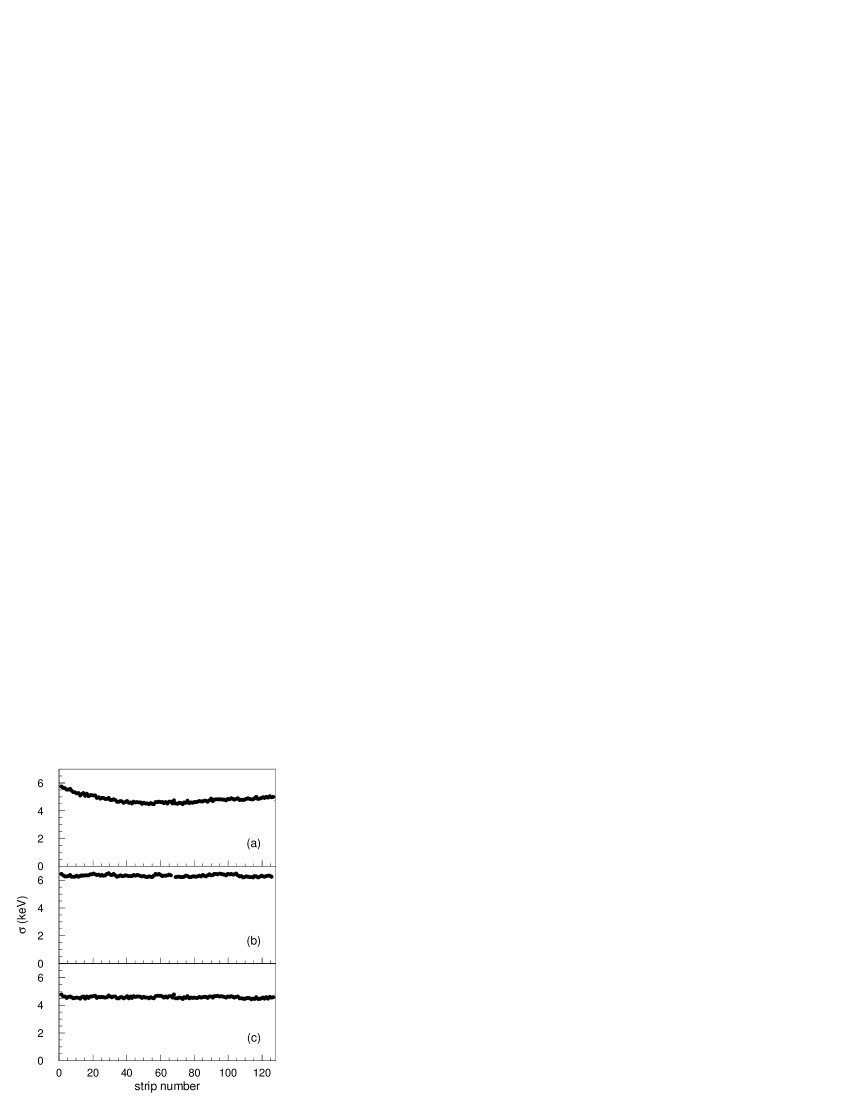
This indicates that the intrinsic of the noise is expected to be about 4.2 () for all strips. Thus, we conclude that the CMN has a non-constant component. Instead of simply averaging the pulse heights, we fit them with a linear curve to get CMN as a function of a channel number. Fig. 4(c) shows the noise widths after this method is applied. The widths are about 4.2 for all strips as expected.
If the CMN is not removed correctly by assuming a constant CMN, a noise width depends on a strip number (Fig. 4(a)). This may cause a strip dependent S/N separation which are not desirable for any experiments. Fitting the CMN with a linear curve is particularly important for the detection of MIP’s with a thin SSD where the S/N ratio is small. The maximum pulse height distribution for electrons with 100 m-thick SSD after subtracting the CMN by linear-fitting is shown in Fig. 5(b) compared with that with a constant CMN subtraction (Fig. 5(a)). Although electron events are not separated from the noise for both cases, the separation of signals from noises is improved by the linear-fitting method222-rays were irradiated at the central strips by using a collimator. It is expected that this improvement is clearly seen for the strips near the edge of the detector..

Fig. 5 indicates that there is a finite probability of misidentifying a noise as a particle track by selecting the maximum pulse height. The detection efficiency and signal misidentification probability for electrons with 100 m-thick SSD are plotted as a function of threshold energies in Fig. 6.

When a threshold level is set to detect the electron with an efficiency more than 99% the probability of misidentification obtained by linear-fitting of CMN is 27% smaller compared to that by the constant CMN-subtraction method.
The S/N ratio obtained from -ray source tests for the 100 m and 300 m SSD’s are summarized in Table 1.
| SSD thickness | 100 m | 300 m |
|---|---|---|
| without CMN subtraction | 4.91 | 17.1 |
| constant CMN | 7.45 | 28.7 |
| linear-fitted CMN | 7.88 | 29.7 |
Better S/N ratio is obtained by fitting CMN with a linear curve. The S/N ratios obtained with the assumption of a constant CMN for both the 100 m and 300 m SSD’s are slightly worse. For a 300 m SSD, the difference of two methods in subtracting the CMN is not very important in an actual application because the S/N ratio is sufficiently large. Noise width obtained in the -ray source test and the proton beam test are summarized in Table 2 in energy unit (keV).
| SSD thickness | 100 m | 300 m | 500 m | |||
|---|---|---|---|---|---|---|
| no CMN subtraction | 7.34 | (27.7) | 6.27 | (4.77) | — | (3.27) |
| constant CMN | 4.83 | (4.18) | 3.73 | (3.58) | — | (2.89) |
| linear-fitted CMN | 4.57 | (4.14) | 3.60 | (3.56) | — | (2.84) |
The width of CMN at the -ray source test is different from that at the proton beam test. But the noise after the CMN subtraction is almost the same.
There remains a possibility to improve the S/N ratio by considering the charge division among adjacent strips during finding a particle trajectory. Performances of the prototype detector might be improved by optimizing its operating conditions.
5 Conclusion
An SSD with a thickness of 100 m was tested with 800 MeV/ protons and -rays from source. By using an analog VLSI chip for readout, we remove the CMN. Assuming that CMN is constant among all strips, proton signals are separated from noises for the 100 m, 300 m and 500 m-thick SSD’s after the CMN subtraction. We found that a non-constant component in CMN makes the energy resolution worse. For the 100 m SSD, the signal and noise separation was improved by fitting CMN with a linear curve at a -ray source test. We conclude that a 100 m SSD with analog VLSI readout can be used as a very thin tracking device in a future experiment. However, careful treatment of CMN is important for detecting MIP’s.
References
- [1] Y. Kuno, Chinese J. of Phys. 32(1994)1015.
- [2] O. Toker, S. Masciocchi, E. Nygård, A. Rudge and P. Weilhammer, Nucl. Instr. and Meth. A340(1994)572.