Interfacial Properties of Nonionic Micellar Agregates as a Function of Temperatures and Concentrations
Abstract
By means of density, dielectric spectroscopy and sound velocity measurements we perform a systematic study on the polyoxyethylene nonionic surfactant solutions as a function of temperature and concentration. Both density and sound velocity data, at about , coincide with the value obtained for pure water. Above this temperature the density is lower than the water density whereas below it is greater, the opposite happens for the compressibility. Combining results from these different techniques we tempt a very detailed description of the evolution of the micellar interfacial properties with temperature. It is well known that nonionic surfactant solutions dehydrate, growing temperature. Our results indicate that this process is associated with a continuous change in the polymer conformation and in the local density of the micellar interface.
1 Introduction
The thermodynamic properties of the polyoxyethylene nonionic amphiphile () water mixtures are characterised by a very delicate balance between competitive forces; small temperature variations can change the overall equilibrium condition of the solution [1]. These mixtures present a temperature dependence of the aggregate dimension [2], a lower consolutum temperature and a very flat coexisting region, various liquid crystal phases [3] . These properties often resemble each other for the different monomeric species using specific rescaling parameters ([2], [4]). Changes in the hydration state of the micellar aggregates are considered the driving mechanism for micellar growth [4] and phase separation, both in these surfactant solutions [6] as well as in pure -water mixtures [7]. Clearly the volume per monomer is directly related to the degree of hydration, i.e. different monomeric volumes stabilise different micellar shape and size distribution function. Since the oil core cannot easily change its density and it is hydrophobic, the variations of the degree of hydration and then of the monomeric volume are mainly due to the properties of the -water mixtures at the micellar interface. This point of view naturally divides the solution into three subregions: the oil core, with overall properties similar to an oil bulk phase, the interfacial EO-water mixture and the bulk water phase. The three regions are weighted by the relative volume fraction.
Experimental techniques which can contrast the three different regions of the amphiphilic solutions are useful to determine the thermodynamic properties of the interface as a function of temperature and surfactant concentration. To this end we utilised density measurements (oil bulk phase ; water bulk phase ; EO-water mixture ranging from and at ); sound velocity (oil bulk phase ; water bulk phase ; EO-water mixture ranging from and at ) and dielectric constant data (oil bulk phase ; water bulk phase ; EO-water mixture ranging from and at ). All these techniques are linear in the volume fraction of the relative three components, but related to different properties of EO-water phase. The density depends on the mass concentration at the interface; the dielectric costant on the local polarizability, related to the molecular connectivity of the EO-water solution; the sound velocity is related to the elastic properties of the interfacial mixture.
2 Material and Methods
The sample analyzed () was purchased from Nikko Chemicals and was diluted without further purification. The concentration of the different water solutions were stated by weighing. Density measurements were performed with PAAR Digital Density Meter DMA60 in combination with remote cell DMA 602, that can provide an accuracy up to , according to the oscillating sample tube method. The external cell was thermostated by Heto DBT 6 Thermostat and Heto CB8-30e Cooling Bath that guarantees a temperature stability within . A variable path-length cell was used for the ultrasonic measurements. The cell content is about of solution. Two matched 5 MHz fundamental crystals were used, along with a quartz delay line, in a pulsed-sound mode. The temperature of the sample was controlled by a water thermostat regulated within . The sound velocity (c) was obtained by acoustically overlapping pulses under variable-path conditions to coherent CW signals generated by a Matec Pulse Modulator equipment [8]. The measurements were performed, at 5 and 45 MHz, the accuracy of the absolute sound velocity data (at fixed frequency) is estimated to be over the whole frequency range.
3 Data Analysis
Some interesting indications are obtained from the density of the pure liquid surfactant. The results for , , and are
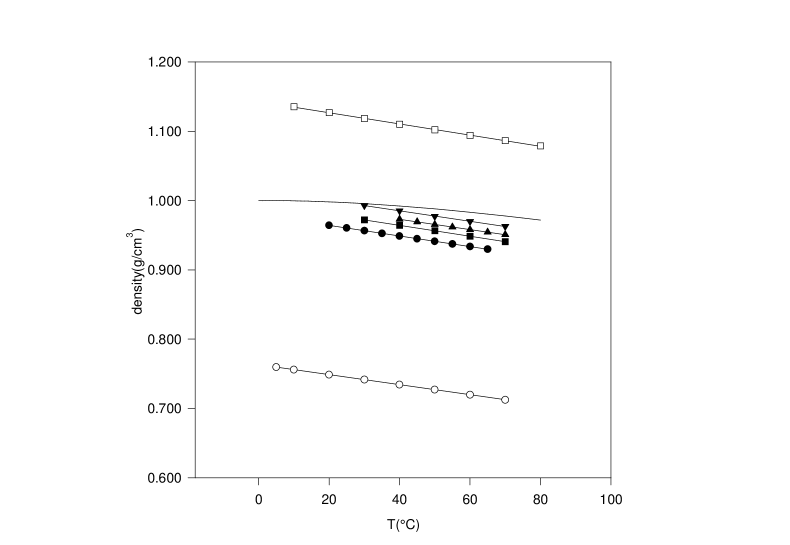
reported in figure 1, for comparison the pure PEO, the water and the bulk dodecane densities are reported too. The observed experimental values for the different are between the oil and the PEO density, is closer to the PEO density whereas has a lower density, closer to the data of the oil phase. The lines trough the data represent best fit obtained combining the density of the bulk phases, namely dodecane and EO polymers [9], weighted with the relative volume fraction:
| (1) |
The fitting parameters, namely the density of the EO phase and the one of the oil core, practically coincide with the experimental one observed in the two bulk phases. Besides, if at the density of we add ideally the contribution of n EO unit, i.e. in eq. 1 we change only the volume fraction since we add to the total volume and to the head group volume the contribution of n EO units, the experimental density of the is obtained.
Similar analysis can be applied on the adiabatic compressibility defined as [10]:
| (2) |
where is the density, the sound velocity, the pressure and the volume. In Fig. 2 are presented the results from pure with the one of the EO polymer and of the dodecane.
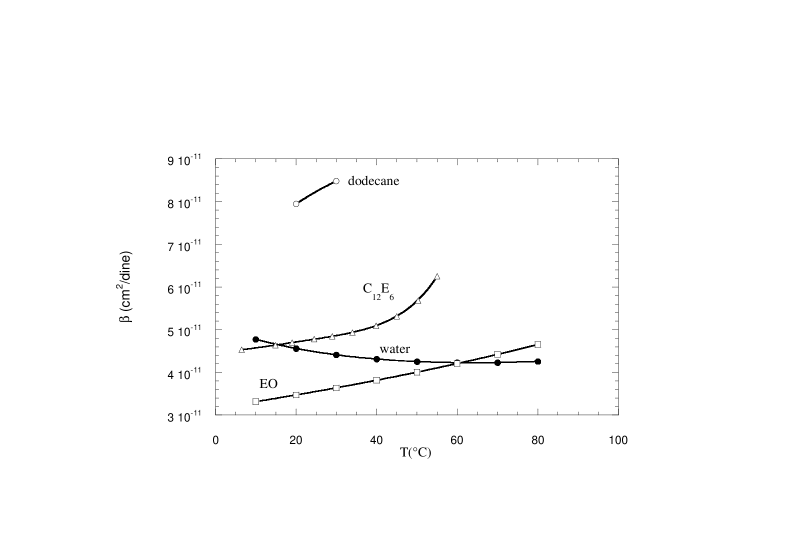
In this case too the compressibility of the pure surfactant can be written as a linear combination of the one of the polymeric phase and one of the oil phase; computing the derivative of eq. 1 the adiabatic compressibility of the pure surfactant results:
| (3) |
where the undersigned volume are the molar volume of the pure surfactant, of the oil phase and of the EO phase respectively. The fitting parameters give values with few percent variation from the one of the relative bulk phases of the EO polymer and dodecane ( and ). These results indicate that even at surfactant concentration still two segregate phases are present: the oil and the polymer. The oil phase is hydrophobic then it will not change composition by adding water. The EO-water interfacial region match the interaction of the oil phase with the bulk water, minimizing the osmotic contribution. Then in the analysis of the experimental results on the -water solutions, we consider the oil phases equivalent to a bulk dodecane phase at the same temperature. For what concerns the water phase we can use the bulk water properties at the same temperature if the -water solutions are diluted. Under this basis we attribute the variation of the properties of the solution to variation of the EO-water phase, for examples EO conformation, degree of hydration etc.
In Fig. 3 a schematic view of a cross section of a spherical or cylindrical micelle is reported.
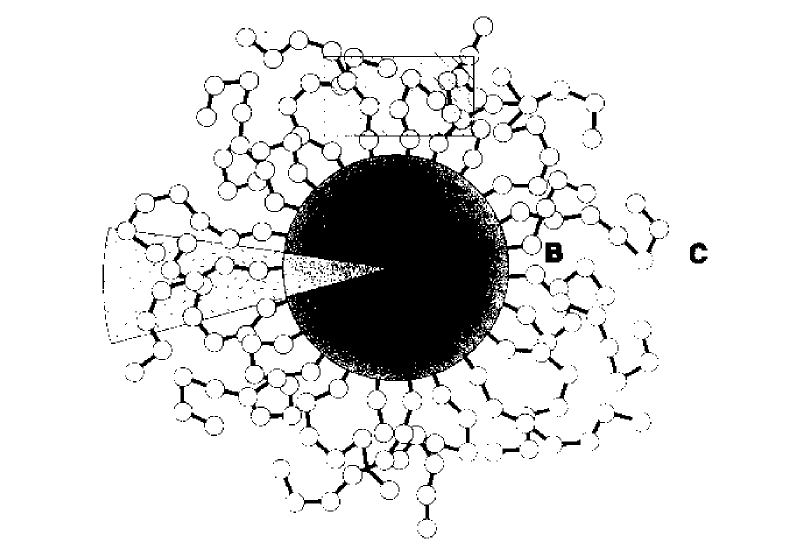
In our model of nonionic micellar solutions the oil core volume (A) is obtained from the bulk oil phase density. The partial molar volume of the bulk water (C) is known. On the other hand the interfacial volume of the head group termination (B) can greatly vary. Depending on the polymer conformation, the polymer molarity in the B region change and different ammount of water are needed to fill it up to the right density. All our experimental quantities depend linearly on the hydrated volume per monomer of the polymeric terminations at the micellar interface. No univocal indication can be obtained about this volume from other experiments. Then in our analysis we extract from the experimental results of -water solutions the interfacial density, adiabatic compressibility and dielectric constant as a function of the parameter and of the temperature. In particular for what concerns density we obtain the interfacial values starting from an equation for the solution density given by:
| (4) |
where , and , indicate the density and the volume fraction rispectively of the water and the surfactants. represents the density of the micelle and, if we define , and , the density and the volume fraction respectively of the interface and the oil core, we can write
| (5) |
Defining , and , the mass and the volume of respectively a water and a surfactant molecule, the number of surfactant molecules and the number of water molecule per polar head in the interface, then by definition we have:
| (6) |
| (7) |
Using these equations is given by:
| (8) |
To eliminate the dependence from the unknown variable, we use the condition for the interfacial density:
| (9) |
that finally give the following equation:
| (10) |
The last equation represents the density of the micellar interface parametrized on its volume .
For the adiabatic compressibility the previous model gives an equation
| (11) |
where is the mole fraction of the surfactant in solution, are the adiabatic compressibilities and the the relative molar volumes of the three components in the solution. , as before, represents the number of hydrated water molecules.
The iterative use of of mixtures equation for dielectric costant, first on the surfactant-water solutions, then on the micella treated as a two component solution (the oil phase and the EO-water phase), gives an expression for the interfacial dielectric constant that parametrically depend on the volume of the head region (see [11] for details).
4 Experimental results
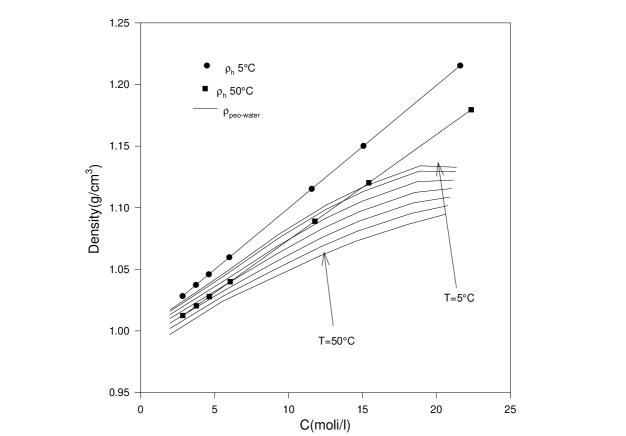
The density measurements are reported in Fig. 4 as a function of
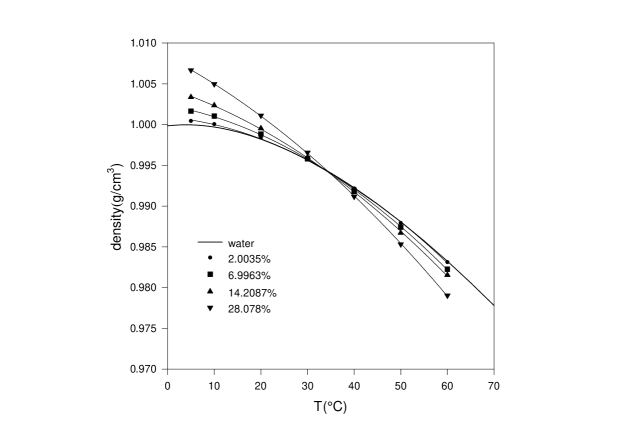
temperature for different concentrations, from 2 to 28 weight (). For comparison the water density and the pure surfactant density are reported too as a continuous lines. At low temperature the solution densities are higher than the water density whereas at high temperature are lower for all the measured concentrations. The crossing temperature is at about . Similar results are observed with the adiabatic compressibility
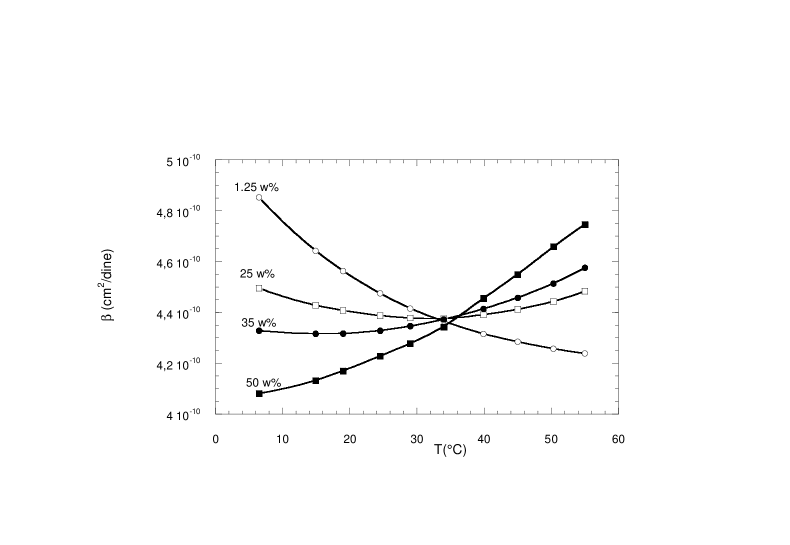
(see Fig. 5), there exist a crossing temperature, again at about , where the solution compressibility collapse at the same values for all the investigated concentrations (from 2 to 50 ). It is interesting to notice that there are no ideal combination of pure surfactant and pure water density or compressibility which can give the experimental -water values. It means that the interfacial region, composed by EO terminations and water molecules, strongly modulate the overall solution density and compressibility. The excess density and excess compressibility, with respect to an
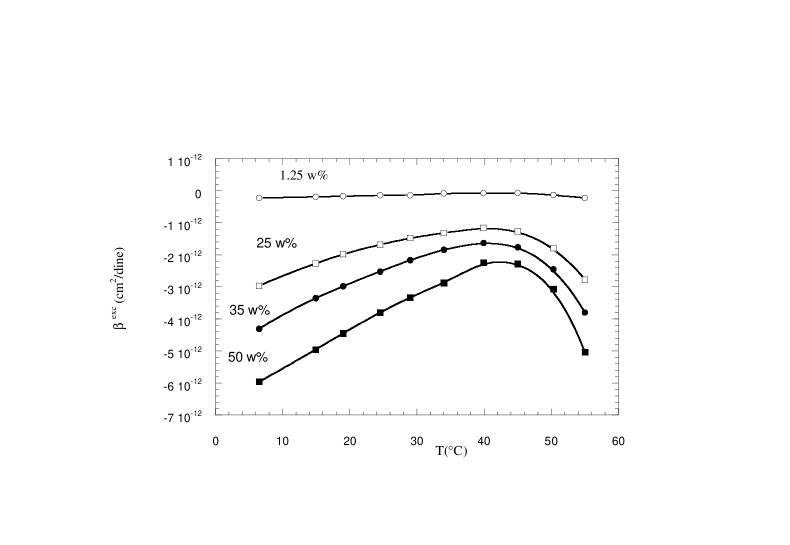
ideal solution of surfactant and water, are reported in Fig. 7 and Fig. 6 respectively. The density results concern dilute surfactant solution (2 ), in this case two different regimes can be observed above and below about . At this temperature is generally indicated the presence of the sphere to rod transition in -water solutions [12], from a theoretical point of view the area per polar head corrispondently strongly reduces [4]. Again this evidence supports the role of the interface in this shape transition. For compressibility the available concentrations are too high to present any sphere to rod transition [13].
5 Discussion and Conclusions
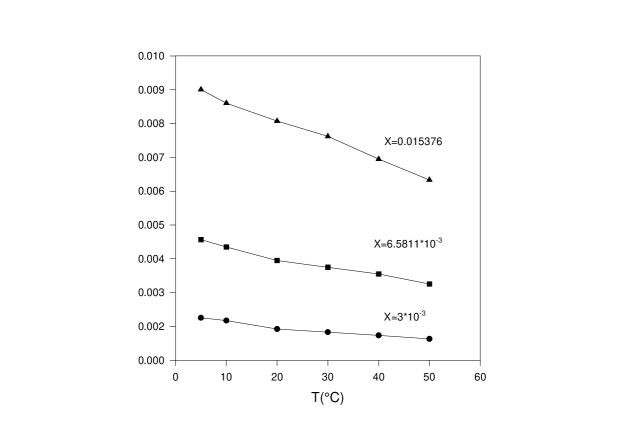
From density and compressibility it appears that the liquid phase of pure is characterized by two separated region: the oil and the EO phases; in this case the EO region exactly resemble the pure EO polymer liquid phase. Our results of density and compressibility at the micellar interface are parameterized with the interfacial volume, it means that we have a set of different value for the interfacial properties which depend on the local EO molarity. In a similar manner as in the pure surfactant case, we can compare the density dependence on the EO molarity at the micellar interface with the density of EO- water solutions as a function of the EO molar concentrations. The results are reported in Fig. 8. It is
evident that there could exist many solutions for the interface compatible with different conditions of the reference mixture, a priori all of them could be accepted. A similar procedure could not be performed in the case of compressibility since the quantities , i.e. the number of the hydrated water molecules per monomer, is not easily eliminated in eq. 11 as for density (see eq. 8 and 10). An independent determination of the volume has been obtained comparing the interfacial dielectric constant with the one of EO-water solutions. Since the dielectric constant is related to the local polarizability, which mainly depends on the degree of connectivity of the hydrogen bond network, then the obtained with this technique represent reliable value. Accordingly we used such values in order to fix from the density the number of hydrated water molecules. Using this number in the eq. 11 for the solution compressibility we can get explicit values for the interfacial compressibility. As a results we obtained values with are higher than those in EO-water solutions, and are very sensitive to the variation of the hydration number. It is interesting to notice that the coincidence of the and behavior as a function of temperature, i.e. the existence of a common temperature at which both the quantity are independent on concentration, could be indicative of a condition at which the second Virial coefficient reduce to zero. The shape change in nonionic micellar solution, from the sphere to rod, is evident on the excess density where two different regimes are present above and below the transition temperature. These two regimes, in our model, reflect two different conformation and degree of hydration of the micellar interface. The change of the interfacial properties with temperature is then a complex combination of change in the EO conformation and of the degree of hydration and cannot be reduced to excluded area per polar [4].
References
- [1] J. M. Corkill and J. F. Goodman, Adv. Colloid Interface Sci., 2 (1969) 297
- [2] B. Lindman and H. Vennerstr m, J. Phys. Chem., 95 (1991) 6053 (comment)
- [3] D. J. Mitchell, G. J.T. Tiddy, L. Waring, T. Bostock and M.P. McDonald, J. Chem. Soc. Faraday Trans.1, 79 (1983) 975.
- [4] S. Puvvada, D. Blankschtein, J. Chem. Phys., 92 (1990) 3710.
- [5] G. Kalstr m, J. Phys. Chem., 89 (1985) 4962
- [6] R. Kjellander, J. Chem. Soc. Faraday Trans., 2, 78 (1982) 2025
- [7] R. Kjellander and E. Florin, J. Chem. Soc. Faraday Trans., 1, 77 (1981) 2053
- [8] G. D’Arrigo and A. Paparelli, J. Chem. Phys. 88 (1988) 405
- [9] G. Maisano, D. Majolino, P. Migliardo, S. Venuto, F. Aliotta, S. Magazù, (1993) Mol. Phys 78, 421-432
- [10] see for example I. Prigogine and R. Defay, “Chemical Termodynamics”, Longman Greens ed.
- [11] G. Briganti and A. Bonincontro, Coll. and Surf. A, 103 (1995) 105
- [12] W. Brown and R. Rymden, J. Phys. Chem., 91 (1987) 3565
- [13] G. D’Arrigo and G. Briganti, Phys. Rev., E 58 ((1998) 713