Testrun results from prototype fiber detectors
for high rate particle tracking
Abstract
A fiber detector concept has been realized allowing to registrate particles within less than 100 nsec with a space point precision of about 100 m at low occupancy. Three full size prototypes have been build by different producers and tested at a 3 GeV electron beam at DESY. After 3 m of light guides 8 - 10 photoelectrons were registrated by multichannel photomultipliers providing an efficiency of more than 99 %. Using all available data a resolution of 86 m was measured.
,
,
,
,
,
,
,
***corresponding author, phone: +49 33762
77346, Fax: +49 33762 77330,
e-mail: nahnhaue@ifh.de
††thanks: on leave from IHEP Protvino, Russia
††thanks: now at Esser Networks GmbH, Berlin
††thanks: on leave from JINR Dubna
††thanks: Summerstudent from University of Clausthal Zellerfeld
††thanks: on leave from High Energy Physics Institute, Tbilisi State
University
1 Introduction
The advantageous use of fiber detectors for particle tracking has been demonstrated for very different conditions e.g. in the UA2-Experiment [1], CHORUS [2], for D0 [3] and the H1-Forward Proton Spectrometer [4]. Due to the different experimental situations in these applications three types of optoelectronic read out techniques are applied – Image Intensifiers plus CCD’s, Visible Light Photon Counters (VLPC) and Position Sensitive Photomultipliers (PSPM). However, all have in common that the precision of space point measurements is given by hits of overlapping fibers of several staggered fiber layers. For high rate experiments demanding online tracking of several hundred particles per 100 nsec bunch crossing such a concept may not work due to too high occupancy of single fiber channels.
We propose in the following to use overlapping fiber roads composed of several thin scintillating fibers read out with one clear optical fiber. The demands and the solutions presented below match to a possible application of the detector as the inner tracker in the HERA-B project at DESY [5]. Similar ideas have been used by others [6] to build a fiber detector for the DIRAC experiment at CERN.
2 Detector Principle
The fiber detector under discussion is aimed to detect throughgoing particles with more than 90 % efficiency within less than 100 nsec and a precision of better than 100 m. The fibers should not change their characteristics significantly after an irradiation of 1 – 2 Mrad. The sensitive detector part should have a size of about 25 x 25 cm2. The scintillating fibers should be coupled to clear optical fibers of about 3 m length guiding the light to photosensors placed outside the experimental area.
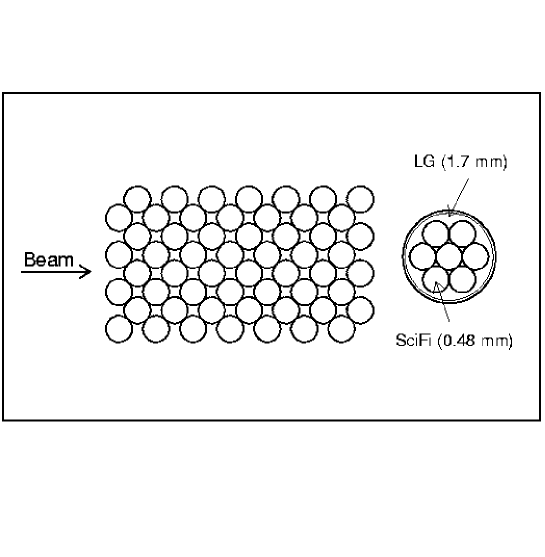
It is assumed that most particles of interest hit the detector perpendicular, i.e. with angles less than five degrees with respect to the beam axis. In this case low occupancy and high light yield are guaranteed by using overlapping fiber roads like schematically drawn in fig. 1. One fiber road consists of several thin scintillating fibers arranged precisely behind each other and coupled to one thick light guide fiber. The scintillating fiber diameter determines the space point resolution of the detector. The number of fibers per road is fixed by the scattering angle of particles and the allowed amount of multiple scattering. It will also influence the factor of background suppression for tracks with larger inclination or curvature. The pitch between fiber roads is defined by demanding a homogeneous amount of fiber material across the detector width.
Keeping in mind the conditions at HERA-B, the following choices are made:
| 480m | Nfib/road | 7 | |
| Lfib | 30 cm | proad | 340 m |
| 1.7 mm | Nroad | 640 | |
| Llg | 300 cm | Wdet | 217.6 mm |
with and L: diameter and length of scintillating and light guide fibers, Nfib/road: number of fibers per road, proad: distance between neighboured road centers, Nroad: number of roads per detector, Wdet: detector width.
The light guide fibers are read out with the new Hamamatsu111Hamamatsu Photonics K.K., Electron tube division, 314–5, Shimokanzo, Tokyooka Village. Iwatagun, Shizuoka–ken, Japan 64 channel PSPM R5900–M64 with a pixel size of 2 x 2 mm2 [7]. To diminish optical cross talk the thickness of the entrance window of the device was decreased to 0.8 mm.
The coupling between scintillating and light guide fibers is done by loose plastic connectors. The light guides are coupled to the PSPM using a plastic mask fitting the corresponding pixel pattern.
3 Material Studies
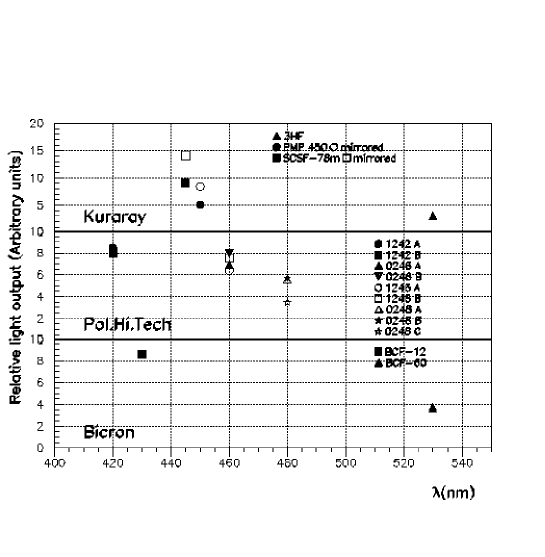
Double clad fibers of three different producers222BICRON, 12345 Kinsman Road, Newbury, Ohio, USA 333pol. hi. tech., s.r.l., S.P. Turanense, 67061 Carsoli(AQ), Italy 444KURARAY Co. LTD., Nikonbashi, Chuo-ku, Tokyo 103, Japan were tested concerning light output, light attenuation and radiation hardness for several fiber diameters and wavelengths of the emitted light. Details of these measurements are given in [8]. A few results are summarized below.
The light output of fibers of 500 m diameter is shown in fig. 2. Generally it can be seen, that the light yield decreases with increasing scintillator emission wavelength because the PM sensitivity curve is not unfolded. There is no remarkable difference between the best materials of the three producers. A mirror at the end of the fiber increases the light output by a factor 1.7.
Several tests were performed to couple scintillating and light guide fibers. Finally the coupling efficiency became better than 95 %, independent of the medium between both parts (air, glue, grease).
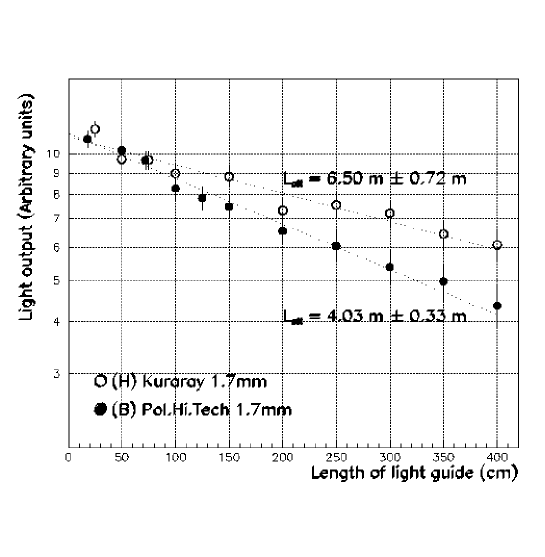
The light attenuation of clear fibers was measured coupling them to single scintillating fiber roads excited by a Ruthenium source. The clear fibers were cutted back to the length under investigation. Results for two producers are given in fig. 3.
Radiation hardness tests of fibers were made using an intense 70 MeV proton beam at the Hahn–Meitner–Institute Berlin. 1 Mrad radiation was deposited within a few minutes. For all materials investigated we observed a damage of the scintillator and the transparency of the fiber which was followed by a long time recovery of up to 600 h. An example is shown in fig. 4. More detailed studies using glued and nonglued fibers and irradiate them in air and nitrogen atmosphere are still ongoing.

Summarizing all results of our material studies we decided to use the KURARAY fibers SCSF-78M with a diameter of 480 m for the scintillating part of our detector prototypes. For clear fibers still two choices seem to be possible: 1.7 mm fibers from KURARAY or pol. hi. tech..
Similar investigations of the same materials have been done by our colleagues from Heidelberg University [9]. For their irradiation tests they used a Co60 source.
4 Detector Production
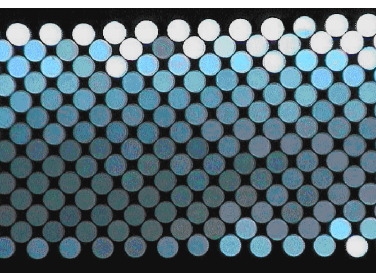
Using winding technology as developed for the CHORUS experiment [10] we built a detector production chain at our institute. A drum of 80 cm diameter allows to produce five detectors at once. The production time for winding one drum is about 14 h. Sticking the fibers to the connector holes was still done by hand and rather time consuming. A part of the polished endface of one of our detectors is shown in fig. 5.
Two other detector prototypes are ordered from industry. GMS–Berlin555GMS - Gesellschaft für Mess- und Systemtechnik mbH, Rudower Chaussee 5, 12489 Berlin, Germany followed a technology proposed by the university of Heidelberg [9] mounting single layers on top of each other using epoxy glue. Each layer is prepared on a v-grooved vacuum table. One layer per day can be produced in this case. The connector is here also added by hand. The production technology used by KURARAY is unknown to us.
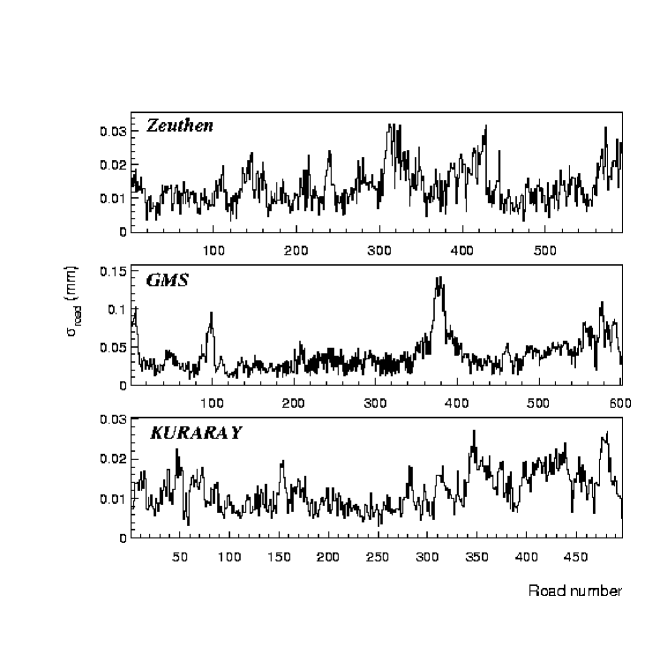
To get the precision of the detector geometry quantified we measured the coordinates of all fibers of the polished endface of the three detectors. In fig. 6 the deviation from the ideal position is given per fiber road. Some stronger local effects are visible. Averaging these results characteristic accuracies of 20 m, 50 m and 10 m are calculated for the Zeuthen, GMS and KURARAY detectors respectively.
5 Opto–Electronic Readout
The 640 channel scintillating fiber detectors are coupled via plastic connectors to ten 3 m long light guide cables of 64 clear fibers of 1.7 mm diameter. Each cable is coupled to a Hamamatsu 64 channel position sensitive photomultiplier R5900 - M64. The coupling is done using a plastic mask, fitting the anode pattern of the PSPM with mm2 pixel size. A detailed description of the photomultiplier is given by the producer in [11].
The pulse rise time of the PSPM under study is a few nanoseconds. Therefore the time behaviour of the fiber detector will be mainly restricted by the readout electronics. For a high rate experiment the signals have to be digitized and pipelined in an early stage. We will not treat this problem here instead we try to measure the total light amplitude as seen by the PSPM. For this purpose we used the readout boards originally developed for the L3 fiber detector [12]. Like in previous beam tests [13], [14] the serial output of these boards is digitized by a SIROCCO–II flash–ADC using a VME OS9 online data taking system with CAMAC interface.
We got the first prototypes of the PSPM just before the testrun started. Finally we used only one exemplar for the beam measurements. The corresponding light guide cable could be moved to all ten connector places across the detectors. Mechanical precision was guaranteed using precise pins and holes for each position. Using 20 nsec long light pulses of different intensity produced by a LED coupled to a fiber we made an extensive check of the behaviour of the PSPM in combination with our readout electronics. In the meantime five other exemplars of the photomultiplier have been studied with similar results.
In fig. 8 we show the amplitude distribution for one pixel illuminated with weak light signals. Beside a narrow pedestal a clear one photoelectron peak is seen. The gain of the PSPM comes out to be independent of the number of incoming photons up to more than 10 photoelectrons and linear in the high voltage range between 800 and 980 V. This allows to calibrate the light output measured in FADC-channels to the corresponding average number of photoelectrons. What has to be taken into account in addition in this case is the different sensitivity of the PSPM pixels. We measured it, putting the same amount of light to each channel and found a variation by about a factor of two.
The applicability of a PSPM for fiber detector readout is limited by its cross talk properties, i.e. the response of other pixels than the illuminated one to the incoming light signal. In case of the R5900-M64, Hamamatsu has decreased the cross talk already considerably by decreasing the thickness of the entrance window from 1.3 mm to 0.8 mm. Nevertheless the cross talk depends strongly on the threshold cut applied and is still about 10 % for a one photoelectron cut and typical light signals as can be seen from fig. 8. From the figure one observes also that most of the cross talk comes from the nearest neighbours of the directly illuminated pixel. Using an appropriate hit selection procedure this cross talk can be strongly suppressed. If for instance a local maximum selection is used it vanishes completely [13], [14].
Whereas the amount of cross talk depends only weakly on the PSPM high voltage, it is strongly correlated to the amount of incoming light to a pixel (see fig. 10). The diameter of the light guide fibers connected to the pixels starts to influence the cross talk behaviour above 1.5 mm.
Our fiber detector data taking in the testbeam has been synchronized with respect to data taking with a four plane Microstrip Detector Hodoscope (MSD). To increase the final data rate for the two systems with free running clocks a long trigger gate of 2 sec was chosen. As found later, that leads already to discharge effects for early PSPM signals. In fig. 10 the flash ADC response to a constant light signal arriving at different trigger times is shown. For our testrun data the arrival time of a trigger is unknown but uniform. Correspondingly we had to unfold all flash ADC spectra using the behaviour measured in fig. 10 to determine the correct average number of photoelectrons.


6 Testrun Setup
In a two weeks testrun in October 1997 the three available detector prototypes have been studied in the 3 GeV electron beamline T21 at DESY. More than 5*105 triggers have been recorded under several conditions in various runs. The setup is schematically drawn in fig. 11.
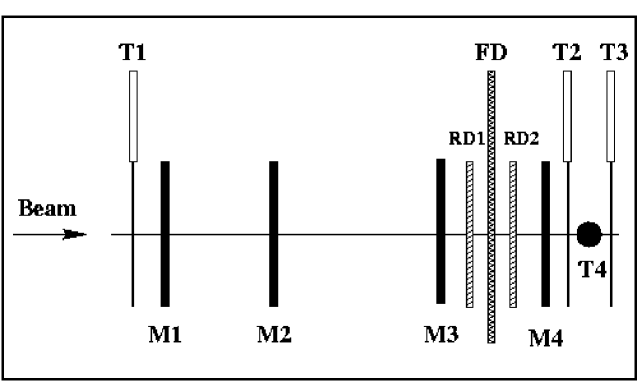
A trigger system of four scintillator paddles T1 - T4 selects by 4-fold coincidence a beam region of 2*2 cm2. The corresponding trigger rate was 50 kHz, leading to a final data acquisition rate of about 5 Hz.
Two fiber reference detectors RD1 and RD2 fixed to the same support as the MSD hodoscope paddles are used mainly to perform an independent alignment of these components. Each fiber reference detector is made out of two double layers of 32 fibers of 1 mm diameter. The total intrinsic resolution of the system is 72 m.
The MSD hodoscope consists of four paddles with 320 or 640 strips of 100 m pitch. The intrinsic resolution for one hit clusters is about 30 m.
The distribution of differences of coordinates measured by the fiber reference detector and the corresponding MSD paddle has been used to align the measuring system. Alignment errors of 58 m, 70 m, 13 m, and 10 m have been found for the paddles 1 to 4. The result reflects problems of the geometrical arrangement with respect to the beam divergence. The MSD prediction precision at the fiber detector position has been calculated from fits of four hit tracks to be 75 m.
The fiber detector FD is movable in x and y direction perpendicular to the beam. About 30 different positions have been used for measurements. The alignment of the fiber detector with respect to the MSD-coordinate system has been done separately for every position with a precision of about 10 m.
7 Results from Testrun Data
All testrun data have been sensitivity corrected corresponding to the correction table measured before for the PSPM operating with a high voltage of 980 V. A noise threshold of 35 FADC channels has been applied afterwards leaving 1 efficiency for a noise hit per beam trigger. The threshold to select events with more than one photoelectron seen is chosen to be 150 FADC channels at this high voltage with the one photoelectron peak observed at 100 FADC channels.
For the selection of hitted fiber roads in principle a simple cut excluding single photoelectron hits would be sufficient to reduce background from cross talk and other sources. Results can be improved, if a local maximum search is possible removing all nearby cross talk hits [13], [14]. In the following we will use both selection criteria in common.

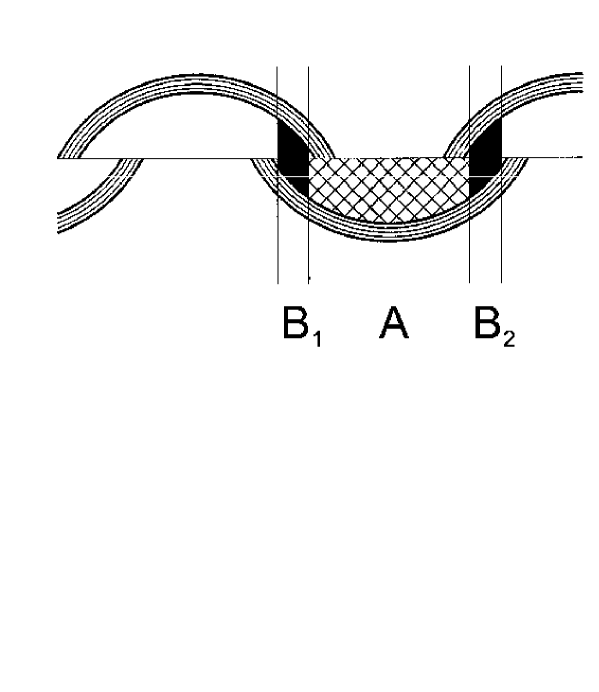
After selecting hits, a cluster algorithm combines neighbouring ones to a track cluster. As can be seen from fig. 12 from geometry one or two fiber roads could be hitted by a particle crossing perpendicular to the detector plane .
| detector | m | ||
|---|---|---|---|
| Zeuthen | 8.2 | 99.4 | 94 |
| GMS | 10.1 | 99.9 | 90 |
| KURARAY | 7.5 | 99.0 | 88 |
In figures 13 a-c the unfolded FADC spectra are shown for the detectors produced by Zeuthen, GMS and KURARAY respectively. Using the described calibration leads to an average number of photoelectrons between eight and ten and correspondingly efficiencies above 99 % if the one photoelectron cut is applied (see table 1). The larger values for the GMS detector seem to be due to the very good quality of the polished and mirrored detector endface.
As can be seen from fig. 14 the efficiency varies only weakly for different positions of the light guide cable, i.e. different fiber roads across the detector. The variation of the efficiency along the fibers is also marginal. However the distance between near and far measurements is only about 15 cm.

Expecting in principle only one incoming particle from beam triggers one observes in the data after the one photoelectron cut still 10 % of events with more than one track cluster in the fiber detector. A rough GEANT Monte Carlo simulation including only the detector material comes up with about 4 % additional hits produced by matter effects. These hits increase the number of two hit track clusters and lead to additional ”matter” tracks. 2 % of such tracks are observed. Fig. 15 shows the distance between tracks in multi-track events for data and Monte Carlo. Comparing both one can not exclude cross talk at the percent level. Possible sources are accidentals (noise), the PSPM glass window, fibers in the detector, connectors or light guide cables.

To calculate the intrinsic resolution of our fiber detector geometry one has to keep in mind again that the fiber roads have two regions A and B where one or two of them should give light signals for throughgoing particles (see fig. 12). With a fiber diameter of 480 m, a cladding thickness of 30 m and a pitch of 340 m values of 260 m and 80 m are derived for the widths of the regions A and B. Keeping in mind that the one photoelectron cut excludes low light signals one calculates the values given in table 2 for the width of the regions, the fraction of crossing particles and the corresponding resolution. Combining these numbers an overall intrinsic resolution of 69 m could be expected.
| region | width/m | fraction/ | /m | /m |
|---|---|---|---|---|
| A | 280 | 82 | 81 | 97 |
| B | 60 | 18 | 17 | 30 |
| A + B | 340 | 100 | 69 | 86 |
The difference between the coordinates of a crossing particle measured with the fiber detector and with the MSD hodoscope is distributed in fig. 16 for all data of all runs. A fit with two gaussian functions yields a resolution of m for the main component. Unfolding the MSD precision of 75 m a fiber detector resolution of 86 m is calculated, near to the theoretical expectation.

Separating events with one and two fiber roads hit allows to calculate the resolution for tracks crossing regions A and B. The values given in the last column of table 2 are also close to the theoretical estimates. Only the double road hit distribution needs two gaussian functions to be described reasonably. The second component with a large width is mainly due to matter effects like delta-electrons which lead to additional hits in neighbouring fibers.

The resolution has also been measured for different positions in different detectors (see fig. 17 and table 1). No remarkable variations were observed. The statistics and precision of measurements are not sufficient to establish local effects due to problems in mechanical detector production.
A few additional phenomena which may influence the tracking precision in an experiment have also been considered during the testrun. All prototypes have ”unordered” fiber regions of about 7cm near to the 640 channel connector. Throughgoing particles are registrated in this region with a precision of about 1 mm.
The 640 clear fibers of 1.7 mm diameter and 3 m length give a good possibility to produce Cerenkov light if crossed by charged particles. That depends strongly on the light guide arrangement: the largest effect can be expected near to the connector. Exposing this region to the electron beam, less than 1 % of crossing particles produced hits after applying the one photoelectron cut.
Particle showers from nearby material increase background and occupancy and decrease the detector resolution. A small effect of this kind may be seen already in fig. 17 comparing the values measured for the detector boundaries with those in the central region.
8 Summary
Three fiber detector prototypes have been tested. They are made out of 640 overlapping roads of seven 480 m fibers coupled to 1.7 mm diameter light guides of 3 m length readout with 64 channel photomultipliers.
For all three detectors an efficiency of about 99 % and a resolution better than 100 m have been measured in an exposure to a 3 GeV electron beam at DESY.
These results together with radiation hardness studies of the used fiber materials seem to make it possible to use a corresponding detector in a high rate experiment like HERA-B.
The readout of such a detector - connectors, light guides, mask arrangement, front end electronics - has to be adapted with care to the specific demands of the application.
Acknowledgement
Part of this work was done in close collaboration with groups from the universities of Heidelberg and Siegen. We want to thank our colleagues for their good cooperation and many fruitful discussions.
In particular we thank Prof. F.Eisele for providing the KURARAY detector, bought by Heidelberg University, for the beam tests.
The fiber irradiation tests were possible only due to the kind support of the Hahn-Meitner-Institute Berlin. We are deeply indebted to the ISL accelerator team and want to thank in particular Dr. D. Fink, Dr. K. Maier and Dr. M. Müller from HMI and Prof. H.A. Klose from GMS for a lot of practical help.
We acknowledge the benefit from the DESY II accelerator crew and the test area maintainance group.
References
- [1] Ansorge, R., et al., NIM 265, 33 (1988)
- [2] Annies, P., et al., NIM A367, 367 (1995)
-
[3]
Bross, A.D., Nucl. Phys. B (Proc.Suppl.) 44,
12 (1995)
Adams,D.,et al., Nucl. Phys. B (Proc.Suppl.) 44, 332 (1995) - [4] Bähr, J., et a., Proceedings of the 28th Intern. Conf. on High Energy Physics, Warsaw, Poland, 1996, eds. Z.Ajduk,A.K.Wroblewski V. II, p. 1759
- [5] Lohse, T., et al., HERA-B Technical Proposal, DESY-PRC 94/02 (1994)
- [6] Ferro–Luzzi, M., et al., contribution presented by A.Gorin, to appear in Proceedings of the workshop SCIFI97, Notre Dame, USA, 1997
- [7] Yoshizawa, Y., et al., to appear in Proceedings of the workshop SCIFI97, Notre Dame, USA, 1997
- [8] Aschenauer, E.C., et al., preprint DESY 97-174 (1997)
- [9] Dreis, B., et al., preprint DESY 98-049 (1998)
- [10] Nakano, T., et al., Proceedings of the workshop SCIFI93, Notre Dame, USA, 1993, eds. A. Bross, R. Ruchti, M. Wayne, p. 525
- [11] Yoshizawa, Y., et al., Hamamatsu technical information, No. TPMH 9002E01
- [12] Akbari, H., et al., NIM A302, 415 (1991)
- [13] Bähr, J., et al., Proceedings of the workshop SCIFI93, Notre Dame, USA, 1993, eds. A. Bross, R. Ruchti, M. Wayne, p.578
- [14] Bähr, J., et al., NIM A371, 380 (1996)