[
Discrimination of the Healthy and Sick Cardiac Autonomic Nervous System by a New Wavelet Analysis of Heartbeat Intervals
Abstract
We demonstrate that it is possible to distinguish with a complete certainty between healthy subjects and patients with various dysfunctions of the cardiac nervous system by way of multiresolutional wavelet transform of RR intervals. We repeated the study of Thurner et al on different ensemble of subjects. We show that reconstructed series using a filter which discards wavelet coefficients related with higher scales enables one to classify individuals for which the method otherwise is inconclusive. We suggest a delimiting diagnostic value of the standard deviation of the filtered, reconstructed RR interval time series in the range of (for the above mentioned filter), below which individuals are at risk.
pacs:
]
I Introduction
Measurement of heart rate (HR) and evaluation of its rhythmicity have been used for a long time as a simple clinical indicator [1]. The main adaptive regulation of the sinus node function and thereby the HR, is exerted by the autonomic nervous system. The sinus node of the heart is a major organ in the integrated control of cardiovascular function. HR abnormality may therefore be an early or principle sign of disease or malfunction.
Research from the last decade indicates that a quantification of the discrete beat to beat variations in HR - heart rate variability (HRV) may be used more directly to estimate efferent autonomic activity to the heart and the integrity of this cardiovascular control system [2]. The finding that power spectral analysis of HRV could be used as a marker of cardiac autonomic outflow to the heart, was considered a breakthrough for clinical research [3, 4].
Autonomic dysfunction is an important factor in a number of conditions. In diabetes, an abnormality in autonomic nervous function signals an adverse prognosis and risk of subsequent heart disease. Recognition of early dysfunction is therefore important. In overt heart disease autonomic imbalance is of significant importance in the pathophysiology of sudden cardiac death. Abnormal autonomic balance is an important prognostic factor. In heart failure this control system may be significantly deranged.
Techniques which can discriminate the healthy HRV profile from a sick one are therefore highly desirable. So far this has not been accomplished, as a considerable overlap between healthy and sick, (i.e. healthy and diabetes) [5] or high and low risk heart disease patients [6], have been reported. The time series used for HRV analysis are derived from 24-hour ECG recordings. These are clinically widely used and offer important additional information. However, several problems have limited the use and interpretation of the spectral analysis results. The ambulatory time segments inherently lack stationarity. Furthermore, they often include transients caused by artifacts, ectopic beats, noise, tape speed errors which may have significant impact on the power spectrum [7]. This significantly limits the sensitivity of this technique, and thus may limit its applicability.
II Methods
One of the most successful techniques to analyze non stationary time series is the Multiresolution Wavelet Analysis [8, 9, 10, 11, 12, 13, 14]. This technique was recently utilized in order to analyze a sequence of RR intervals [13, 14]. Ref. [13] identifies different scaling properties in healthy and sleep apnea patients. In a previous study, Peng et al [15] were able to distinguish between healthy subjects and patients with heart failure by the use of the detrended flactuation analysis. Later, Thurner et al [14] used a similar procedure but focused on the values of the variance rather than on the scaling exponent. For the scale windows of and heartbeats, the standard deviations of the wavelet coefficients for normal individuals and heart failure patients were divided into two disjoint sets. In this way the authors of ref. [14] succeeded to classify subjects from a test group as either belonging to the heart failure or the normal group, and that with a 100% accuracy.
The Discrete Wavelet transform is a mathematical recipe acting on a data vector of length , and transforming it into a different vector of the same length. It is based on recursive sums and differences of the vector components; the sums can be compared with the low frequency amplitudes in the Fourier transform, and the differences with the high frequency amplitudes. It is similar to the Fourier transform in respect of orthogonality and invertibility. The wavelets are the unit vectors i.e., they correspond to the sine and cosine basis functions of the Fourier transform. One of the basic advantages of wavelets is that an event can be simultaneously described in the frequency domain as well as in the time domain, unlike the usual Fourier transform where an event is accurately described either in the frequency or in the time domain. This difference allows a multi resolution analysis of data with different behaviour on different scales. This dual localization renders functions with intrinsic inaccuracies into reliable data when they are transformed into the wavelet domain. Large classes of biological data (such as ECG series and RR intervals) may be analysed by this method.
Heart failure patients generally have very low HRV values. To further explore the potential possibilities of the Multiresolutional Wavelet Analysis we have investigated a test group of 33 persons, 12 patients and 21 healthy subjects. The patient group consisted of 10 diabetic patients which are otherwise healthy and without symptoms or signs of heart disease, one patient which have had a myocardial infarction and one heart transplanted patient in whom the autonomic nerves to the heart have been cut.

We have in the present study applied the same technique as used in ref. [14] and have by Multiresolution Wavelet Analysis been able to identify correctly all but one of 33 test persons as belonging to the group of healthy subjects or subjects suffering from myocardial infarction. The heart transplanted patient was included as a subject displaying the ultimative cardiac autonomic dysfunction - complete denervation.
We have, however, elaborated on the procedure applied in ref. [14] by utilizing a filter-technique. Thus we perform an Inverse Wavelet Transform, but retain only a specific scale in the reconstruction of the time series; a complete separation is observed for or . In this way a reconstructed and filtered time series is obtained and a comparison with the original time series shows a substantial difference in amplitude between sick/healthy subjects relative to the difference found in the original RR interval time series. The choice of or was motivated by the findings in ref. [14] and by our own results.
III Results
We have calculated the standard deviation for Daubechies 10-tap wavelet versus the scale , , for 33 persons. In accordance with ref. [14] we find that for the separate the two classes of subjects and hence provide a clinically significant measure of the presence of cardiac autonomic dysfunction with a 97% sensitivity. This supports in a convincing way the findings of ref. [14]. We have been able to confirm this trend with other wavelets.
The main result of this study is however the possibility to display the standard deviation of the RR interval amplitude vs. the beat number in the reconstructed, filtered time series. This standard deviation, here denoted by , can be used to obtain a separation of sick/healthy subjects.
In fig. 1 we display the RR intervals vs. the beat number of a normal subject. The wavelet technique cleans the highest and lowest frequencies from the overall picture. The highest frequencies contain noise and the lowest frequencies contain mainly external influences on the HR pattern like movement and slower trends in HR level, which are not necessarily reflective of autonomic nervous activity. After the removal of these frequencies one is left with the characteristic frequencies of the heart.
Fig. 2 shows the standard deviation for a Daubechies 10-tap wavelet as a function of the scale number m. The almost total separation between sick and healthy subjects is obvious.
Patient #1, falling into the range of sick patients, has a very low HRV both on a 24-hour scale and short term. The patient is a survivor of a heart infarct and is at high risk of sudden cardiac death.
Patient #2 has the lowest values in the range . He has undergone a heart transplant; the nerves to the heart have been disconnected and there is almost no HRV.
Patient #3 is a diabetic patient, who is classified by the wavelet technique as a high risk patient. Diabetic patients with abnormal cardiac autonomic function have an adverse prognosis and increased risk of heart disease.
Patient #4, also a diabetic, seems to be less at risk. His is near the transition between healthy and sick subjects.
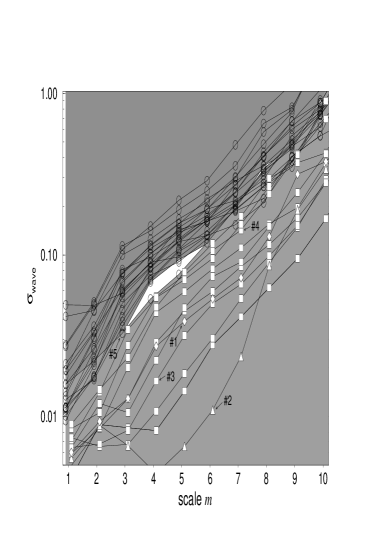
The method used in ref. [14] fails for subject #5, who appears in the risk group, although he had no evidence of diabetes or heart disease.
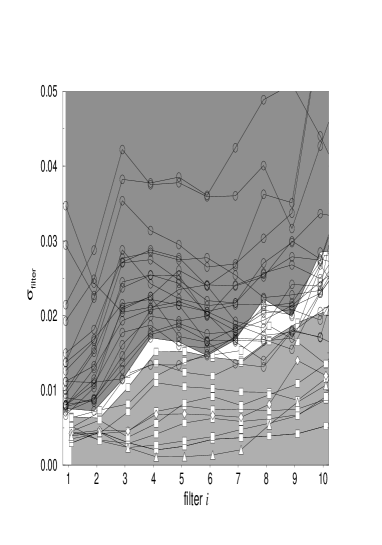
In fig. 3 the standard deviation of the amplitude of the reconstructed time series has been calculated for . Again, a total separation between sick and healthy subjects is apparent. The fact that the remain almost constant for scales between 4 and 6 for each individual hints to the possibility that the corresponding frequencies are characteristic of those at which the autonomic nervous system works.
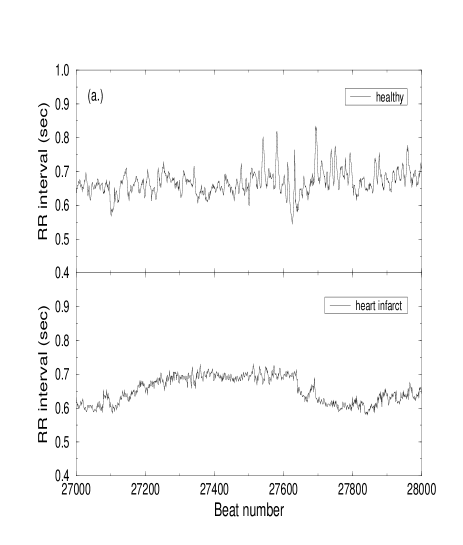

Fig. 4a shows a typical RR interval time series for a healthy and a sick subject, whereas fig. 4b shows the reconstructed time series (). One notices that the difference in amplitudes for healthy/sick subjects is much more pronounced in the latter time series.
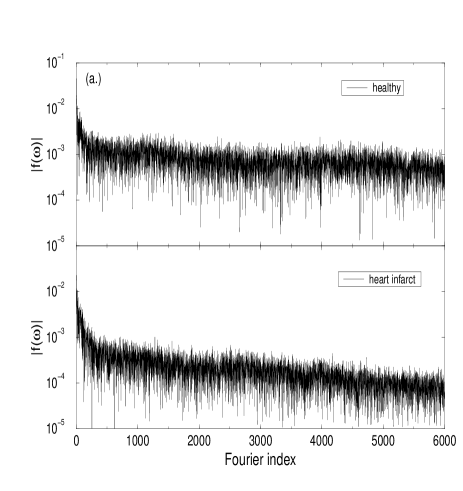
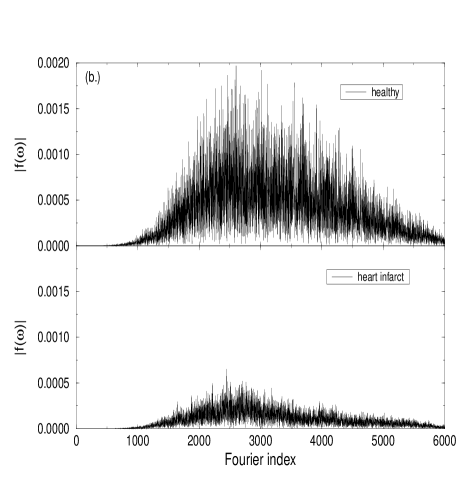
Figs. 5a and 5b show the Fourier transforms for the time series displayed in figs. 4a and 4b, respectively. These power spectra appear similar, however differ in their respective order of magnitude. Clearly, the reconstructed filtered time series are distinct by the amplitude as well as the broadness of their Fourier transforms.
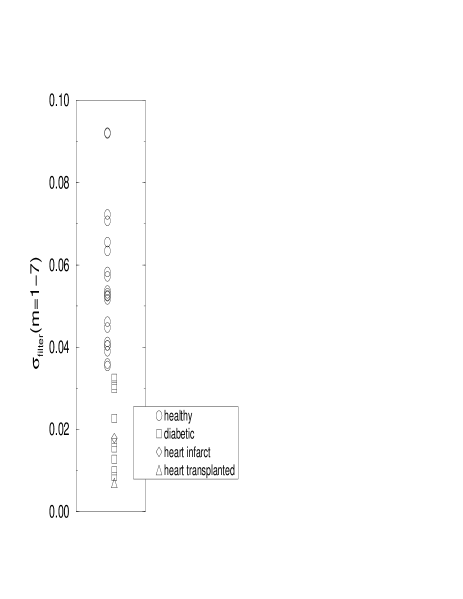
In fig. 6 we have obtained a complete separation between the sick and healthy subjects by application of a filter which is created by retaining wavelet coefficients with scales . This filter was motivated by the observation that a separation is evident for these scales (see figs. 2 and 3). One observes that the healthy subject #5, who failed the wavelet transform diagnostics of ref. [14] (fig. 2), is now properly classified as not being at risk.
IV Conclusion
Our study supports the conjecture of ref. [14] that healthy subjects exhibit greater fluctuations (larger values) than patients. This difference in fluctuations become most evident on the scale 4 to 5 (corresponding to windows of 16 and 32 heartbeats), but in our study it is apparent at all scales from 1 to 7 (windows of 2 to 128 heartbeats).
The most distinct difference between sick and healthy individuals appears in the amplitude changes in the ’reconstructed’ time series, where the windows of 16, 32 and 64 heartbeats contribute in a similar way. Letting the window be as small as heartbeats is enough to allow the healthy group to show substantial variation in the size of RR intervals implying a large value, but is at the same time too small a window to let the sick cardiac autonomic nervous system introduce significant variations in the length of the RR intervals and hence allows it only to reach a value essentially smaller than the healthy heart.
The final conclusion of this study is that in order to obtain a complete separation between healthy subjects and patients one has to consider a range of scales (as shown in fig. 6) instead of only one scale (as in figs. 2 and 3). This implies that, as in fig. 6 can be used as a diagnostic indicator, with a delimiting value of (for the above mentioned filter), below which the persons have abnormal cardiac autonomic function and will be at risk.
V Acknowledgments
M.L. and K.S. are grateful to the Danish-Israel Study Fund in memory of Josef & Regine Nachemsohn. Y.A. acknowledges support from the Yad Jaffah Foundation.
REFERENCES
- [1] H. Moelgaard, 24-hour Heart Rate Variability. Methodology and Clinical Aspects. Doctoral Thesis, University of Aarhus, (1995).
- [2] R. Furlan, S. Guzzetti, W. Crivellaro et al, Circulation 81, 537 (1990).
- [3] S. Akselrod, D. Gordon, F. A. Ubel et al, Science 213, 220 (1981).
- [4] B. Pomeranz, R.J.B. Macaulay, M.A. Caudill et al, Am. J. Physiol. 248, 151 (1985).
- [5] H. Moelgaard, P.D. Christensen, H. Hermansen et al, Diabetologia 37, 788 (1994).
- [6] J.T. Bigger, J.L. Fleiss, L.M. Rolnitzky et al, JACC 18, 1643 (1991).
- [7] Task force of ESC and NASPE, Eur. Heart J., 354 (1996).
- [8] I. Daubechies, Ten Lectures on Wavelets (Society for Industrial and Applied Mathematics, Philadelphia, PA 1992)
- [9] G. Strang and T. Nguyen, Wavelets and Filter Banks, (Wellesley-Cambridge Press, Wellesley, 1996)
- [10] W. H. Press, S. A. Teukolsky, W. T. Vetterling and B. P. Flannery, Numerical Recipes in C, 2nd Ed., Cambridge University, Cambridge 1995.
- [11] A. Aldoubri and M. Unser, eds., Wavelets in Medicine and Biology (CRC Press, Boca Raton, FL, 1996)
- [12] M. Akay, ed, Time Frequency and Wavelets in Biomedical Signal Processing (IEEE Press, Piscataway, NJ, 1997)
- [13] P.C. Ivanov, M.G. Rosenblum, C.-K. Peng, J. Mietus, S. Havlin, H.E. Stanley, and A.L. Goldberger, Nature 383, 323 (1996)
- [14] S. Thurner, M.C. Feuerstein and M.C. Teich, Phys. Rev. Lett. 80, 1544 (1998).
- [15] C.K. Peng, S. Havlin, H.E. Stanley and A.L. Goldberger, Chaos 5, 82-87, (1995)