Vibrational Frequencies of the 2p and 3d States of the Triatomic Deuterium Molecule
Abstract
We investigated the vibrational energies in the 2p and 3d states of the triatomic deuterium molecule D3. The experiments were performed using a fast neutral beam photoionization spectrometer recently developed at Freiburg. A depletion type optical double-resonance scheme using two pulsed dye lasers was applied. The measured vibrational frequencies of the 2p state of D3 are compared to those of H3 and to theoretical values calculated from an ab initio potential energy surface. The data give insight into the importance of the coupling between the valence electron and the ion core.
PACS-Numbers: 33.80.Rv, 33.20.Kf, 33.20.Lg, 34.10.+x, 34.30.+h
1 Introduction
The triatomic hydrogen molecule, the simplest neutral polyatomic molecule, is ideally suited to study fundamental aspects of the interaction between the electronic and the nuclear motion. The molecule is sufficiently small for high precision ab initio investigations of the potential energy surfaces to be successful [1, 2]. Excited states of H3 and D3 were discovered by Herzberg and coworkers [3, 4, 5, 6] in emission from electrical gas discharges in hydrogen and deuterium. All of the excited states are predissociated by coupling to the repulsive ground state potential energy surface except for the single rotational state 2p(N=K=0) which is metastable and can be prepared in a fast neutral beam by charge transfer of H or D [7, 8, 9, 10] in cesium. The H3 2p(N=K=0) state was used as a platform for laser-excitation/ionization experiments in order to explore the Rydberg states of H3 and to determine their vibrational frequencies [7, 11, 12, 13, 14, 15, 16, 17] .
In a recent investigation from this laboratory [18], we created a fast beam of rotationless D3 molecules in the lowest vibrational levels of the 2p metastable state. Following vibrationally diagonal excitation in the ultraviolet spectral range, we observed five Rydberg series. Two series were detected by field-ionization and assigned to s– and d– type Rydberg states with a vibrationless D core. Three series were found to consist of transitions from vibrationally symmetric stretch and degenerate mode excited 2p states into auto-ionizing Rydberg states. In order to assign the core vibrational excitation, we used preliminary results of a depletion type double resonance experiment. A vibrationally non-diagonal transition which appears as a Fano type line above the first ionization limit allowed us to determine the first symmetric stretch vibrational frequency of the D3 2p state. In order to determine the degenerate mode frequency of the 2p state, we used the molecular constants of the D ion[19].
The objectives of the present investigation are threefold. First, we present the results of double resonance experiments which confirm the assignment of the Rydberg states observed previously [18]. Secondly, we investigate vibrationally diagonal and non-diagonal transitions from the 2p state to vibrationally ground and exited levels of the 3d state. In this way, we determine the vibrational frequencies of the 2p and 3d states of D3. Third, we calculate the vibrational levels of the 2p states of H3 and D3 with the potential energy surface published recently by Peng et al. [2] using the filter diagonalization method in the version of Mandelshtam and Taylor [20]. The comparison between the experimental data and the theoretical model gives insight into the influence of the Rydberg electron on the bond strength. By using different isotopes, the potential energy surface is effectively probed.
2 Experimental
In this study, we used the fast beam collinear spectrometer recently developed at Freiburg [18]. Triatomic deuterium ions (D) were created in a hollow cathode discharge in deuterium (D2). The cathode was cooled by liquid nitrogen. The ions were accelerated to an energy of 3.6 keV and mass selected by a Wien-filter. A small fraction of the ions was neutralized by charge transfer in cesium vapor. After the charge-transfer cell, the unreacted ions were removed by an electric field. A 1 mm diameter aperture located 30 cm downstream of the charge transfer cell was used to stop products of dissociative charge transfer. Fast metastable molecules which entered the 120 cm long laser-interaction region were excited by a counterpropagating pulsed dye laser beam. Photoions were detected at the end of the interaction region by an energy analyzer and a microsphere plate. A 200 MHz dual-counter was used to accumulate the signal produced by the laser pulses and the background events separately. The data were then transferred to a laboratory computer and stored for further treatment.
In order to perform depletion type double resonance experiments, we operated two dye lasers pumped by an excimer laser. The wavelengths of both dye lasers were programmed and/or scanned under control of the laboratory computer. Using an optical delay line, the pulses of one of the dye lasers (labelling laser) were delayed by about 15 ns with respect to the pulses of the other dye laser (excitation laser). Both laser beams were merged by a beamsplitter before they entered the interaction region. The labelling laser was operated at a fixed wavelength, and used to excite a transition from a specific vibrational level of the 2p state to a field- or autoionizing state. The ion signal was used to monitor the population in the lower state. The excitation laser was scanned in the tuning ranges of the dyes Rhodamine 6G and Coumarin 307. Transitions originating from the labelled lower state lead to a reduction of the ion signal and appear as depletion dips in the spectra. The depletion technique is most effective in the case of transitions to upper states which are quickly predissociated. A long-lived upper state may be ionized by a second photon from the same excitation laser pulse (1+1 REMPI) which reduces the depth of the depletion feature. In that case, the intensity of the excitation laser was reduced by neutral density filters.
In order to calibrate the wavelength scales of the lasers, the optogalvanic signal from a hollow cathode discharge in neon and argon was recorded, and the observed lines were compared to tabulated values [22]. The Rank-formula [23] was used to correct for the refractive index of air. The Doppler-shift due to the motion of the fast neutral molecules was calculated from the acceleration voltage of the ion source. We estimate the systematic uncertainty of the photon energy scale to be less than 0.2 cm-1.
3 Numerics
The significance of any molecular eigenstate calculation, depends strongly
on the quality of the potential energy surface (PES) on which it is performed.
For computing the low lying vibrational frequencies of H3 and D3 in the
2p 2A state, we use the fitted ab initio potential energy
surface of Peng et al.[2]. This seems to be a rather accurate fit
(with only 5 cm-1 average deviation from its 1340 ab initio points
[2]), thus enabeling us to make a rather precise prediction of
its eigenstates.
¿From the various methods for computing vibrational states of small molecular
systems, we use the low-storage version of the filter-diagonalization method
introduced recently by Mandelshtam and Taylor [20]. This
method is conceptually based on the filter-diagonalization procedure of Wall
and Neuhauser [24] which extracts the system eigenenergies by
harmonic inversion of a time correlation function C(t). The method of
ref. [20] is designed to use a direct harmonic inversion of
the Chebyshev correlation function [21]
| (1) |
for the eigenenergies and amplitudes . The computation of the sequence is done to essentially the machine precision using a very inexpensive iterative numerical scheme,
| (2) |
with being generated using
.
This requires to store only a few vectors at a time, if the
matrix-vector multiplication is implemented without explicit storage of the
Hamiltonian matrix. The spectral analysis part (i.e., the harmonic inversion
of by the filter-diagonalization) is carried out independently and
efficiently after the sequence is computed. All these features imply
the
very high performance of the overall numerical procedure.
It is not hard to achieve a precision of the low lying states of
, because their density of states is not
high, and, therefore, the number of iterations can be small (),
requiring only a few hours of CPU time on a RS6000/59H workstation.
We choose Radau coordinates, in which all mixed derivatives in the kinetic
energy vanish [25], to guarantee for a fast application of the
Hamiltonian to a vector, which is the bottleneck in iterative methods.
However, this choice of coordinates implies that C2v symmetry, rather
than the full D3h symmetry of H3 (D3), is used in the
calculation. Nevertheless, E states can be identified as a numerically close
pair of an A′ and an A′′ state [26].
We also use a sinc-DVR [27] for the radial and a Legendre-DVR
for
the angular part of the Hamiltonian. The parameters defining the grid are the
size of the primitive sinc-basis , which are truncated by a
kinetic
energy cutoff to , their spatial extension from
to , the size of the primitive basis of the Legendre
polynomials for the angular motion and a three-dimensional potential
energy cutoff . All primitive basis parameters have been adjusted in
the one-dimensional problem, with the remaining coordinates held fixed to
their equilibrium values. The details of the convergence procedure will be
described in [28].
For we used the values above the minimum of the potential, and , overall resulting
in
232 705 gridpoints. The figures for were above the minimum of the potential,
and ,
resulting in 116 192 gridpoints.
The results, which are shown in table 3,
have an accuracy of better than 0.25
cm-1 assuming the PES is correct,
which e.g. follows from comparison of the A′ and
A′′ components of the E states. Additionally,
convergence was ensured
by running various grids of increasing size.
4 Results and Discussion
In Table 1, the ionization limits and quantum defects of five Rydberg series detected in a previous investigation from this laboratory [18] are listed. Series 1 and 2 were observed by field-ionization and assigned to d- and s-type Rydberg series, respectively, converging to a vibrationless D() state. Series 3 to 5 were found to arise from autoionizing states which are built on vibrationally excited D ion cores. We also observed a Fano type resonance at 29652.6 cm-1 in the continuum above the first ionization limit of the vibrationless 2p state. In the present investigation, the depletion technique is used in order to decide which transitions share a common lower state, and to determine vibrational frequencies in a straightforward way.
4.1 Depletion measurements of the vibrationless 2p state
With the labelling laser set to a member (n=39) of the field-ionizing series 1, we observed a depletion dip centered at a frequency of 17333.3 cm-1(Fig. 1a). This transition was observed in emission by Herzberg’s group and assigned to the 2p(0,0,0,0) 3d(0,0,1,0) transition of D3[6]. We describe the rovibrational states by the set (,,N, G) with the quantum numbers of the symmetric stretch (A) and the degenerate mode (E′) vibrations and , the total angular momentum apart from spin , and Hougen’s convenient quantum number [29], which contains the projections of the total (), the electronic (), and the vibrational angular momentum () onto the figure axis. The depletion feature in Fig. 1a shows clearly that the vibrationless 2p(0,0,0,0) state is the lower state of Rydberg series 1 and 2. The large width of 0.8 cm-1 is mainly due to power-broadening . The depletion in the center of the dip is almost complete which indicates a strong decay mechanism of the upper state either by predissociation or by radiation into a state different from 2p(0,0,0,0).
We scanned the excitation laser in the tuning range of Coumarin 307, and observed in a 300 cm-1 wide region a single depletion dip centered at 19629.4 cm-1 (labelling by n=40 of series 1, Fig.1b). The width of the dip is about 0.2 cm-1 FWHM. The difference between the locations of the depletion features shown in Fig.1 is 2296.1 cm-1. This value is extremely close to the 2300.843 cm-1 symmetric stretch vibrational frequency of the D ion [19]. We, therefore, assign the upper state of the transition at 19629.4 cm-1 to the vibrationally symmetric stretch excited 3d(1,0,1,0) state. The Franck-Condon factor of this vibrationally non-diagonal transition is quite small. Therefore, the transition to the 3d(1,0,1,0) state (Fig. 1b) is much less power-broadened than that to the 3d(0,0,1,0) state (Fig. 1a). The depletion depth in Fig. 1b is about half of the ion signal. With the exitation laser (Coumarin 307) unattenuated and the ionization laser blocked, we observe a strong REMPI peak at 19629.4 cm-1. Both observations are in line with a comparatively long natural lifetime of the vibrationally excited 3d state.
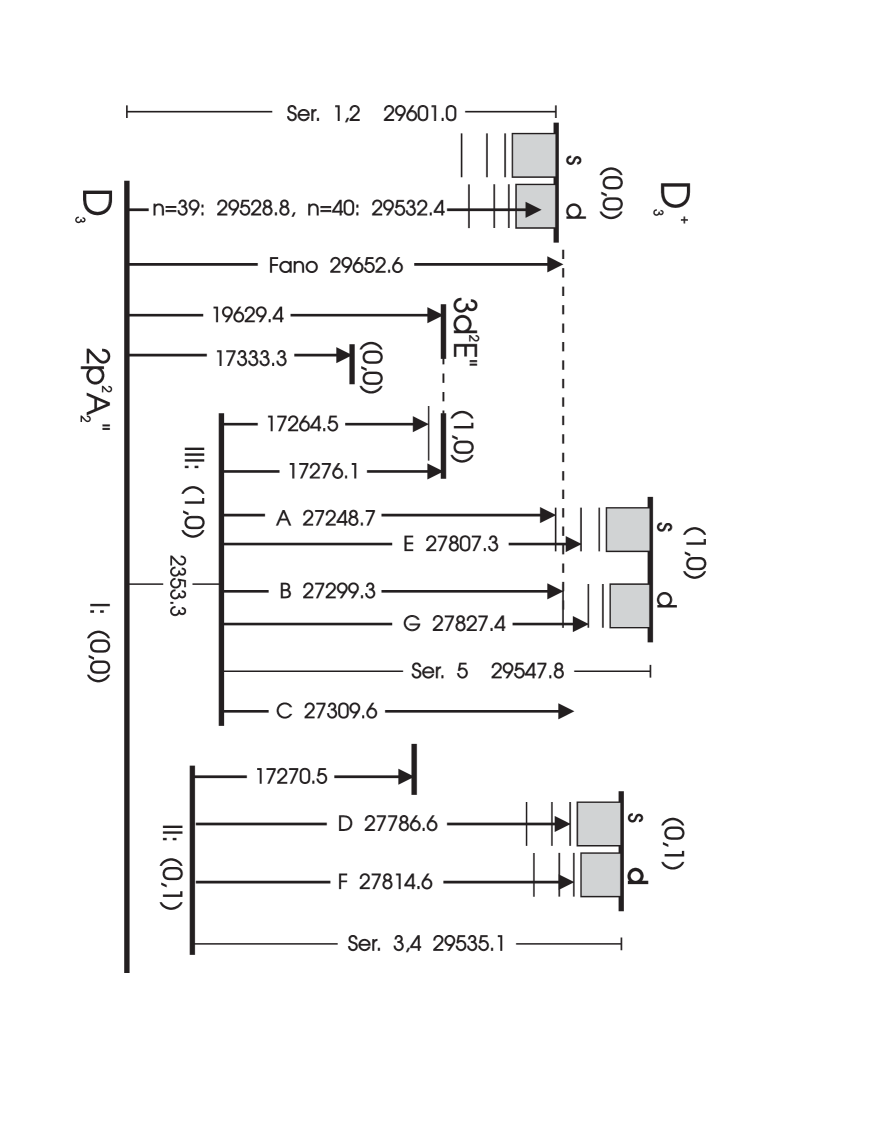
With the labelling laser tuned to the peak of the Fano type resonance at 29652.6 cm-1, we observe depletion centered at 19629.4 cm-1(Fig 2a,b). The depth is about half of the steady ion signal which demonstrates that the Fano type feature is quantitatively depleted. The measurements presented in Figs. 1 and 2 demonstrate that the lines of series 1 and 2, the transitions to the vibrationally ground and symmetric stretch excited 3d states at 17333.3 and 19629.4 cm-1, respectively, and the Fano-type peak at 29652.6 cm-1 originate from the vibrationless 2p(0,0,0,0) metastable state of D3. These transitions are shown in the level scheme Fig. 7 with the common lower state labelled by I.
4.2 Depletion measurements of vibrationally excited 2p states
The objective is to determine the core excitation of the autoionizing d– and s–Rydberg states of series 3 and 4 converging to a limit of 29535.1 cm-1, and the d–states of series 5 converging to 29547.8 cm-1. In Fig. 3, vibrationally diagonal transitions to autoionizing states in the 27230 cm-1 to 27350 cm-1 and the 27760 cm-1 to 27840 cm-1 energy range are shown. The positions of the n=7 and n=8 lines of series 3 to 5 calculated from the series limits and quantum defects in Table 1 are indicated by the open circles in Figure 3. As discussed previously [18], the thresholds for vibrational autoionization of Rydberg states calculated from the molecular constants of D [19] are n=8 and n=7 for a core excitation of one quantum in the degenerate and symmetric stretch mode, respectively. This should allow us to determine the core excitation of the different series from the lowest observed principal quantum number lines. The peaks F, D and G are the n=8 members of series 3,4, and 5, respectively. In the n=7 range, the assignment is not unique. Peak B corresponds to n=7 of series 5. Peak A could belong to series 4. The peak C cannot be assigned to any of the series in Table 1.
Therefore, we performed depletion experiments with the labelling laser tuned to the peaks A to G, and the excitation laser operating with Rhodamine 6G. The results are presented in Figs. 4 and 5. Labelling the peaks A,B,C, E, and G we found depletion dips at 17264.5 cm-1. On the other hand, labelling the peaks D and F, we clearly observed dips at 17270.5 cm-1. We cross-checked and found that the lines D and F and the lines A,B,C, E, and G are excited from the common lower states II and III, respectively, as shown in the level scheme Fig. 7 . None of the features in the left part of Fig. 3 arises from state II. The peaks D and F are the lowest principal quantum number lines of series 3 and 4 and the autoionization threshold of these series is n=8. It follows that the ion cores of the Rydberg states of series 3 and 4 and of the common lower state (II in Fig. 7) are in the first degenerate mode excited vibrational state (=1, =2). The assignment of the peaks A, C, and E in Fig. 3 will be discussed below.
In the measurement presented in Fig. 6, peak G (n=8 of series 5) was excited by the labelling laser and the excitation laser was tuned in the 17256 cm-1 to 17285 cm-1 range. In spectrum (a) of Fig. 6, the pulse energy of the excitation laser was 120 J. Spectra (b) and (c) of Fig. 6 were recorded with the excitation laser attenuated by factors of 10 and 20 respectively using neutral density filters. We observe two depletion features at 17264.5 cm-1 and at 17276.1 cm-1 respectively. At high pulse energy of the excitation laser, the feature at 17264.5 cm-1 is comparatively narrow and in the center of the dip, the ion signal is almost completely depleted. This feature disappears at low pulse energy. The dip at 17276.1 cm-1 appears broad and shallow with a width of about 1 cm-1 FWHM at high pulse energy. At a laser energy as low as 6 J, the depletion of the ion signal is almost complete and the width is reduced by a factor of 3 to about 0.3 cm-1. This shows that the transition moment of the line at 17276.1 cm-1 is by at least one order of magnitude stronger than that of the line at 17264.5 cm-1.
4.3 Symmetric Stretch Frequency of the D3 2p State
In the level scheme Fig. 7, the transitions which were found by the depletion technique to originate from the lower states labelled by I, II, and III are indicated by vertical lines. As already discussed, state I was identified to be the vibrationless metastable state 2p(0,0,0,0) . State II was found to be the degenerate mode (E′) excited 2p state. We notice that the difference between the Fano-type feature at 29652.6 cm-1 and the 2p(0,0,0,0)3d(1,0,1,0) transition at 19629.4 cm-1 is 10023.2 cm-1. This value is in (almost too) perfect agreement with the difference between the transitions at 27299.3 cm-1 (peak B in Fig. 3) and at 17276.1 cm-1 (Fig. 6) both originating from state III . We do not find any other combination differences between the observed transitions which would coincide within the experimental accuracy. This leads us to conclude that the upper states connected by the dashed horizontal lines in Fig. 7 are identical. As a consequence, the separation between the states I and III calculated via the 3d(1,0,1,0) intermediate state is found to be 2353.3 cm-1. This value is extremely close to the first symmetric stretch vibrational frequency of the D ion. We conclude that state III is the symmetric stretch excited 2p(1,0,0,0) state. It follows that the previous assignment [18] of series 5 to converge to a symmetric stretch excited D state is correct.
In order to assign the peaks A, C, and E we calculated the principal quantum numbers and quantum defects of all the features in Fig. 3 which were found to have the symmetric stretch excited 2p(1,0,0,0,) state as the lower state. We used the 29547.8 cm-1 limit of series 5 which converges to a symmetric stretch excited D state. The values are listed in Table 2. The peaks B and G with n=7, =0.0143 and n=8, =0.0138 respectively have already been recognized to be d states of series 5 and are listed for completeness in Table 2. Based on the quantum defect of =0.060, peak E is assigned to the 8s state with symmetric stretch excited core.
The quantum defect =0.092 of peak A is significantly larger than the typical values for s–states (c.f. tab. 1) and we have to understand the peak width of 3 cm-1 FWHM which is appreciably larger than that of the other features in Fig. 3. The peak center at 27248.7 cm-1 is extremely close to the energy difference of 27247.7 cm-1 between the symmetric stretch excited 2p(1,0,0,0) state and the first ionization limit of the vibrationless 2p(0,0,0,0) ground state. Transitions between the 2p(1,0,0,0) state and the vibrationless s– and d– states of series 1 and 2 are optically allowed, but the Franck-Condon factors are very small. Feature A could arise from an interference between the vibrationally diagonal transition from the 2p(1,0,0,0) state to the symmetric stretch excited 7s state and non-diagonal transitions to vibrationless high principal quantum number s– and d– states of series 1 and 2.
Based on the quantum defect of =-0.002, peak C was explained in a previous study [18] by an interloper of a g–series with symmetric stretch excited core. Another explanation is a vibrationally non-diagonal transition to a 5s (2,0,1,0) state with two quanta of excitation in the symmetric stretch mode. The series limit listed in Table 2 was calculated from the molecular constants of D determined by Amano et al. [19]. The quantum defect of =0.0566 is in line with the values generally observed for low principal quantum number s–states.
4.4 Comparison between Experimental and Theoretical Results
In Table 3, the energies of the lowest vibrational states of H3 2p and D3 2p determined by theoretical and experimental investigations are listed. The values are given relative to the vibrationless states. The theoretical data are calculated from the ab initio potential energy surface by Peng et al.[2] using the procedure described in Section 3. For comparison, the vibrational frequencies of the H and D ions determined by Majewski et al. [30] and by Amano et al. [19] are included in Table 3. The differences between the vibrational frequencies of the neutrals and the ions are quite large which shows the valence character of the 2p state. The use of ab initio potential energy surfaces is mandatory in order to calculate the vibrational levels to a satisfactory accuracy. A treatment based on a quantum defect, which is independent of the nuclear coordinates, is condemned to fail. The experimental results for D3 were measured in this and in a previous investigation from this laboratory [18], and the data for H3 were taken from Ketterle et al. [14]. The value of 3255.4 cm-1 for the symmetric stretch frequency of the H3 2p state measured by Lembo and Helm [16] is in close agreement with the value of 3255.38 cm-1 measured by Ketterle et al. [14]. The uncertainties of the experimental data which are estimated to be 0.3 cm-1 for D3 and 0.1 cm-1 for H3, are generally much smaller than the differences between experiment and theory which are of the order of a few cm-1, the largest being 6.6 cm-1 in case of the E′– vibration of H3 2p. As discussed above, the numerical procedure for the calculation of the eigenvalues is converged to an accuracy better than 0.25 cm-1. Therefore, the differences between experiment and theory must be attributed to the potential energy surface which was fitted to the ab initio points with an average deviation of 5 cm-1 and a root mean square deviation of 170 cm-1 [2]. The shape of the fitted PES in the region occupied by the low vibrational states is apparently quite good. The observed differences between the vibrational frequencies of the neutrals and the ions are in very good agreement with the theoretical data as visualized in Fig. 8 where we present the differences between the vibrational frequencies of the 2p states and those of the corresponding ions, normalized to the frequencies of the ions for easier comparison. The measured symmetric stretch frequencies of the 2p states of D3 and H3 are roughly 2 % higher than those of the D and H ions, respectively, which is very well reproduced by the calculated data. In the case of the degenerate mode vibration, the relative differences between neutrals and ions are almost twice as large. This additional resistance against asymmetric deformation induced by the 2pz–electron is explained by the theoretical data, although the total effect is slightly underestimated.
5 Conclusions
We investigated the vibrational frequencies of the 2p metastable state and the 3d state of the triatomic deuterium molecule D3 by a depletion type double resonance technique. We found a separation of 2296.1 cm-1 between the vibrationless D3 3d(0,0,1,0) and the symmetric stretch excited 3d(1,0,1,0) state. The 2353.3 cm-1 symmetric stretch frequency of the 2p state determined in a previous investigation from this laboratory was confirmed. We compared the experimental results of the 2p state of D3 and H3 with theoretical data calculated from an ab initio potential energy surface. The theoretical data describe very well the differences between the vibrational frequencies of the ions and the neutrals which demonstrates the quality of the ab initio potential energy surface.
6 Acknowledgements
We are greatly indebted to Prof. H. Helm and Prof. Ch. Schlier for their support, for continuous encouragement during the course of this work, and for critical reading of the manuscript. Thanks must go to S. Kristyan for providing us with the fitted potential energy surface. It is a pleasure to acknowledge technical assistance by U. Person during the construction and operation of the apparatus. This research was financially supported by Deutsche Forschungsgemeinschaft through its SFB 276.
References
- [1] Ch. Nager and M. Jungen, Chem. Phys.70, 189 (1982)
- [2] Z. Peng, S. Kristyan, A. Kuppermann, and J. S. Wright, Phys. Rev. A. 52, 1005 (1995)
- [3] I. Dabrowski and G. Herzberg, Can. J. Phys. 58, 1238 (1980)
- [4] G. Herzberg and J. K. G. Watson, Can. J. Phys. 58, 1250 (1980)
- [5] G. Herzberg, H. Lew, J. J. Sloan, and J. K. G. Watson, Can. J. Phys. 59, 428 (1981)
- [6] G. Herzberg, J. T. Hougen, and J. K. G. Watson, Can. J. Phys. 60, 1261 (1982)
- [7] H. Helm, L. J. Lembo, P. C. Cosby, and D. L. Huestis, Fundamentals of Laser Interactions II, Lecture Notes in Physics (Ed. F. Ehlotzky), Springer (1989), p. 264
- [8] F. M. Devienne, C. R. Acad. Sci. Paris B 267, 1279 (1968) and 268, 1303 (1969)
- [9] G. I. Gellene and R. F. Porter, J. Chem. Phys. 79, 5975 (1983)
- [10] J. F. Garvey and A. Kuppermann, Chem. Phys. Lett. 107, 491 (1984)
- [11] H. Helm, Phys. Rev. Lett. 56, 42 (1986)
- [12] H. Helm, Phys. Rev. A 38, 3425 (1988)
- [13] A. Dodhy, W. Ketterle, H.-P. Messmer, and H. Walther, Chem. Phys. Lett. 151, 133 (1988)
- [14] W. Ketterle, H.-P. Messmer, and H. Walther, Europhys. Lett. 8, 333 (1989)
- [15] L. J. Lembo, A. Petit, and H. Helm, Phys. Rev. A39, 3721 (1989)
- [16] L. J. Lembo and H. Helm, Chem. Phys. Lett. 163, 425 (1989)
- [17] L. J. Lembo, D. Huestis, and H. Helm, J. Chem. Phys. 90, 5299 (1989)
- [18] U. Müller, U. Majer, R. Reichle, and M. Braun, JCP 106, 7958 (1997)
- [19] T. Amano, M.-C. Chan, S. Civis., A. R. W. McKellar, W. A. Majewski, D. Sadovskii, and J. K. G. Watson, Can. J. Phys. 72, 1007 (1994)
- [20] V. A. Mandelshtam and H. S. Taylor, J. Chem. Phys. 106, 5085 (1997).
- [21] H. Tal-Ezer and R. Kosloff, J. Chem. Phys. 81, 3967 (1984).
- [22] MIT Wavelength Tables, G. R. Harrison, Cambridge (1969)
- [23] D. H. Rank in Advances in Spectroscopy I, ed. H. W. Thompson, New York (1959)
- [24] D. Neuhauser and M. Wall, J. Chem. Phys. 102, 8011 (1995).
- [25] B. T. Sutcliffe and J. Tennyson, Intern. J. Quantum Chemistry 39, 183 (1991).
- [26] J. Tennyson and B. T. Sutcliffe, Mol. Phys. 56, 1175 (1985).
- [27] D. T. Colbert and W. H. Miller, J. Chem. Phys. 196, 1982 (1992).
- [28] R. F. Salzgeber, V. A. Mandelshtam, Ch. Schlier, and H. S. Taylor, 1997, to be submitted.
- [29] J. T. Hougen, J. Chem. Phys. 37, 1433 (1962).
- [30] W. A. Majewski, A. R. W. McKellar, D. Sadovskii, and J. K. G. Watson , Can. J. Phys. 72, 1016 (1994)
7 Tables
| Nr. | [cm-1] a | observed n | 2p b | upper state b | |
|---|---|---|---|---|---|
| 1 | 29601.0 | 0.015(8) | 20-80 | (0,0,0,0) | nd1 (0,0,1,0) |
| 2 | 29601.0 | 0.08(1) | 22-31 | (0,0,0,0) | ns1 (0,0,1,0) |
| 3 | 29535.1 | 0.014(1) | 8-71 | (0,1,0,1) | nd1 (0,1,1,1) |
| 4 | 29535.1 | 0.07(6) | 8-31 | (0,1,0,1) | ns1 (0,1,1,1) |
| 5 | 29547.8 | 0.015(1) | 7-46 | (1,0,0,0) | nd1 (1,0,1,0) |
a The statistical uncertainty of the fit procedure is smaller than the 0.2 cm-1 systematic uncertainty of the wavelength calibration
b The notation for the rovibrational state is (,,N,K)
| Peak | position | core vibration | n | ||
| A | 27248.3 | (1,0) | 29547.8a | 7 | 0.092 |
| B | 27299.3 | (1,0) | 29547.8a | 7 | 0.0143 |
| C | 27309.8 | (1,0) | 29547.8a | 7 | -0.0021 |
| E | 27807.3 | (1,0) | 29547.8a | 8 | 0.0600 |
| G | 27827.4 | (1,0) | 29547.8a | 8 | 0.0138 |
| C | 27309.8 | (2,0) | 31800.0b | 5 | 0.0566 |
a Series limit of series 5 in table 1
b (= 2, =0) ionization limit with respect to the
2p(= 1, =0) state of D3 calculated from the ionization
limit of series 5 and the molecular constants of D [19].
| vib. | H | H32p | D e | D32p | ||||||
| statea | ionb | th. c | th.-ion | exp. d | exp.-th. | ion e | th. c | th.-ion | exp. f | exp.-th. |
| (0,1)1 | 2521.416 | 2611.7 | 90.3 | 2618.34 | 6.6 | 1834.674 | 1898.8 | 64.1 | 1900.9 | 2.1 |
| (1,0)0 | 3178.177 | 3257.6 | 79.4 | 3255.38 | -2.2 | 2300.843 | 2353.3 | 52.5 | 2353.3 | 0.0 |
| (1,1)1 | 4778.228 | 4951.9 | 173.7 | 3530.385 | 3650.1 | 119.7 | ||||
| (0,2)0 | 4997.920 | 5181.5 | 183.6 | 3650.658 | 3777.1 | 127.1 | ||||
| (0,2)2 | 5554.029 | 5734.1 | 180.0 | 4059.470 | 4182.2 | 122.7 | ||||
| (2,0)0 | 6262.213 | 6426.6 | 164.4 | 4553.792 | 4661.6 | 107.8 | ||||
a the vibrational states (,)l are labelled by the number of quanta in the symmetric stretch mode , the degenerate mode , and the vibronic angular momentum l. The energy of the vibrationless (0,0)0 state was set to zero.
b molecular constants from ref. [30] .
c this work, data calculated from the fitted potential energy surface of ref. [2].
d experimental data, ref. [14].
e molecular constants from ref. [19] .
f experimental data, this work and ref. [18].
8 Figure captions


(a) Fano type resonance above the first ionisation threshold of the 2p(0,0,0,0) state of D3.
(b) Depletion spectrum with the labelling laser set to the maximum of the Fano resonance at 29652.6 cm-1 . The excitation laser was operated with the dye Coumarin 307 and scanned in the 19626.5 cm-1 to 19630.5 cm-1 frequency range.