Particle Identification Studies with an ALICE Test TPC
Abstract
Using a test TPC, consisting of the ALICE TPC field cage prototype in combination with the final ALICE TPC readout and electronics, the energy loss distribution and resolution were measured for identified protons. The measurements were compared to theoretical calculations and good quantitative agreement was found when detector effects were taken into account. The implications for particle identification are discussed.
1 Introduction
The ALICE Time Projection Chamber (TPC) is the main tracking detector in the central region of the ALICE heavy ion experiment at LHC [1]. In addition to excellent tracking capabilities, the TPC has particle identification (PID) capabilities through the measurement of the ionization. This is especially interesting in the region of the relativistic rise, ( GeV/c), where other ALICE detectors have little or no PID capabilities for pions, kaons, and protons. STAR has successfully used TPC PID on the relativistic rise to measure important features of heavy ion collisions in the regime of intermediate and high [2].
For PID with TPCs a major limitation is the calibration. So far much of the PID analysis has used phenomenological descriptions of the data, based on earlier experience rather than theoretical calculations. In this paper we compare results from a beam test with a theoretical model of the gas energy loss and comment on the advantage of such a study.
2 Model Description
In the model of Hans Bichsel [3], the calculation of the energy loss is based on the Fermi Virtual Photon concept, implemented by Allison and Cobb and elaborated by Bichsel. The straggling function (Landau distribution), , for the energy loss, , can then be determined for all track segments, , and ().
In general one has the bookkeeping problem that straggling functions
are not analytical functions and for different and
they are not related by a simple one parameter scaling. However, it
was shown in the paper ( [3], Section 8) that two
scaling parameters, and , can be
found so that:
.
In that way all
straggling functions (and associated truncated mean distributions) can
be approximated by one straggling function (here denoted for
generic) and a table of two parameter scaling
variables111Ignoring the high energy tail of the straggling
function one could possibly to a high degree of precision (see
Figure 9 and 10 in [3]) use only one relevant
parameter, the number of primary collisions ..
The ionization measured on the TPC pads is related to the energy lost by the charged particle as it traverses the gas, but there are in principle six steps – energy loss, energy deposition, ionization, electron transport, amplification, and AD conversion (see [3] p. 159) – which should be considered in going from energy loss of particles to the ADC output measured in the TPC. So one might ask to what extend the conclusions for the gas energy loss are also true for the experimental data:
[(ii)]
Does the energy loss spectra calculated in the model describe the measured charge spectra?
Can all relevant quantities for PID (such as the truncated mean distribution) be derived from the straggling function?
Is two parameter scaling applicable for experimental distributions?
3 Experimental Results
The results presented here were obtained with a test setup described in [4], where details of the analysis, and more results on electronics performance and spatial resolution, can also be found.
The data were collected with an ALICE Inner Read-Out Chamber (IROC) which has 63 pad rows with pad length of 7.5 mm each, resulting in a total track length of 472.5 mm (for the ALICE TPC there is also an Outer Read-Out Chamber (OROC)). The test TPC was operated with the newly proposed gas mixture (85.7-9.5-4.8) [5].
The tracks originated from a secondary beam of single particles from the CERN PS where the momentum, , of the beam was adjustable between 1 and 7 GeV/c with a resolution . The PID was obtained by a TOF setup that allowed the complete separation of pions and protons up to GeV/c. For each pad row a cluster was reconstructed and the cluster charge, , was determined as the sum of the signals in the cluster.
From the tracks the cluster charge straggling function, , was measured, and the “truncated mean” distribution, , was derived track by track from the average of the 60% lowest cluster charges.
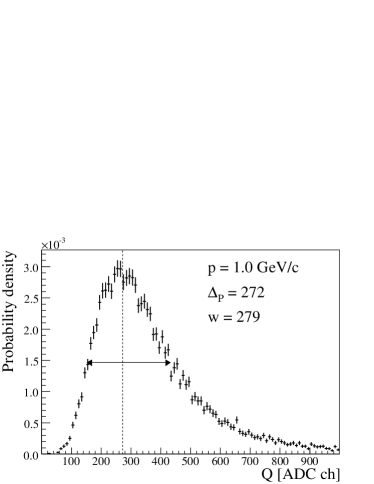
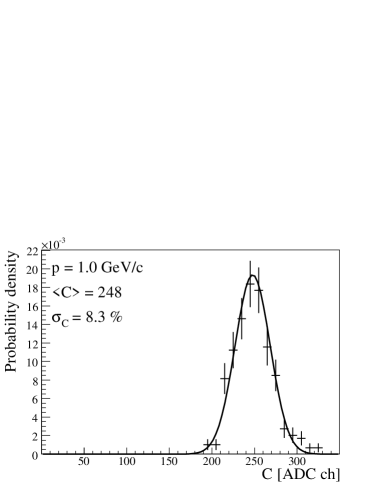

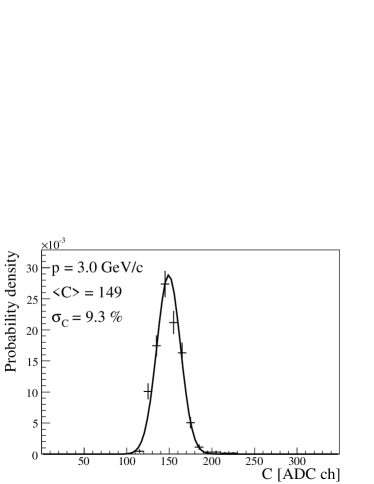
In the following we study protons with (294 tracks), and (614 tracks). This is a small subset of the beam test data with clean PID. The straggling data and the truncated mean distributions are shown in Figure 1. The probability of a true Gaussian fit to the two truncated mean distributions corresponding to and was found to be only 15 %, and 0.04 %, respectively, indicating that the truncated mean is not strictly Gaussian distributed, with a shoulder at higher clearly visible, especially in the 1 GeV/c data.
The energy loss resolution was found to be in agreement with that determined in the ALICE TPC Technical Design Report [1], when one takes into account that the track length in the full ALICE TPC is 3.3 times longer (IROC+OROC) than in the prototype (IROC).
4 Comparison with Model Calculations
In this section we use the measurements shown in Figure 1 and model calculations supplied by Hans Bichsel to study the questions outlined in section 2.
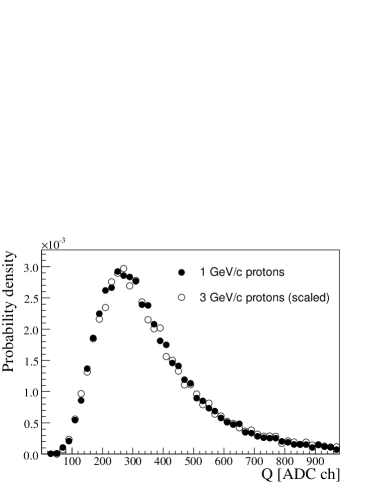
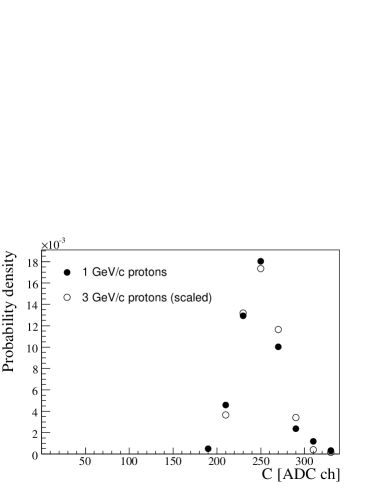
Figure 2 shows an overlap of the measured straggling
data for protons and the scaled measured
straggling data for protons (left), and similarly the
overlap of the two truncated mean distributions (right). The scaling
parameters were determined from the data. The close agreement
demonstrates the applicability of two-parameter scaling between
Minimum Ionizing Particles (MIPs) ( GeV/c protons) and particles
with an energy loss similar to that on the plateau ( GeV/c
protons has similar energy loss spectra as 1000 GeV/c protons (except
for the large tail)). Since the scaling works for the
smallest length scale (the pads in the OROCs are longer: 10 mm and
15 mm) and for the relevant energy loss range for high- PID, this
scaling is probably applicable to all relevant distributions.

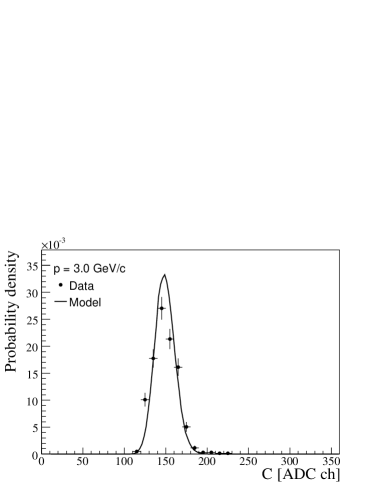
Figure 3 shows a comparison between the experimental cluster charge data and energy loss calculations for 3 GeV/c protons. The conversion factor (ADC ch/eV) is the only free parameter and has been adjusted to align the peaks; the overall normalization is fixed by requiring the integral to be unity. The agreement between the two straggling functions is reasonable, but the extracted resolution from the truncated mean is in the model and 9.3% for the data (Figure 1), leaving a discrepancy of .
This difference is also found when comparing the experimental straggling data to the experimental truncated mean distribution. If cluster charges are randomly generated with probabilities according to the experimental straggling data (shown in Figure 1) and a virtual track is constructed with the same number of clusters as for the data, the resolution is close to the 8 %, in agreement with the model, but not with the experimental results. The resolution of the real tracks is deteriorated because cluster charges are correlated; when cluster charges in neighboring pad rows are compared they exhibit a correlation factor, which reduces the generic information for the track.
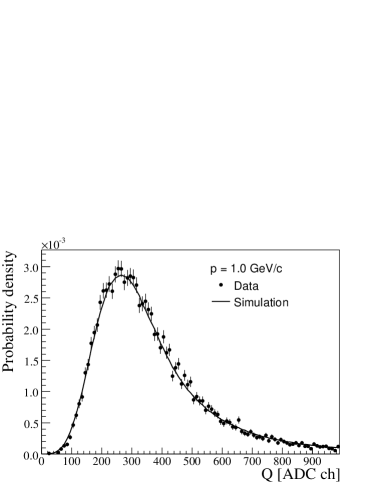

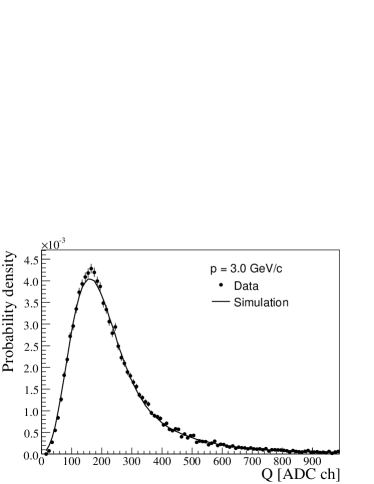

The correlations in the cluster data originate from detector effects during the six steps from energy loss to ADC output mentioned in section 2. Figure 4 shows the comparison between the data and the adjusted Bichsel model modified for diffusion (electron transport) and exponential gain amplification variations (amplification), see [4] for details. From the agreement we conclude that the energy loss mechanism and the two detector effects combined are sufficient to describe the data.
This method also fixes the adjustment of the gain to or an effective gas amplification gain of 9 600 (the fraction of the signal picked up by the pads).
If the simulated distributions are treated as fits to the truncated mean distributions, the probability of the model describing the data is 21 %, and 0.11 %, for the and data sets respectively. In both cases, the description of the data is better than the previous Gaussian fit functions in Figure 1 where, for each setting, there are two fit parameters to adjust. For the energy loss model the two gas gains differ by less than 3 % which could be due to gas density variations between the two runs.
5 Conclusion
We have found that it is possible to describe the test data with calculations from first principles when detector effects are taken into account. This good agreement between model and data led Hans Bichsel to propose an optimization of the ALICE Monte Carlo simulation [6].
The tracks are not fully characterized by their straggling functions since the cluster charges in a track are correlated. So it is not possible to directly use energy loss calculations to optimize PID. Note also that a fit to the cluster charges of a single track to extract e.g. the most probable energy loss as a PID estimator will face the same problems since the data are correlated, so that the fitting assumption of independent data is not fulfilled.
It is interesting to note that the two parameter scaling relation is still true for the experimental data. This might only be true in the case, as here, where one has almost identical track geometry, so that effects of diffusion are the same.
Even though the disagreement between the resolution derived from the experimental straggling data and the one measured from the truncated mean could have been found in the data, it was only realized after comparing to the model calculations, so we would like to stress that a quantitative precise model of the energy loss in gases is an important tool for calibrating and understanding a TPC (and any other gas detector).
6 Acknowledgments
The authors would like to thank Hans Bichsel for many valuable discussions on energy loss in gases, PID, and for supplying us with model calculations.
References
- [1] ALICE Collaboration, “Time Projection Chamber”, ALICE TDR 7, CERN/LHCC 2000-001.
- [2] B. I. Abelev et al. [STAR Collaboration], Phys. Rev. Lett. 97, 152301 (2006).
- [3] H. Bichsel, Nucl. Instrum. Meth. A 562, 154 (2006).
- [4] D. Antonczyk et al. [ALICE TPC Collaboration], Nucl. Instrum. Meth. A 565, 551 (2006).
- [5] C. Garabatos [ALICE Collaboration], Nucl. Instrum. Meth. A 535, 197 (2004).
- [6] H. Bichsel, Nucl. Instrum. Meth. A 566, 1 (2006).