Preprint of:
Katrina Y. T. Seet, Robert Vogel, Timo A. Nieminen,
Gregor Knöner, Halina Rubinsztein-Dunlop,
Matt Trau, and Andrei V. Zvyagin
“Refractometry of organosilica microspheres”
Applied Optics 46(9), 1554–1561 (2007)
©2001 Optical Society of America, Inc.
Refractometry of organosilica microspheres
Abstract
The refractive index of novel organosilica (nano/micro)material is determined using two methods. The first method is based on analysis of optical extinction efficiency of organosilica beads versus wavelength, which is obtained by a standard laboratory spectrometer. The second method relies on the measurable trapping potential of these beads in the focused light beam (laser tweezers). Polystyrene beads were used to test these methods, and the determined dispersion curves of refractive index values have been found accurate. The refractive index of organosilica beads has been determined to range from 1.60–1.51 over the wavelength range of 300–1100 nm.
I Introduction
Properties of (nano/micro)materials are shaped up by the bulk and structural properties of their building blocks, with an example being refractive index that determines the material’s optical characteristics. These optical properties need to be precisely controlled in various applications, such as sizing of organosilica (nano/micro)beads in the flow cytometry biological assaying. By manipulating the composition of materials on the nanoscale, new structural properties have been produced. For reliable production of desirable (nano/micro)materials both bulk and structural properties need to be controlled. Since bulk properties of the material can vary as a result of nanotechnological synthesis, it is important to monitor them in situ. In particular, silica-derived novel material, termed organosilica, have been synthesized in the form of (nano/micro)spheres, with a range of useful qualities that have been reported Miller200538 ; Miller200521 . Organosilica surface activation have appeared to be straightforward to bind oligonucleotide and peptide sequences for optical encoding and high-throughput screening via flow cytometry Miller200538 ; Miller200521 . The optical encoding method, however, demands tight margins on organosilica microspheres size and refractive index to ensure reliable readout and correct interpretation of their scattering intensities in the context of flow cytometry. However, it has been noticed that the refractive index of organosilica microspheres is highly dependent on synthesis route vanBlaaderen1993156 calling for a reliable refractometry method amenable for in situ implementation. Since the organosilica synthesis yields spherical particles ranging from 50 nm to 6 m, a number of existing refractometry methods applicable for bulk materials are no longer suitable for refractometry of this material. Among the suitable methods, an index matching method has been reported in a number of particle refractometry applications GarciaSantamaria200218 ; vanBlaaderen1993156 . In brief, particles in the solution do not scatter, i.e. rendering the sample clear, if refractive indices of the particles and solution are matched. Therefore, the solution refractive index read out at the sample maximum transmittivity provides a measure of the refractive index of the particle ensemble. Despite its conceptual simplicity, the method is tedious, requiring preparation of the new solution of predetermined refractive index per each experimental data point. The availability of suitable solutions with high refractive indices is usually limited.
The majority of existing refractometry methods for particles rely on the acquisition of optical scatter data, followed by their fitting to the theoretical model from which one can infer the particle refractive index, or its size, or both. For example, the determination of refractive index of an ensemble of microspheres have been demonstrated using holographic method of recording of the optical scatter Alexandrov200328 . The intensity of optical scatter has been parameterized in the Rayleigh scattering model to perform sizing of nanodiamonds Colpin200631 . Differential microscopy measurements of the optical scatter have also permitted detection of the minute cell organelle swelling, i.e. change in the scatterer’s size, as a result of induced apoptosis Boustany200126 .
Scattering spectroscopy provides another approach in the determination of particle refractive index in which characteristic particle optical extinction efficiency versus wavelength is determined Chen2003228 ; Chylek198322 ; Guimaraes199289 ; Scholz199883 ; Liu200530 ; Ma200348 . Usually, the acquired spectrum of monodisperse microsphere samples is fitted to a theoretical model with the refractive index and microsphere size as parameters. Using this method, the refractive index for a specified wavelength range, i.e. refractive index dispersion, can be determined. The application of the scattering spectroscopy technique to refractometry of cells, bacteria, and spores has been also reported Alupoaei200419 ; Callahan200337 ; GarciaSantamaria200218 ; Mattley200071 .
In this paper, we demonstrate the application of two refractometry methods to determine the refractive index of novel organosilica microspheres. Firstly, we report application of the refined scattering spectroscopy method, where we use a commercial laboratory Lamda40 spectrophotometer (Perkin Elmer) to measure the refractive index and dispersion of organosilica, following well-characterized polystyrene microsphere refractometry. Secondly, we demonstrate application of the recently reported method for measurement of the refractive index for single microparticles based on optical tweezers Knoner200697 . The two methods are compared, and a very good agreement is achieved.
II Experimental Method
II.1 Materials
Organosilica spheres were produced using a two-step process Miller200521 . This process involved the hydrolysis and subsequent condensation of thiol-based silica precursor. Aqueous solutions of 5.94 m organosilica microspheres, with the addition of sodium dodecyl sulphate for the prevention of agglomeration, were prepared for spectroscopy measurements. Polystyrene microspheres (ProSciTech, 5.0% w/v in water) of mean diameters of 2.01, 2.09 and 5.26 m, with a coefficient of variance (CV, defined as the standard deviation divided by the mean), of less than 2.4%, were diluted with MilliQ water. For the laser tweezers refractometry, 2.09 m polystyrene and 5.16 m organosilica microspheres were suspended in MilliQ water. Samples were prepared by placing a drop of the suspension between the microscope slide and cover slip and sealing the chamber with high viscosity silicon grease.
II.2 Methods
II.2.1 Scanning Electron Microscopy (SEM)
In order to characterize the size distribution of the synthesized organosilica microspheres, SEM was used. Samples were platinum coated and imaged using SEM (JEOL JSM 6400F) with accelerating voltage of 5–10 kV. The size distribution of the microspheres was obtained by processing the acquired images followed by statistical analysis.
II.2.2 Scattering Spectroscopy
In scattering spectroscopy, spherical particle extinction efficiency verses illumination wavelength (hereafter referred to as the scattering spectrum) was recorded. Recorded data were fitted to the theoretical model, where fitting parameters represented refractive index and size of the particle. To determine the best fit, the value, defined as the sum of the difference squared , was minimized. Although this method is simple and effective, the final best fit can be significantly unalike. This is due to the recording configuration, which should be a simple plane wave incident on a single spherical particle that cast a shadow on a small-size photodetector situated at a distance. The attenuation of the incident optical flux along the axis of incidence would be entirely due to light scattering by the particle, or in other words, the particle scattered light away from the photodetector. Under typical experimental conditions, however, illumination from an extended light source could not be regarded as the plane wave illumination. In addition, instead of a single particle, one has to account for an ensemble of particles, and a finite photodetector size.
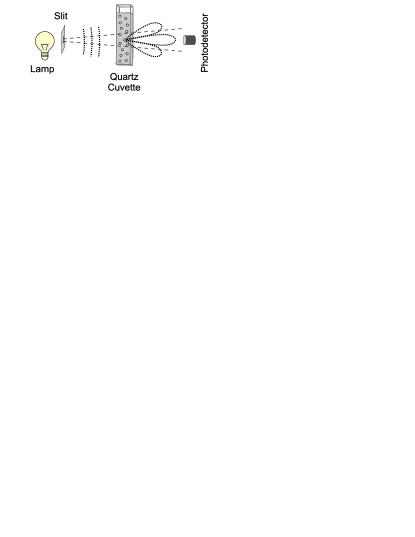
In this paper, we employed a commercial Lamda40 spectrophotometer (Perkin Elmer) to acquire sample extinction spectra. The sample was an aqueous suspension of polystyrene or organosilica microspheres in a square-profile (10 mm 10 mm) quartz cuvette. The concentration of the suspension was varied (average g/L) to ensure operation in the single-scattering regime without compromising the signal-to-noise ratio. Prior to spectroscopy, every suspension was ultrasonicated for 3 minutes to ensure uniform suspension of microspheres. To verify suspension uniformity, spectra measurements were repeated immediately after the first recording. Both spectra were identical, demonstrating no particle drift occurred during measurements. The cuvette was illuminated by a light source that produced a beam spot of approximately on the front facet of the cuvette, and was characterized by an angular divergence of . A halogen lamp was used as the light source, in the visible and near-infrared spectral range, whereas a deuterium lamp was used in the ultraviolet spectral range. The illumination light source wavelength was selected by means of three spectrally adjacent tunable diffraction gratings whose operation wavelength range spanned 300 - 1100 nm. The detector was a silicon photodetector with an area of approximately 49 mm2 calibrated for the wavelength range used. The source to detector configuration is shown in Fig. 1.
In addition, a cuvette with pure water was placed in the reference path of the spectrometer. Optical transmission spectra of the sample and reference were recorded over the wavelength range of 300 - 1100 nm, and each reference spectrum was subtracted from the sample spectrum to account for reflections, aberrations and the intrinsic absorption profile of the solvent and cuvette material. Scans were performed at a rate of 480 nm min-1 with a spectral resolution of 2 nm. Recorded data were digitized and transferred to a personal computer for further processing, archiving, and display. The recorded data were fitted to the theoretical scattering spectra, as detailed in the modelling method in Section III.
II.2.3 Laser Tweezers Refractometry
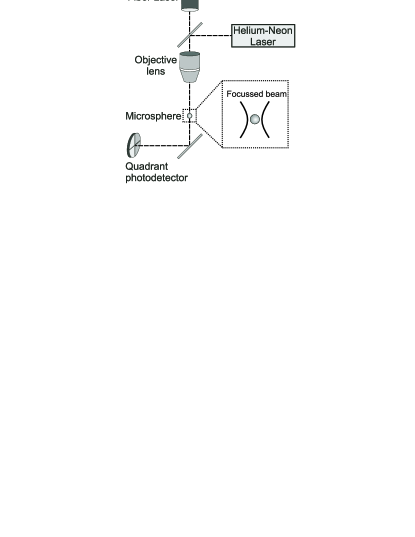
The second refractometry method is based on laser tweezers Ashkin198611 ; Knoner200697 . Here, we measure the particle trapping potential created by a high-power focused laser beam, as shown in Fig. 2. For a particle displaced by a small distance, , in transverse direction, the acting force, Fα, is measured. From this, the trap stiffness expressed in terms of the trap stiffness parameter, , is calculated by (measured in piconewtons per nanometre, pN/nm). This stiffness was calculated for a particle of specified size for a range of refractive indices of the particle. From the theoretical analysis of measured results, as described in Section III.2 we obtained the refractive index of the microsphere. In order to create the optical particle trap, the beam from a continuous-wave fiber laser (power 1 watt, wavelength nm) was focused to a diffraction-limited spot using an objective lens with high numerical aperture of 1.3. In order to detect the particle position in the beam, light from a helium-neon laser scattered by the particle was detected on a quadrant photodetector. Alternatively, the fiber laser was used both for trapping and tracking of the particle position. In both cases, the particle displacement from the trap centre generated a misbalanced photoelectrical signal on the photodetector quantifiable by means of the electronic signal processing Knoner200572 ; Lang200283 .
III Modelling Methods
III.1 Scattering Spectroscopy
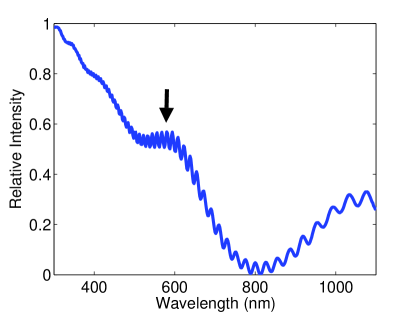
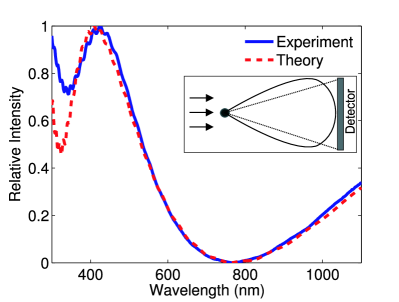
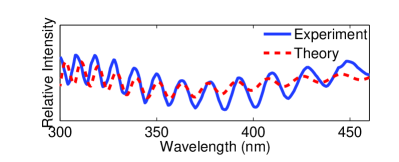
A typical scattering spectrum [Fig. 3(a)] exhibits three major features: ripples, local maxima, and a sloping curve. The ripple represents a small-contrast high-frequency sinusoidal signal superimposed on the large background signal. An example of the filtered ripple structure signal is shown in Fig. 3(b). This ripple signal is the result of interference between the incident and light internally reflected within the particle. It can provide an accurate measure of the product of microsphere diameter and refractive index . It is important to note that the ripple signal is detectable only if the sample is monodisperse and the size parameter, , is much greater than 1. Otherwise, the ripple structure of the signal is smeared and ultimately undetectable Chylek198322 ; Chylek19896 . The light source and detector configurations have little effect on the ripple structure of the scattering spectrum.
A local maxima, in Fig. 3(a). can be explained by the Lorenz-Mie scattering theory. In brief, it is due to interference of the incident and diffracted light at the particle-medium interface. A phase delay acquired by the diffracted light depends on the particle diameter and its relative refractive index , where is the refractive index of the medium. By thin film approximation and consideration of the optical path length difference, the spectral separation between the maxima of the scattering spectrum curve can be determined Scholz199883 :
| (1) |
where and stand for the adjacent peaks wavelength indices. We note that the fidelity of this relationship is affected by the source-detector configuration. However, in the context of our work, it provides a good estimation of particle refractive index.
The sloping curve representing the scattering spectrum is shown in Fig. 3(a) and is tailing towards the long wavelength side. This curve also stems from the Lorenz–Mie scattering theory. In brief, the optical scatter of a microsphere takes the form of scattering lobes. The larger the size parameter, the more pronounced and narrow its forward-scattering lobe. Alternatively, the shorter the wavelength of light incident on a sample of microspheres, the less power is scattered away from the photodetector, hence the greater intensity is detected. This consideration qualitatively explains the sloping trend of the recorded spectra, although accurate theoretical modelling is needed for precise fitting of experimental data to the theory, and is beyond the scope of this paper.
In order to obtain a dispersion curve for the refractive index, a Lorenz–Mie scattering model was used to calculate the extinction cross-section of monodisperse microspheres suspended in a homogeneous medium. These calculations assume an incident plane wave and a infinitesimally small-size far-field detector i.e. collection angle of zero vandeHulst1957 . Refractive index dependence on the wavelength was described by the Cauchy dispersion relation. Its general form is given by
| (2) |
where the Cauchy coefficients A, B (m2) and C (m4) are unique to the material Jenkins1976 . Using an unconstrained nonlinear optimization method implemented in Matlab, particle size and a dispersion curve of refractive indices over a wavelength range of 300–1100 nm were determined.
III.2 Optical tweezers refractometry
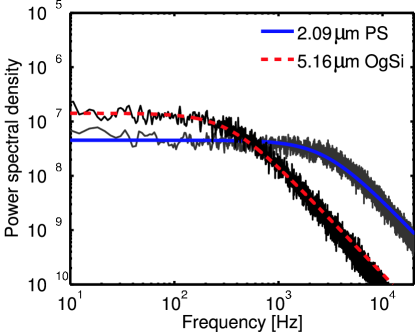
Optical tweezers refer to a technique of trapping a single microsphere immersed in fluid at the focus of a laser beam. It is well known that particles in fluid experience random Brownian motion. For a trapped microsphere, Brownian motion is suppressed, where the suppression efficiency is a monotonic function of the optical trap stiffness, , which in turn depends on the microsphere size and refractive index. Therefore, the analysis of the Brownian motion amplitude versus the controllable stiffness provides a basis for the determination of the particle refractive index. The Brownian motion amplitude is determined by detecting the microsphere position fluctuation in the trap, which is analysed in terms of its power spectrum amplitude. The roll-off frequency, , of this spectrum provides a reliable measure of the trap stiffness via the following relationship Knoner200697 :
| (3) |
where is the drag coefficient well tabulated for various fluids. relates to and . This dependence has been analysed in the framework of the generalized Lorenz-Mie theory and detailed elsewhere Knoner200697 ; Nieminen20045514 ; Nieminen200379 . Experimental measurement of and its comparison with the theoretical curve of versus at a fixed , yields the refractive index of the particle.
IV Results and Discussion
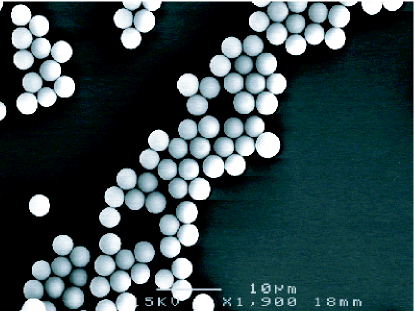
A low-dispersion particle sample is required for precise determination of refractive indices of microspheres by means of scattering spectroscopy. Fig. 4 shows a typical ensemble of organosilica microspheres imaged by SEM. The CV of organosilica microspheres was determined to be less than 10%, suitable for the scattering spectroscopy measurements.
| (a) | (a′) |
 |
 |
| (b) | (b′) |
 |
 |
| (c) | (c′) |
 |
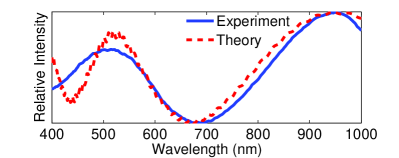 |
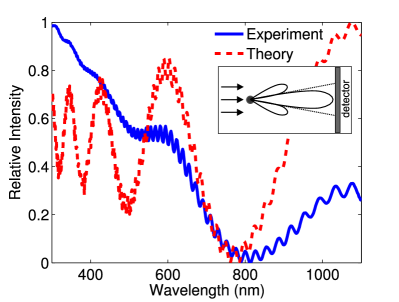
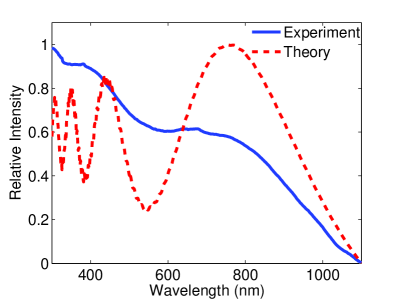
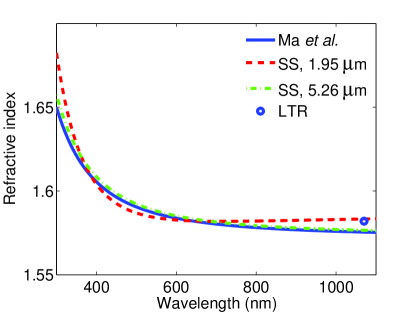
Organosilica microspheres with well controlled diameters could be produced in the size range of 1–6 m. In Fig. 5(a), (b), and (c), recorded and calculated spectra for 2.01 and 5.26 m polystyrene and 5.94 m organosilica microsphere samples, respectively, are presented. Large size organosilica microspheres were chosen to ensure the experimental spectra exhibited at least two maxima. In the case of the monodisperse 2.01 m polystyrene microsphere aqueous suspension sample, the recorded scattering spectrum was accurately fitted by the calculations using the Lorenz-Mie theory. The calculations of the dispersion of polystyrene refractive index are presented in Fig. 6(a). The theoretical fitting curve was parameterized in terms of the Cauchy coefficients (presented in Table 1), which shows very good agreement with those reported in the literature. We believe that the good agreement between the experimental and theoretical data was due to the relatively small sphere size, which forward-scattered incident light over wide angles. The evaluation of the 2.01 m polystyrene sphere scattering showed that the forward-scattering lobe overfilled the area of the photodetector for 390 nm, as illustrated in the Fig. 6(a) inset. This qualitative model also explains the discrepancy between theoretical and experimental data at 390 nm, where the next side-lobe incident on the detector interferes constructively with the original incident plane wave, unlike the forward-scattering lobe which interferes destructively (which is why extinction in the forward direction occurs). Therefore, the extinction is reduced in comparison with that calculated in the small photodetector approximation. Alternatively, one can view this in terms of the size parameter . In Fig 5(a), the introduction of the second side-lobe can be observed at an value of 17. The effect of multiple side-lobe interference is much more pronounced in the case of the scattering spectrum of 5.26 m polystyrene microspheres, shown in Fig. 5(b), and 5.94 m organosilica microspheres, shown in Fig. 5(c). Here, the maximum values are 15 and 17. The insets of Fig. 5(a) and (b) illustrate the detection scenarios for 2.01 and 5.26 m polystyrene sphere aqueous suspension, respectively. Obviously, reducing the detector size can avoid the collection of the side-scattering lobe. However, commercially available spectrometers have relatively large size detectors, which are designed to maximize detection sensitivity.
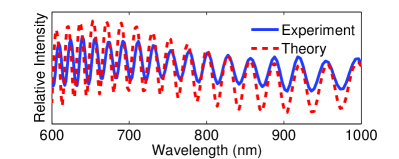
For an accurate theoretical model, which will result in precise fitting of measured data, a finite detector must be accounted for. However, this will require more complex Mie theory calculations and enormous computing power. Therefore to obtain maintain the simplicity of this method, we employ high pass filtering to isolate the ripple signal from the sloping curve of the recorded spectra. The results are presented in Fig. 5(a′) and (b′) for 2.01 and 5.26 m polystyrene microspheres, respectively. For the 5.26 m polystyrene sample, we used the ripple signal to determine the refractive index dispersion relationship, provided an independent measurement of the particle size could be made. For the organosilica microspheres, the ripple structure was not observable due to relatively large CV value. Therefore, we used the local maxima to determine their refractive index. The maximum was isolated by a high-pass filter to suppress the sloping feature of the recorded spectrum. The resultant spectrum is shown in Fig. 3(c′), and displays a reasonable agreement with the theoretical scatter spectrum.
| (a) |
 |
| (b) |
 |
| Microsphere | A | B | C | |
|---|---|---|---|---|
| (10m-2) | (10m-4) | (nm) | ||
| Ma et al. polystyreneMa200348 | 1.5725 | 3.1080 | 3.4779 | 390-1310 |
| 2.01 m polystryene | 1.5865 | -4.700 | 12.0 | 390-1100 |
| 5.26 m polystyrene | 1.5736 | 3.0499 | 4.0497 | 390-1100 |
| Fused SilicaMalitson196555 | 1.4492 | 3.1200 | 0.3670 | 200-2000 |
| Organosilica | 1.5169 | 0.4231 | 6.6304 | 430-1100 |
Multiple scattering, other than in the forward direction, was not accounted for in our modelling method. The effect of multiple scattering has been shown, in literature, to increase with optical depth (concentration) and gradually smoothes out the maxima and minima Cohen197514 . The spectra of solutions with increasing concentrations were recorded, and did not exhibit the effects of multiple scattering, which were observed in the work of Cohen (1975).
The refractive index of the microspheres was also measured using optical
tweezers refractometry. This method did not require monodisperse
suspensions since only a single particle was measured at a time. For
2.09 m polystyrene and 5.16 m organosilica microspheres, the
power spectrum amplitude of Brownian motion, shown in Fig.
7, was recorded, and the roll-off frequencies
determined. Using Eq. (2) and tabulated drag constants,
the trap stiffness was calculated, and is shown in Table
2. By using experimentally measured diameters of the
trapped polystyrene and organosilica microspheres we calculated
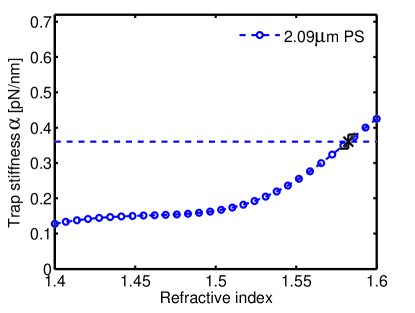
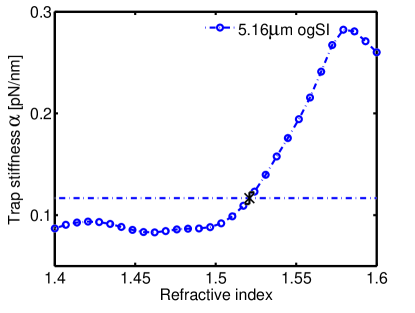
versus in the framework of the Lorenz-Mie scattering theory,
with the results presented in Fig. 8. The intersection of
the theoretical curves and corresponding horizontal lines of the
determined values of yielded the refractive index of the
trapped microspheres. For polystyrene microspheres, we obtained a
refractive index of = 1.58 0.01 at = 1070 nm.
This value deviates by a 0.6% from that given in
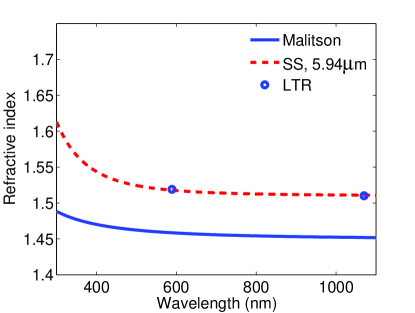
literature Ma200348 . For the organosilica microspheres, we
obtained refractive indices of 1.52 0.01 and 1.51 0.01 at
589 and 1070 nm respectively, which was in a good agreement with the
respective values of 1.518 and 1.511 obtained by the scattering
spectroscopy method. For comparison with the scattering spectroscopy
results, the refractive index values obtained by laser tweezers
refractometry are also shown in Fig. 6(a) and (b).
| Microsphere | (Hz) | (pN/nm) | (10-9pN/nm) |
|---|---|---|---|
| 2.09 m PS | 2714 | 0.31 | 19.72 |
| 5.16 m ogSI | 383 | 0.117 | 48.6 |
|
|
V Conclusions
The refractive index of organosilica microspheres was determined in the 300–1100 nm wavelength range using laser tweezers refractometry and a relatively simple scattering spectroscopy technique. The refractive index of organosilica has been found to range from 1.60–1.51 over the wavelength range of 300–1100 nm, which is considerably greater than that of the organosilica substrate, fused silica. The development of the refractometry methods addressed in this paper can be useful for accurate determination of nano(micro)material refractive index in situ, whereas the tabulation of refractive index of organosilica microspheres has important applications to biological screening using flow cytometry.
Acknowledgements
We acknowledge the support of OzNanoLife, which is a project supported by the International Science Linkage program (CG060027). This work was also supported by the Australian Research Council(DP041527 and FF0455861).
References
- (1) C. R. Miller, R. Vogel, P. P. T. Surawski, S. R. Corrie, A. Ruhmann, and M. Trau. Biomolecular screening with novel organosilica microspheres. Chemical Communications, 38:4783–4785, 2005.
- (2) C.R. Miller, R Vogel, P P T Surawski, K S Jack, S R Corrie, and M Trau. Functionalized organosilica microspheres via a novel emulsion-based route. Langmuir, 21(21):9733–9740, 2005.
- (3) A. van Blaaderen and A. Vrij. Synthesis and characterization of monodisperse colloidal organo-silica spheres. Journal of Colloid and Interface Science, 156:1–18, 1993.
- (4) F. Garcia-Santamaria, H. Miguez, M. Ibisate, F. Meseguer, and C. Lopez. Refractive index properties of calcined silica submicrometer spheres. Langmuir, 18(5):1942–1944, 2002.
- (5) Sergey A. Alexandrov, Andrei V. Zvyagin, K. K. M. B. Dilusha Silva, and David D. Sampson. Bifocal optical coherenc refractometry of turbid media. Optics Letters, 28(2):117–119, 2003.
- (6) Yannick Colpin, Amanda Swan, Andrei V. Zvyagin, and Taras Plakhotnik. Imaging and sizing of diamond nanoparticles. Optics Letters, 31(5):625–627, 2006.
- (7) Nada N. Boustany, Scot C. Kuo, and Nitish V. Thakor. Optical scatter imaging: subcellular morphometry in situ with fourier filtering. Optics Letters, 26(14):1063–1065, 2001.
- (8) K. Chen, A. Kromin, M. P. Ulmer, B. W. Wessels, and V. Backman. Nanoparticle sizing with a resolution beyond the diffraction limit using uv light scattering spectroscopy. Optics Communications, 228(1-3):1–7, 2003.
- (9) P Ch lek, V Ramaswamy, A Ashkin, and J M Dziedzic. Simultaneous determination of refractive-index and size of spherical dielectric particles from light-scattering data. Applied Optics, 22(15):2302–2307, 1983.
- (10) L. G. Guimaraes and H. M. Nussenzveig. Theory of mie resonances and ripple fluctuations. Optics Communications, 89:363–369, 1992.
- (11) S Scholz, R Vacassy, J Dutta, H Hofmann, and M Akinc. Mie scattering effects from monodispersed zns nanospheres. Journal of Applied Physics, 83(12):7860–7866, 1998.
- (12) Y. Liu. Elastic backscattering spectroscopic microscopy. Opt. Lett., 30(18):2445–2447, 2005.
- (13) X Y Ma, J Q Lu, R S Brock, K M Jacobs, P Yang, and X H Hu. Determination of complex refractive index of polystyrene microspheres from 370 to 1610 nm. Physics in Medicine and Biology, 48(24):4165 – 4172, 2003.
- (14) C E Alupoaei, J A Olivares, and L H Garcia-Rubio. Quantitative spectroscopy analysis of prokaryotic cells: vegetative cells and spores. Biosensors and Bioelectronics, 19(8):893–903, 2004.
- (15) Michael R Callahan, Joan B Rose, and Luis Garcia-Rubio. Use of multiwavelength transmission spectroscopy for the characterization of cryptosporidium parvum oocysts: quantitative interpretation. Environmental Science & Technology, 37(22):5254–61, 2003.
- (16) Yvette Mattley, German Leparc, Robert Potter, and Luis Garcia-Rubio. Light scattering and absorption model for the quantitative interpretation of human blood platelet spectral data. Photochemistry and Photobiology, 71(5):610–619, 2000.
- (17) G. Knöner, S. Parkin, T. A. Nieminen, N. R. Heckenberg, and H. Rubinsztein-Dunlop. Measurement of refractive index of single microparticles. Physical Review Letters, 97(15):157402, 2006.
- (18) A. Ashkin, J. M. Dziedzic, J. E. Bjorkholm, and Steven Chu. Observation of a single-beam gradient force optical trap for dielectric particles. Optics Letters, 11:288–290, 1986.
- (19) G. Kn ner, S. Parkin, N. R. Heckenberg, and H. Rubinsztein-Dunlop. Characterization of optically driven fluid stress fields with optical tweezers. Physical Review. E, 72:031507, 2005.
- (20) Matthew J. Lang, Charles L. Asbury, Joshua W. Shaevitz, and Steven M. Block. An automated two-dimensional optical force clamp for single molecule studies. Biophysical Journal, 83(1):491–501, 2002.
- (21) Petr Chýlek and Jiyu Zhan. Interference structure of the mie extinction cross section. Journal of the Optical Society America, 6(12):1846–1851, 1989.
- (22) H. C. van de Hulst. Light scattering by small particles. Wiley, New York, 1957.
- (23) F. A. Jenkins and H. E. White. Fundamentals of optics. McGraw-Hill, New York, 4th edition, 1976.
- (24) T. A. Nieminen, N. R. Heckenberg, and H. Rubinsztein-Dunlop. Computational modelling of optical tweezers. In Kishan Dholakia and Gabriel C. Spalding, editors, Optical trapping and optical micromanipulation, volume Proc. SPIE 5514, pages 514–523, 2004.
- (25) T. A. Nieminen, H. Rubinsztein-Dunlop, and N. R. Heckenberg. Multipole expansion of strongly focussed laser beams. Journal of Quantitative Spectroscopy and Radiative Transfer, 79-80(1):1005–1017, 2003.
- (26) I. H. Malitson. Interspecimen comparison of the refractive index of fused silica. Journal of the Optical Society of America B, 55(10):1205–1209, 1965.
- (27) Ariel Cohen. Multiple scattering measurements as a function of wavelength by use of a dye laser. Applied Optics, 14(2):268–269, 1975.