Electron acceleration by colliding laser beams in plasmas
Abstract
All-optical controlled injection and acceleration of electrons in a laser wakefield has recently been achieved faure2006 . Injection was made using a second counterpropagating laser pulse with the same polarization as the main pulse . In this scheme, the interference pattern formed during the collision between the pulses pre-accelerates electrons that are then trapped in the wakefield. Numerical simulations of this process performed with a new Particle-in-Cell code are presented here. The results show the nature of the injection mechanism and explain some striking features found experimentally, such as the dependence of beam energy with the collision position and the reduction of the charge at high energies. Simulations reproduce well the main features of the experimental observations.
pacs:
52.38.Kd, 52.59.-fThe field of laser-plasma wakefield acceleration has known a fast development over the past few years. In this approach, particles are accelerated in the relativistic plasma wave excited by an intense laser propagating in a underdense plasma. Electric fields in the wake can reach some hundreds of GeV/m instead of the tens of MeV/m attainable in conventional RF accelerators, opening the door to a new generation of compact particle accelerators. Up to now, a single laser beam was responsible for the injection and subsequent acceleration of the electrons malka2002 ; mangles2004 ; geddes2004 ; faure2004 . Very recently, the external injection of electrons in the wakefield using a second laser beam has been demonstrated faure2006 . Electron beams obtained in this manner are quasi-monoenergetic, tuneable and stable.
The idea of using a second laser to inject the electrons was proposed years ago umstadter1997 , and further developed in the scheme implemented in the experiments esarey1997 . In this version, two counterpropagating laser pulses with the same wavelength and polarization are used. The first pulse (the pump pulse), with normalized amplitude , creates a wakefield. The second pulse (the injection pulse), with normalized amplitude , collides with the pump pulse. During the collision, a laser beatwave pattern with phase velocity is formed esarey1997 . The scale of the beatwave pattern is , therefore the ponderomotive force of the beatwave is very large. This very large ponderomotive force pre-accelerates electrons. A fraction of them is then trapped in the wakefield (depending on the values of and ) and subsequently accelerated to relativistic energies.
Previous numerical studies of colliding pulse injection deal with fluid descriptions of the plasma (valid for normalized laser amplitudes ) and test particle treatment for the injected electrons fubiani2004 , or one-dimensional kinetic simulations kotaki2004 . We will show that a realistic description of the process requires to include 3D beam dynamics issues, including self-focusing sun1987 and self-compression faure2005 of the pump pulse as well as a correct description of the electric radial wake field and beam loading effects. In previous studies these effects were absent or not well described due to the use of low dimensions.
In order to deal with this problem without a full three-dimensional kinetic simulation, we have developed a new Particle-in-Cell code with an hybrid cylindrical-geometry scheme. Maxwell equations are written in axisymmetric cylindrical coordinates (), with the direction of propagation of the laser beams. Particles evolve in tridimensional space. To calculate the sources of the Maxwell equations (the density and the current ), tridimensional particle information, i.e. position () and velocity (), is projected over the grid.
The laser pulses are not described as ordinary electromagnetic fields but via their envelope, . Each laser beam is taken as a monochromatic plane wave of frequency and wavenumber modulated by the envelope amplitude . To calculate the laser electromagnetic field over a given particle, we interpolate the amplitudes of the pump and injection beams ( and respectively) from the grid over the particle position (), and multiply this by the high-frequency component. If both pulses are counterpropagating and linearly polarized in , the normalized electric and magnetic laser fields are given by
| (1) |
with and arbitrary phases, that we set to zero. Note that the high-frequency laser field is not calculated over the grid but over each particle, so that the mesh size can be larger than , reducing drastically the computational cost. On the other hand, the timestep is limited by . When the pulses do not overlap, the wakefield created by each laser beam is similar to the one obtained using the ponderomotive force , i.e. the wakefield is axially symmetric. Therefore, the assumption of axial symmetry constitutes a valid approximation. However, the inspection of electrons trajectories during the beatwave shows that the symmetry is partially broken in the collision region. The spatial distribution of electrons trapped in the vicinity of the laser pulse also exhibits a degree of asymmetry mangles2006 . We will discuss later the importance of this lack of symmetry.
The pump pulse envelope is calculated using the envelope equation given in mora1997 . The injection pulse is slightly self-focused (the maximum amplitude is instead of ). For the sake of numerical simplicity, we have neglected self-focusing of the injection pulse and have considered that it is the analytical solution of the envelope equation in vacuum. This is justified because simulations show that injection is weakly dependent on the amplitude of the injection pulse in the range .
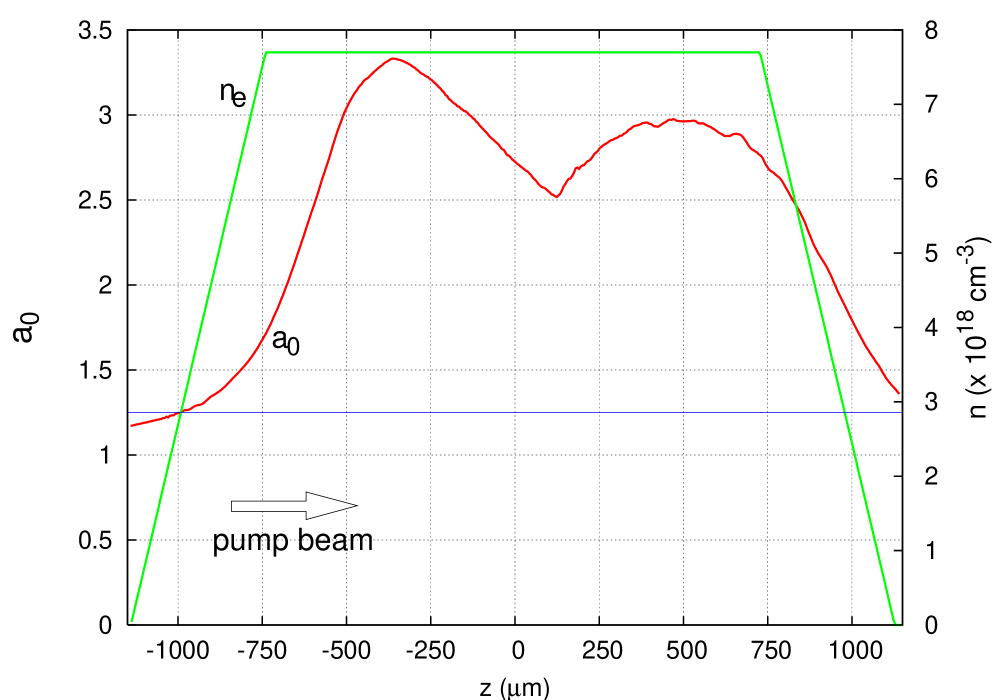
Parameters of the simulations we have performed correspond to the experiments recently performed at LOA faure2006 . The pump laser energy is 700 mJ, m, pulse duration 30 fs and spot size FWHM 16 m, corresponding to an intensity , a normalized amplitude and a Rayleigh length mm. The injection pulse energy is 250 mJ, m, pulse duration 30 fs and spot size FWHM 30 m, corresponding to , and mm. The plasma density profile (figure 1) is close to the experimental one. The evolution of the pump beam amplitude as the beam propagates along the plasma is shown in figure 1. The beam propagates from left to right and its focal plane is at m (the center of the jet is at ). The focal amplitude in vacuum () is indicated by the horizontal straight line. As we can see, the pump beam start being self-focused in the density ramp at the beginning of the jet, reaching a maximum of at m. From this point, the beam diverges and it is again self-focused in the second half of the jet. The density in the exit ramp of the jet is too low to counter beam diffraction. The pulse is also self-compressed, reaching a duration of about 20 fs at the exit.
Simulations made without the injection beam indicate the existence of a small degree of self-injection. The spectrum of self-injected electrons is flat between 20 and 300 MeV , with a total charge of pC. Electrons are trapped far from the laser, beyond the third wake period.
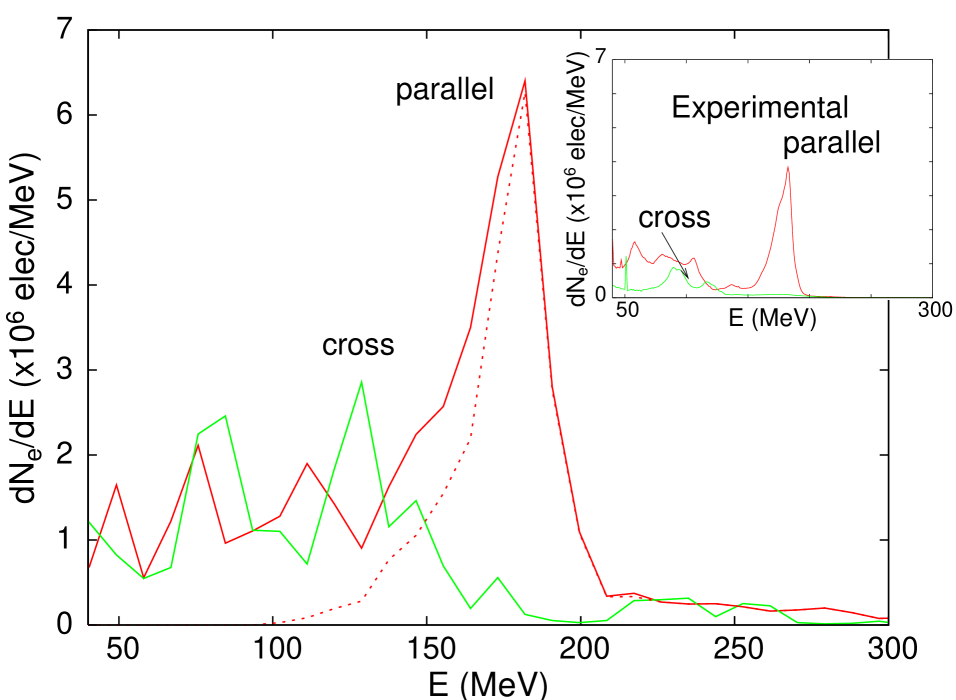
When an injection beam with parallel polarization is included, a fraction of the electrons present during the beatwave between the pulses is trapped in the wakefield, its total charge ranging between 50 pC and 200 pC. Most of the electrons are trapped in the bubble (we use the term “bubble” to refer to the first bucket of the wakefield structure, although in the present study laser intensities are not high enough to reach the bubble regime), and they contribute to the energy spectrum as a high energy narrow peak (figure 2). When the polarizations are crossed, it is also possible to trap some electrons, although the high energy peak disappears and the charge is divided by . These electrons are grouped in several bunches and they are far from the laser (the closest bunch is in the fourth wake period). The energy spectrum is broad, with several peaks corresponding to electrons trapped in different bunches (figure 2). A similar trend has been observed in the experiments, i.e. spectra with a high energy peak for parallel polarization and lower charge multi-peaked or wide spectra for cross polarization (inset in figure 2). A good agreement between simulation and experiment is found. However, the charge is slightly overestimated in the simulations as well as the relative energy spread.
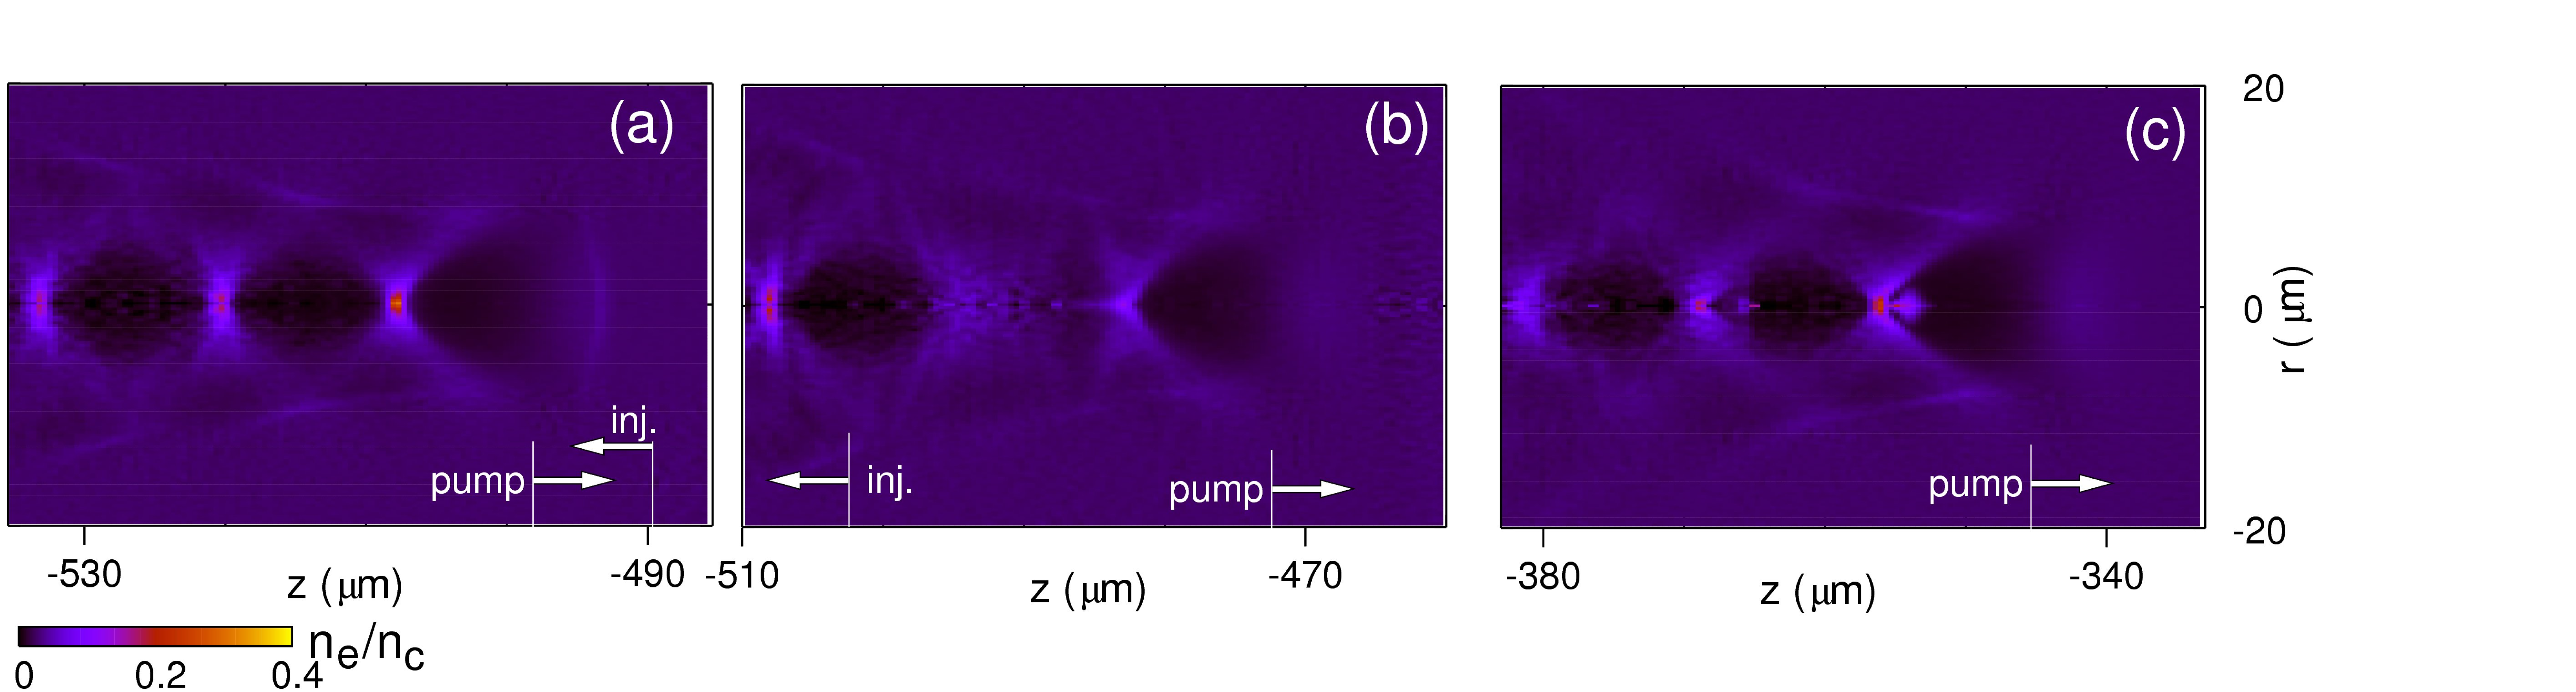
The trapped charge for parallel polarization is small compared with predictions made by previous models fubiani2004 . The reason of this low charge is that the beatwave is strong enough to locally destroy the wakefield. Most of the particles that were pre-accelerated by the beatwave are not trapped simply because during the collision, there is no accelerating nor radial field to trap them. Only the electrons accelerated at the end of the collision reach the pulse back late enough to find a newly generated wakefield structure. Figure 3 illustrates this phenomenon. It shows the spatial distribution of electronic density before the collision (3.a), shortly after the collision (3.b) and for a later time (3.c). As we can see, before the collision a periodic wake structure exists. Once the collision takes place, the region of the wakefield where the beatwave occurred is strongly distorted. The short scale () ponderomotive force associated with the beatwave is stronger than the long range () ponderomotive force of the pump laser, and no coherent movement of the electrons in the scale of takes place. Therefore, the plasma wave is not excited in this region and no wake is formed. As the pump beam moves away from the collision region, the wake is reformed and the bunch of electrons trapped in the bubble becomes clearly visible (figure 3.c). We have made simulations in which the longitudinal and transverse wakefield were artificially frozen shortly before the collision, i.e. the wakefield is unaffected by the beatwave. We have found that the charge injected in the bubble is multiplied by a factor . For example, for collision at m, the charge in the bubble raises from 30 pC to 300 pC.
In the following we compare the numerical predictions for parallel polarization with experimental results. Figure 4.a shows the energy of the monoenergetic peak as a function of the collision position, along with the experimental results. When the spectrum presents more than one peak, the highest energy peak is chosen. Except for the earliest collision case (m), the final energy decreases with , i.e. a shorter acceleration distance corresponds to a lower final energy. We can see that there is a good agreement between the simulations and the experimental data, even though the theoretical curve is shifted to the left by m.
When the collision between the pump and the injection beams takes place close to the beginning of the plateau (m), no extra energy gain can be obtained. In this region, the pump pulse amplitude grows quickly (figure 1). As the laser field becomes stronger, the plasma wavelength progressively stretches due to the relativistic redshift of the plasma frequency, i.e. the wakefield slows down lifschitz2005 . Trapped electrons are then able to overcome the wakefield, moving farther from the maximum of accelerating field.

The experimental charge in the monoenergetic peak (figure 4.b) decreases with the peak energy, and it exhibits a drastic drop above 100 MeV. The same trend is found in the simulations, although the charge is overestimated by a factor between . Here again, the theoretical curve is shifted to lower . Simulations show that the number of trapped electrons remains almost unchanged after the collision. Therefore, the reduction of the charge with the energy is not due to an extra loss of trapped electrons along the longer acceleration path.
The injected charge is firstly determined by the pump laser amplitude () that grows between and m due to self-focusing (figure 1). For m, the trapped charge continues to grow even when the laser amplitude starts to decrease. This is due to the progressive self-compression of the pump pulse, that drives the wake more efficiently. Besides this, simulations show that for a given amplitude of the longitudinal field, the self-compressed and distorted pulse is able to trap more electrons. Further study is required to understand the larger trapping of self-compressed pulses.
A second factor can play a role in the steep drop of the peak charge above 100 MeV. At high energies ( MeV), the peak corresponding to the electrons in the bubble is clearly distinct from the contribution of the other electrons. At low energies, these contributions partially overlap, originating a larger peak.
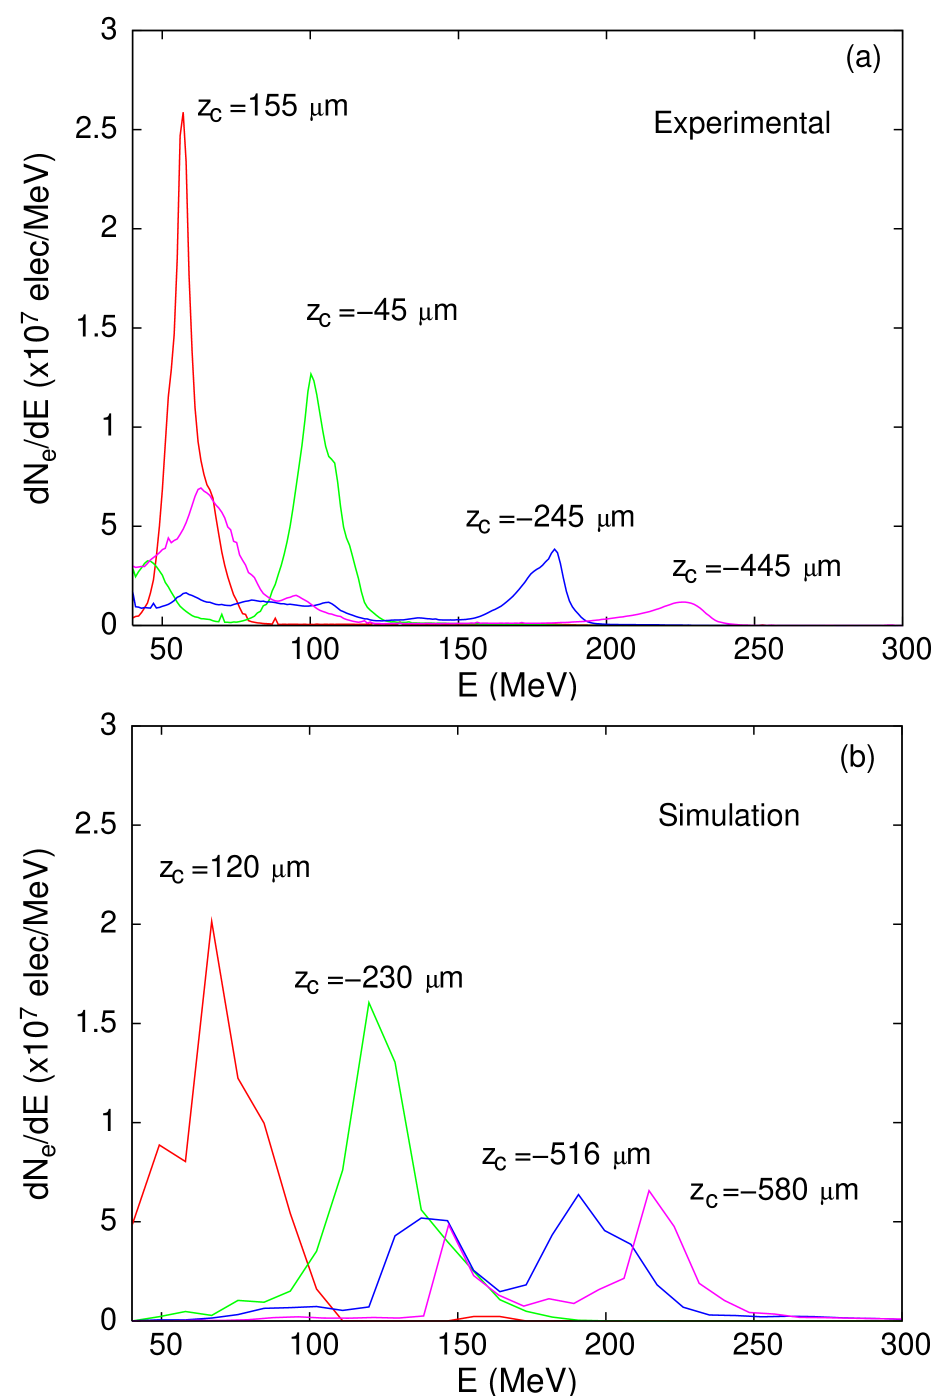
Figure 5 shows experimental spectra and simulation results for selected collision positions. Spectra includes typically the high energy peak tuned by the collision position plus a low energy component. In the simulations, the high energy peak corresponds to the electrons in the bubble. For low energies ( MeV), the contribution from electrons inside and outside the bubble overlaps, resulting in a single peak . The separation between the high energy peak and the low energy region is much clearer in the experimental spectra than in the theoretical curves.
The simulations we have presented underline the role played by a number of effects in the determination of the electron beam properties. The increase of laser intensity due to self-focusing accounts for the very high acceleration gradients inferred from experimental data. In addition to that, self-focusing, along with pulse shortening due to self-compression, enhances the trapping and therefore, the charge of the accelerated bunches. On the other hand, the wake destruction due to the beatwave reduce drastically the accelerated charge. According to simulations, the high energy quasi-monochromatic peaks found experimentally correspond to a single and short electron bunch accelerated in the bubble. Bunch length predicted by the simulations ranges between 10 fs FWHM at 60 MeV and 7 fs FWHM at 220 MeV.
The good agreement between simulations and experiments indicates that the assumption of axial symmetry constitutes a good approximation. Nevertheless, this approximation can be partly responsible for the overestimation of the charge in the simulations, because the projection of particle density over () could reduce to some extent the degree of wake destruction caused by the beatwave. The second source of asymmetry is the presence of energetic particles in regions where the laser field is significant. Due to the relatively modest charge of the bunches in the bubble as well as the shortening of the pump pulse due to self-compression (that reduces the laser intensity over the bunch), the relevance of this effect should be small.
We acknowledge the support of the European Community Research Infrastructure Activity under the FP6 Structuring the European Research Area program (CARE, contract number RII3-CT-2003-506395).
References
- (1) J. Faure, C. Rechatin, A. Norlin, A. Lifschitz, Y. Glinec and V. Malka, Nature 444, 737 (2006).
- (2) V. Malka, et al., Science 298, 1596 (2002).
- (3) S. P. D. Mangles, et al., Nature, 431, 535 (2004).
- (4) C. G. R. Geddes, et al., Nature, 431, 538 (2004).
- (5) J. Faure, et al., Nature, 431, 541 (2004).
- (6) D. Umstadter, J.-K. Kim and E. Dodd, Phys. Rev. Lett. 76, 2073 (1996).
- (7) E. Esarey, R.F. Hubbard, W.P. Leemans, A. Ting and P. Sprangle, Phys. Rev. Lett. 79, 2682 (1997).
- (8) G. Fubiani, E. Esarey, C.B. Schroeder, and W. P. Leemans, Phys. Rev. E 70, 016402 (2004).
- (9) H. Kotaki, S. Masuda, M. Kando, J.K. Koga, and K. Nakajima, Phys. Plasmas 6, 3296-3302 (2004).
- (10) G. Sun, E. Ott, Y.C. Lee, and P. Guzdar, Phys. Fluids 30, 526-532 (1987).
- (11) J. Faure, et al., Phys. Rev. Lett. 95, 205003 (2005).
- (12) S.P.D. Mangles et al, Phys. Rev. Lett. 96, 215001 (2006)
- (13) P. Mora and T.M. Antonsen, Phys. Plasma 4, 217 (1997)
- (14) A. Pukhov and J. Meyer-ter-Vehn, Appl. Phys. B 74, 355-361 (2002)
- (15) A. Lifschitz, J. Faure, V. Malka and P. Mora, Phys. Plasmas 12 0931404 (2005).