The X-ray Telescope of CAST
Abstract
The Cern Axion Solar Telescope (CAST) is in operation and taking data since 2003. The main objective of the CAST experiment is to search for a hypothetical pseudoscalar boson, the axion, which might be produced in the core of the sun. The basic physics process CAST is based on is the time inverted Primakoff effect, by which an axion can be converted into a detectable photon in an external electromagnetic field. The resulting X-ray photons are expected to be thermally distributed between and . The most sensitive detector system of CAST is a pn-CCD detector combined with a Wolter I type X-ray mirror system. With the X-ray telescope of CAST a background reduction of more than 2 orders of magnitude is achieved, such that for the first time the axion photon coupling constant can be probed beyond the best astrophysical constraints .
pacs:
95.35.+d 95.55.Aq 95.55.K 95.55.-n 14.80.Mz 07.85.Nc 07.85.Fv 07.85.-m 84.71.Ba1 Introduction
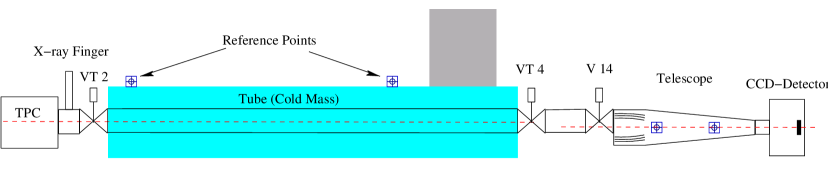
The CERN Axion Solar Telescope - CAST, searches for a pseudoscalar particle, the axion. The axion was motivated by theory as a solution of the strong CP problem almost 30 years ago. [peccei:77a, wilczek:78a, weinberg:78a]. One of the most important properties of the axion is its coupling to two photons with a strength given by the coupling constant . This coupling would allow the production of axions inside the sun via the Primakoff effect () resulting in an axion flux proportional to . The axion energy spectrum would be thermally distributed peaking at about , reflecting the temperature distribution in the core of the sun [sikivie:83a, bibber:89a, andriamonje:07a]. In the presence of a transverse magnetic field of length solar axions convert to observable X-rays via the time reversed Primakoff effect with a probability within the limit of negligible momentum transfer . In CAST we use a long superconducting dipole magnet with an acceptance region of providing a homogeneous transversal magnetic field to search for solar axions. The magnet is mounted on a movable platform which allows to follow the track of the sun for about per day. On each end of the magnet background optimized X-ray detectors are installed, looking for photons from axion conversion inside the magnet tube. While the time projection chamber (TPC) [autiero:06a] observes the sun during sunset, the X-ray telescope and the Micromegas detector [andriamonje:06a, charpak:02a, giomataris:96a] are looking for axions during sunrise. Figure 1 shows a side view of the CAST magnet and the detector setup. The Micromegas detector which is installed next to the X-ray telescope is not shown in this picture.
For given magnet parameters, the sensitivity of the experiment solely depends on counting statistics. The expected count rate from axion to photon conversion for the X-ray telescope of CAST in the energy range of to (spot region) is:
| (1) |
including the effective area of the X-ray telescope system (). Taking a mean observation time of the sun of into account, the expected signal count rate reduces to . Thus as in other rare event experiments background reduction is indispensable to maximize the sensitivity of the experiment to detect a potential signal.
In this paper we report on the performance, design, and shielding concept of the X-ray telescope. For a detailed introduction to the CAST experiment we refer the reader to \citeasnounandriamonje:07b. First results of CAST from the 2003 and 2004 data taking period were published by \citeasnounzioutas:05a and \citeasnounandriamonje:07a. The remainder of this paper is structured as follows: In section 2 we give a detailed description of the design of the X-ray mirror telescope of CAST including the pn-CCD detector, its calibration, and the alignment of the optical system relative to the magnet tube. In section 3 we present the long term performance of the system and systematic detector background studies. We summarize our paper in section 4.
2 The X-ray Mirror Telescope of CAST
Since the axion to photon conversion inside the magnet tube conserves the axion energy and momentum in first order approximation, the resulting X-ray beam would leave the magnet bore with a divergence given by the angular size of the axion producing region of the sun which extends from the center of the sun to of the solar radius. The resulting X-ray flux can then either be observed directly with a detector covering the magnet bore, as it is the case for the Micromegas detector and the TPC of CAST, or it can be focused with an X-ray optics onto a focal plane detector with a high spatial resolution. The advantage of the latter approach is twofold, additional background suppression by a factor of due to the focusing of the potential signal from the magnet acceptance area of to a small spot of . Furthermore, due to the imaging capability an axion image of the sun could be acquired and systematic effects can be reduced by measuring the background and a potential signal simultaneously, taking the photon counts outside the area where the axion signal would be expected into account. The CAST X-ray telescope is based on the concept of a Wolter I mirror optics [wolter:52a] which is a well-known technology used in X-ray Astronomy (e.g., the Einstein, Exosat, Rosat, Chandra, and XMM-Newton X-ray observatories) and is a spare module which was originally built for the X-ray mission ABRIXAS [altmann:98a, egle:98a]. The focal plane detector is a pn-CCD of the type successfully being used for more than 7 years for ESA’s X-ray satellite XMM-Newton [strueder:01a]. The design and performance of the system will be described in the following sections.
2.1 The X-ray Mirror System
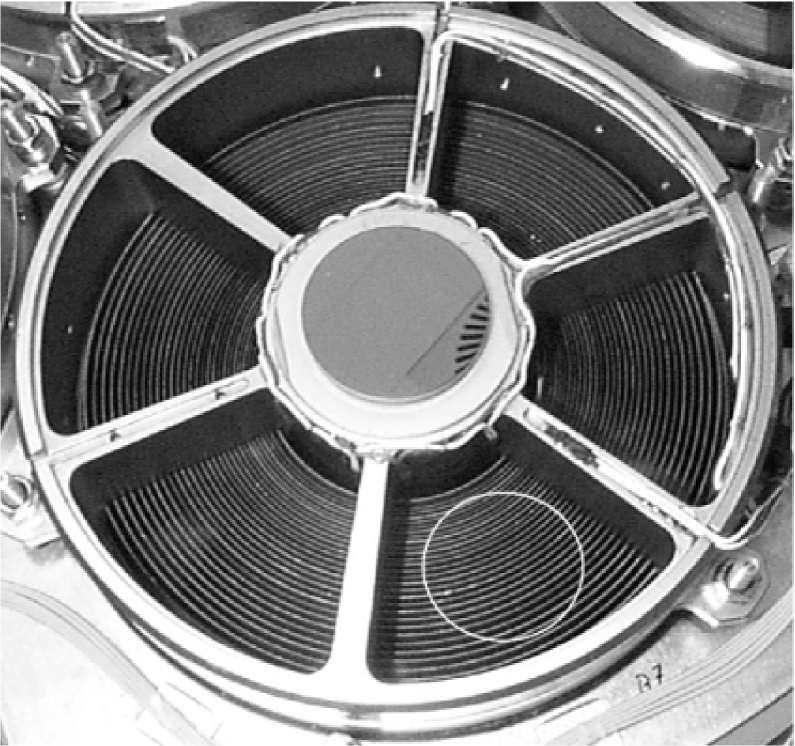
The CAST X-ray mirror system (see figure 2) is a Wolter I type telescope consisting of 27 nested, gold coated, and con-focally arranged parabolic and hyperbolic nickel shells with a focal length of [friedrich:98a]. The maximum diameter of the outermost mirror shell is while the smallest shell has a diameter of . The individual mirror shells are nested in a spoke structure subdividing the mirror aperture into 6 azimuthal sectors (see left image of figure 3). Since the diameter of the bore of the CAST magnet () is much smaller than the diameter of the outermost mirror shell, the telescope is mounted off-axis such that only one of the six mirror sectors is used for imaging (see figure 3, the projected size of the magnet bore is indicated by the white circle). For the application of CAST, the asymmetric illumination of the mirror aperture has the positive side effect that shadowing effects caused by the spoke structure do not occur in our setup.
The overall performance of such an X-ray mirror system for a given focal length mainly depends on two parameters, the effective area and the spatial resolution, given by the point spread function (PSF). In general, the effective area for a given mirror coating is a function of the off-axis angle, the micro-roughness of the mirror surfaces, and the photon energy. It decreases with increasing micro-roughness, photon incidence angles (lower reflectivity), and due to geometric effects (vignetting).
The effective area of the CAST mirror system has been predicted by means of ray-tracing simulations. The algorithm was developed for the ABRIXAS mirror system and has been adapted to the CAST setup. For a given coating material, i.e., gold in our case, the ray-tracing simulations return the effective area and the point-spread function, both as a function of the photon energy and the off-axis angle. The micro-roughness of the mirror surfaces has been assumed to be (rms) which is a typical value for the ABRIXAS mirrors. However, the influence of scattering effects due to the micro-roughness of the reflective surface are almost negligible.

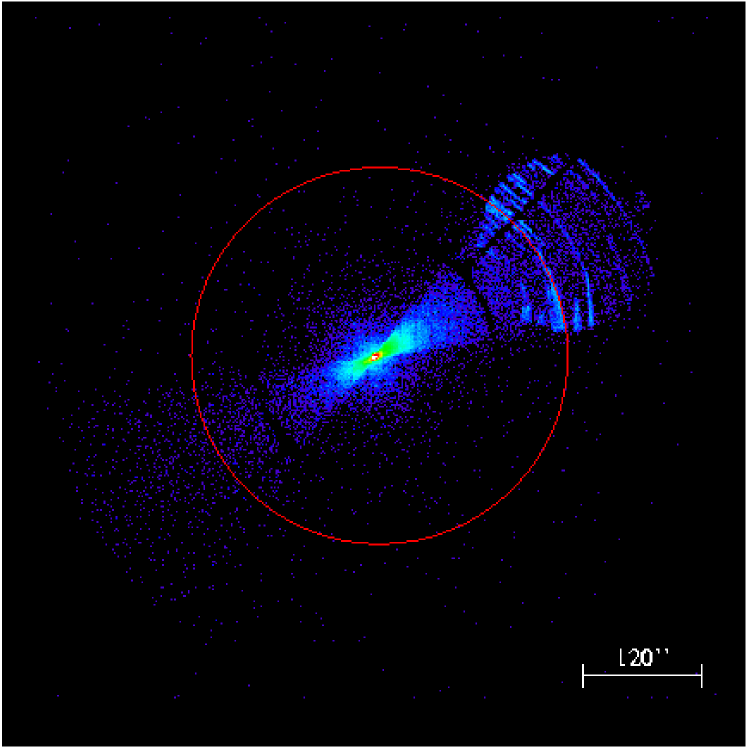
More important for the actual imaging quality are the figure errors which influence the point-spread function and the reflectivity of the coating. Figure errors have not been included in the simulations but have been determined by X-ray measurements at the PANTER test facility of the Max-Planck-Institut für extraterrestrische Physik (MPE) [freyberg:06a] using monoenergetic X-rays of different energies. The measurements, performed with full illumination of the mirror system, yield an on-axis angular resolution of the mirror system of half energy width (HEW) at and at , thus providing an oversampling of a factor of 10 in spatial resolution compared to the expected size of the “axion image” of the sun. As an example the focal plane image of a point like source (distance ) is shown in figure 3. The apparent asymmetry of the focal plane image originates from the asymmetric illumination of the mirror system.
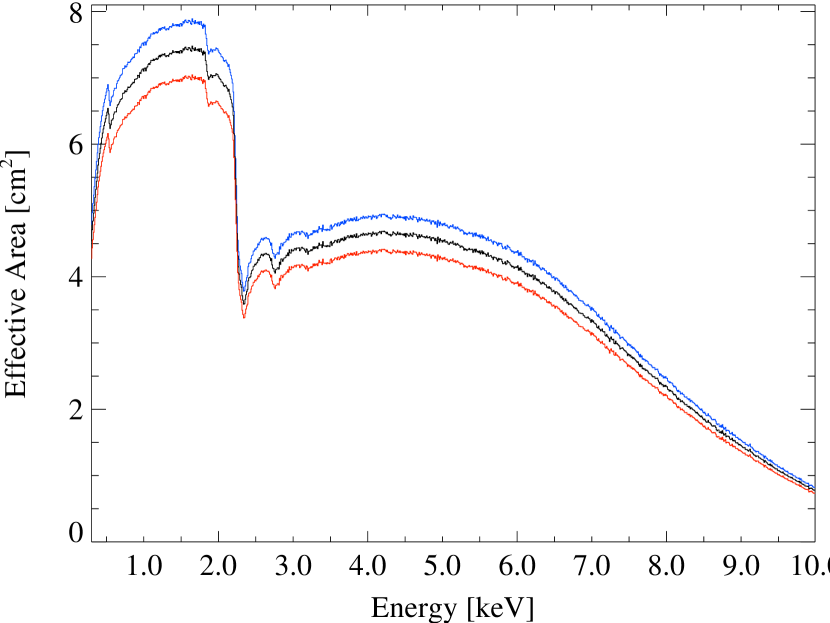
In addition, the energy dependence of the effective area of the mirror system was measured over a series of distinct energies for each individual mirror sector. The sector with the best effective area was chosen for CAST. By combining the simulated effective area with the results of the calibration measurements, we calculated the on-axis effective area for the chosen sector and for the energy range important for CAST by interpolation (see left part of figure 4). In figure 4 the effective area for the 2003 data taking period (blue line) is compared to the effective area for the 2004 data taking period (black and red line). For the 2004 data taking period the effective area is shown for two cases: the effective area for a point source located at infinity (black line) and for a realistic axion energy and intensity distribution of the extended solar axion source (red line). The overall combined efficiency of the mirror system and the pn-CCD detector for X-rays from axion conversion varies between and for the 2004 detector setup depending on the photon energy. In order to achieve a better centering of the solar axion spot on the CCD, we had to permanently tilt the telescope by relative to the axis of the magnet during the data taking period of 2004. As a consequence the efficiency for the data taking period in 2004 is reduced compared to 2003. The right part of figure 4 shows the simulated radial and tangential (relative to the mirror shell surface) dependence of the effective area. According to this picture, the tilt of the telescope results in a reduction of the effective area by in absolute value. The radial off-axis behavior shows a slight asymmetry due to the fact that only one sector of the mirror system is illuminated, which breaks the radial symmetry of the mirror system.
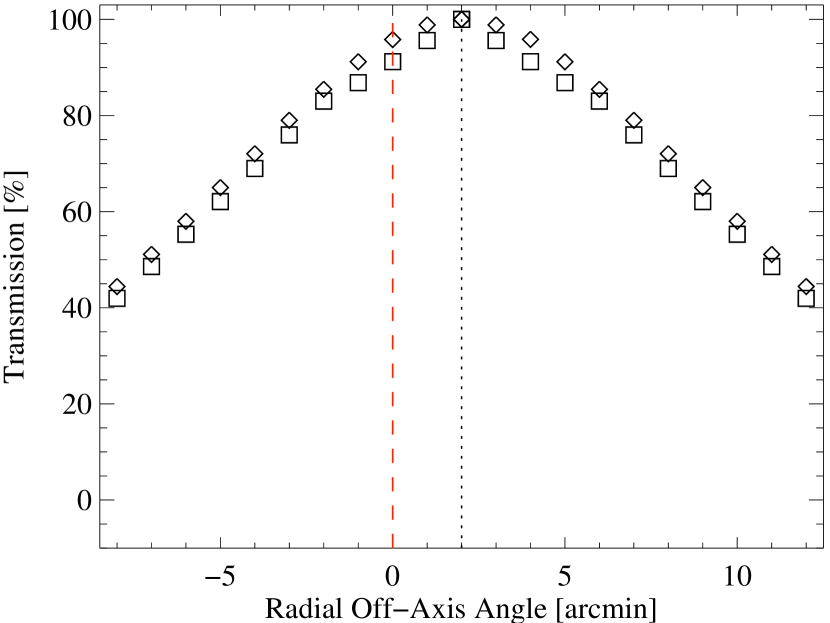
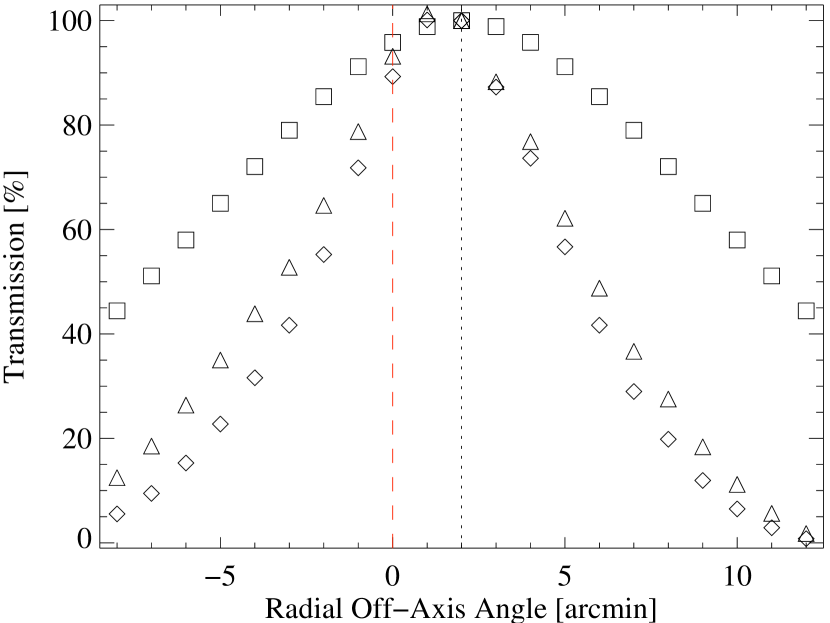
In order to estimate geometric effects due to magnet bore and the influence of the finite size of the axion source, we included the magnet tube geometry and the shape of the axion emission region on the sun in our simulations. To simplify matters the beam pipe was assumed to be a perfectly straight tube with a diameter of . The right image of figure 5 shows the combined transmission for an extended source depending on the off-axis angle for the 2004 data taking period. The maximum transmission is offset from off-axis angle due to the fact that the X-ray telescopes optical axis is slightly tilted relative to the optical axis of the magnet bore, as mentioned before.
2.2 The pn-CCD Detector
The focal plane detector of the CAST telescope is a thick, fully depleted pn-CCD. For a detailed description on the functional principle and an overview on the general characteristics and concept of this kind of detector we refer the reader to [strueder:90a] or [strueder:01a]. The major advantages of such a device are the thick depletion region and its very thin () and uniform radiation entrance window on the backside of the chip which results in a quantum efficiency in the entire photon energy range of interest ( to ) for the solar axion search. The left part of figure 6 shows the quantum efficiency measured for a similar device, the pn-CCD on board of the European X-ray observatory XMM-Newton [strueder:01a].

The pn-CCD has a sensitive area of divided into pixels with a size of each. This corresponds to an angular resolution of given the focal length of for the X-ray optics. The 64 columns of 200 pixels are read out in in parallel followed by an integration period of resulting in a total cycle time of . Since the pn-CCD is operated continously, it is sensitive to photons all the time and the detector has no dead time. Although for photons registered during read out, the pixel coordinate in the shift direction cannot be determined. This results in a fraction of “out-of-time” events of assuming a circular intensity distribution with a diameter of (corresponds to encircled axion flux) for the expected solar axion image. The pn-CCD provides a larger sensitive area than the expected “axion image” of the sun.
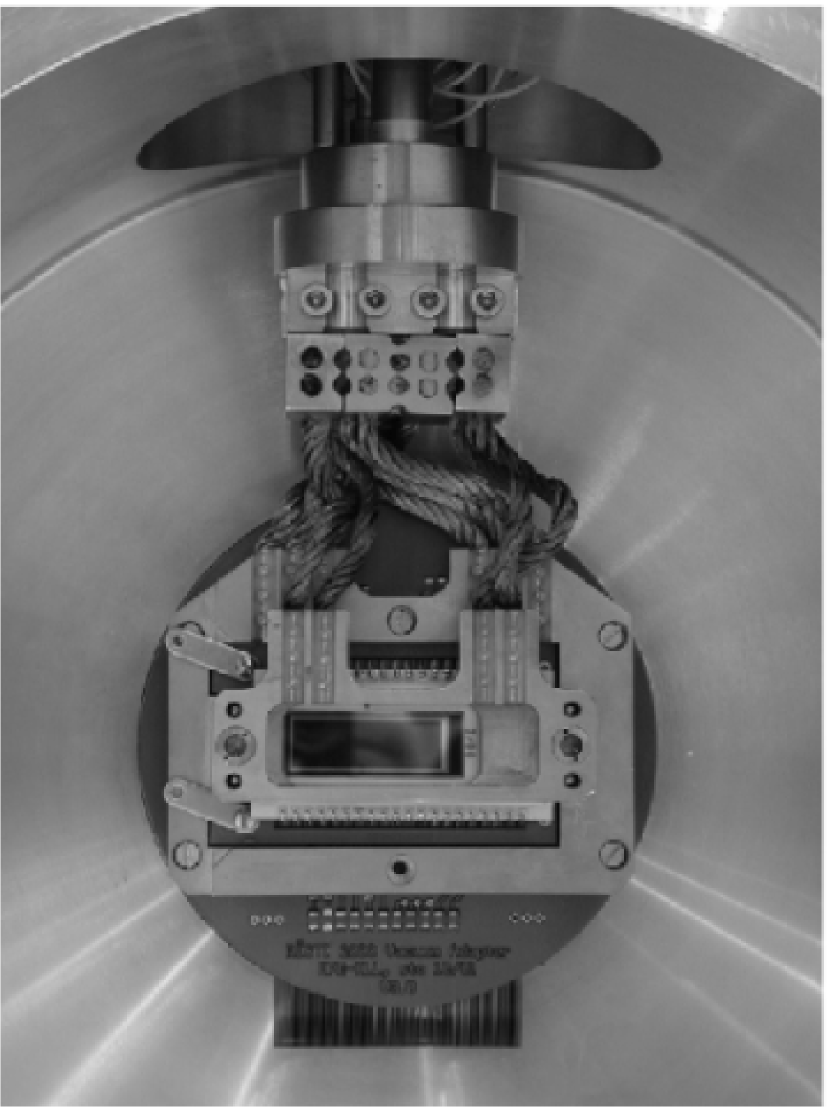
The operating temperature of the CAST pn-CCD is and is kept stable with a Stirling cooler system. The thermal coupling between the cooling system and the pn-CCD is provided by flexible copper leads connecting the cold finger of the Stirling cooler with the cooling mask of the pn-CCD chip (see right part of figure 6). The detector is housed inside an aluminum vacuum vessel with a passive shield (removed in figure 6) of typically of oxygen free Cu and more than of low activity Pb almost free of to reduce the environmental gamma-ray background. An additional lead shield on the rear side of the detector reduces the gamma background from the concrete wall of the experimental hall and thus reduces temporal changes of the background spectrum and level during magnet movement when the distance between the detector and the wall of the experimental area changes [kuster:05d].
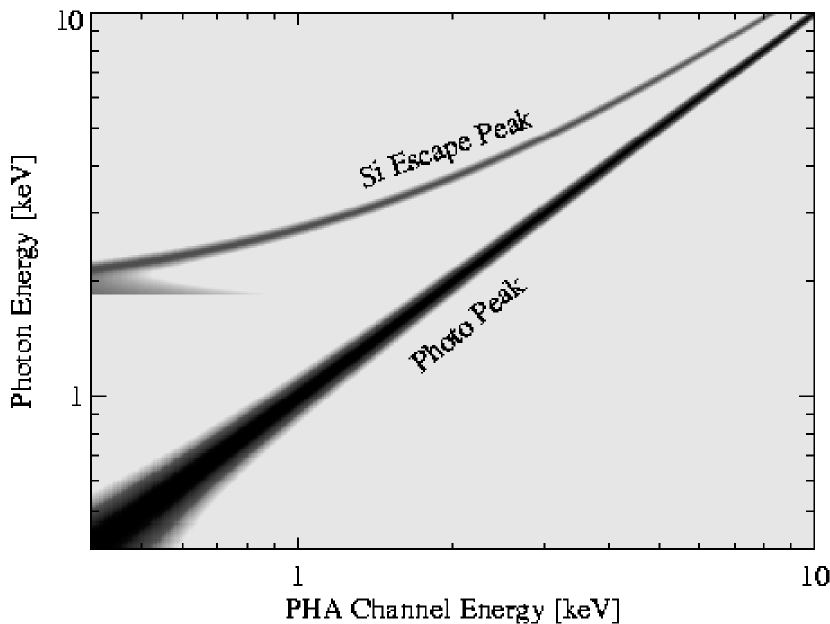
Using a multi-target X-ray tube we calibrated the pn-CCD detector in-situ at CERN. From this data we derived the energy calibration and the detector redistribution matrix shown in the left part of figure 7, which in combination with the effective area describes the mathematical relation between the incident binned differential photon spectrum and the observed binned pulse height spectrum measured by the detector following the relation:
| (2) |
Here denotes the number of counts per unit time interval observed in the energy bin corresponding to the photon energy , the effective area in , the binned differential source spectrum in units of , the finite energy width of the th energy bin, and the redistribution matrix. The redistribution function includes the contributions from the photo-peak, the Si escape peak which is expected at an energy of below the photo peak, and the finite energy resolution of the detector. Second order effects, like e.g., the influence of partial events, were not taken into account for the modeling of the detector response function. We consider these effects of minor importance for CAST, although they are not negligible for high resolution X-ray spectroscopy [kahn:80a, popp:00a, for a detailed discussion].
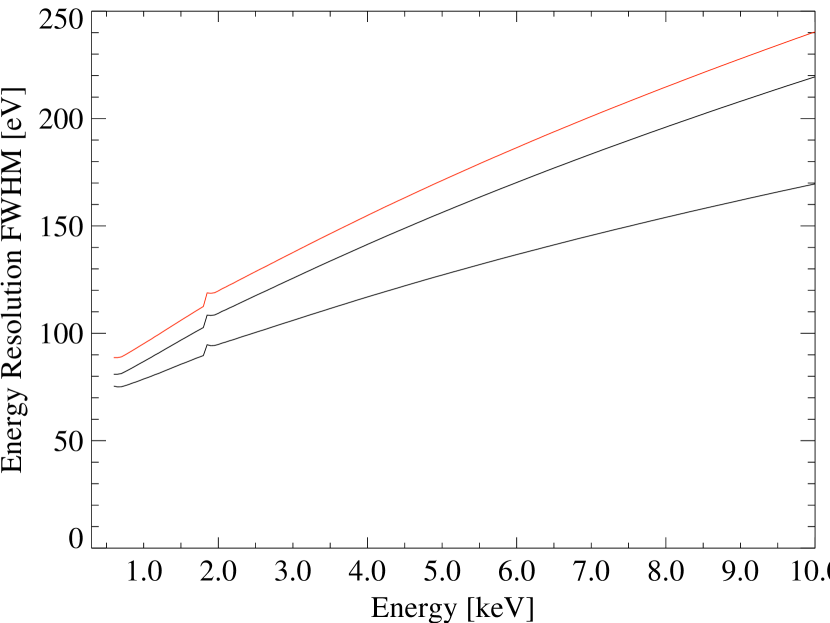
Furthermore, we extended the calibration to energies which were not reachable with the X-ray tube ( ) using X-ray fluorescent lines apparent from the observed background spectrum (see Sec. 3.1 figure 12). Together with an calibration source, these lines also provide a valuable tool to monitor the long term stability of the energy calibration. By fitting a sixth order polynomial to these calibration data, we derived the incident photon energy to detector channel conversion for the energy range from up to . The energy resolution of the pn-CCD detector shown in figure 7 depends on the energy of the incident photon and on the pattern type of the registered event, i.e., whether the charge cloud generated by the incident photon was registered in one, two, three, or four pixels (single, double, triple, and quadruple event patterns). Single and double event patterns contribute in the energy range of – with a fraction of and to the total number of observed pattern types. The remaining fraction of are triple and quadruple patterns. To characterize the energy resolution depending on the incident photon energy for the CAST pn-CCD we adopted the detector response model which is actually in use for XMM-Newton EPIC pn-CCD underlying the same physical detector parameters. Figure 7 shows the resulting energy resolution of the XMM-Newton EPIC pn-CCD for single and double event patterns separately, and the resulting energy resolution of the CAST CCD detector. To model the energy resolution of the CAST detector we combined both, the noise contributions of single and double event patterns. As apparent from figure 7, the energy resolution of the CAST detector is slightly worse compared to the energy resolution of the EPIC pn-CCD.
2.3 Telescope Alignment and Pointing Accuracy
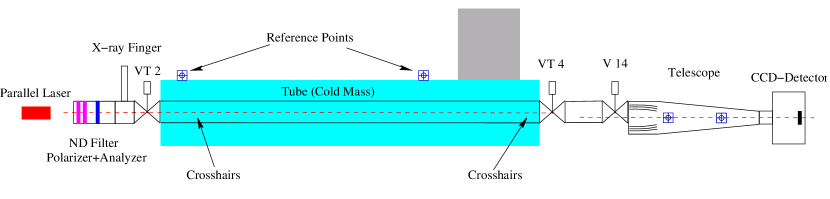
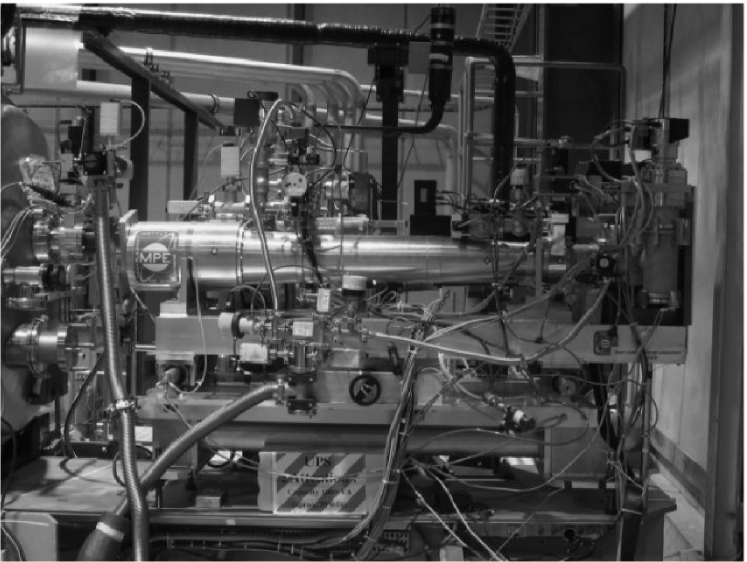
In order to achieve maximum performance of the X-ray mirror system, the optical axis of the X-ray telescope was aligned to be parallel with the magnet axis to an angle better than using a laser system providing a parallel beam, shining through the entire system. For the time of the alignment measurements the laser system is installed on the opposite end of the magnet instead of the TPC detector. The CCD detector can be replaced by a focusing screen, which allows to observe the focal image produced by the parallel laser beam. An overview of the experimental setup during the optical alignment is shown in figure 8.
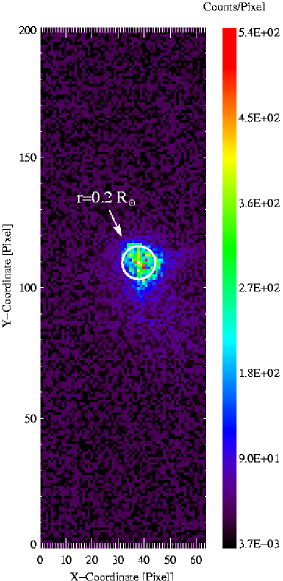
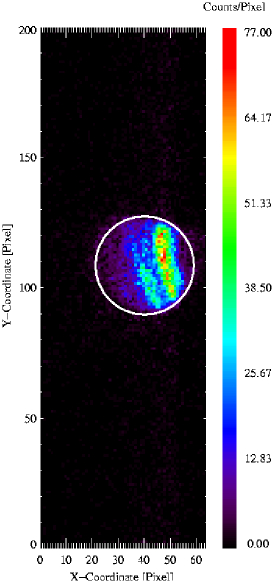
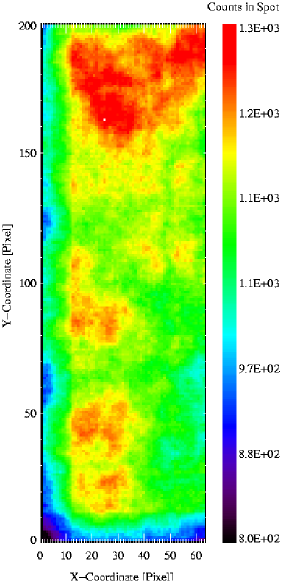
To be able to monitor the stability of the alignment and the location of the potential axion image on the CCD detector, for the data taking periods in 2004, a pyroelectric X-ray source emitting mainly photons was installed on the optical axis of the system, in front of the TPC detector. The device labeled “X-ray Finger” in figure 8 can be moved in and out of the field of view of the X-ray telescope. The major advantage of such a device compared to a radioactive source is that it can be turned off and consequently does neither affect the background level of the TPC nor of the X-ray telescope. Since the source is located at a finite distance to the mirror system, the photons of the source are focused behind the CCD. Therefore, the observable X-ray image is larger than the focal spot of a parallel X-ray or laser beam as shown in the right image of figure 9. The observed intensity distribution in the focal spot is not uniform since the emission strength depending on angle of the X-ray finger is non-uniform and thus the focal plane image represents the emission characteristics of the X-ray finger. The potential axion signal is supposed to be located in the center of the circular envelope of the X-ray spot distribution. After the X-ray finger is aligned, the position of the X-ray spot can be used to monitor the stability of the alignment of the X-ray optics and to define the location of the potential axion image of the sun. The position of the laser spot relative to the X-ray spot provides an additional consistency check. The size of the focal spot of the parallel laser filling the magnet aperture should be well within the expected solar axion spot.
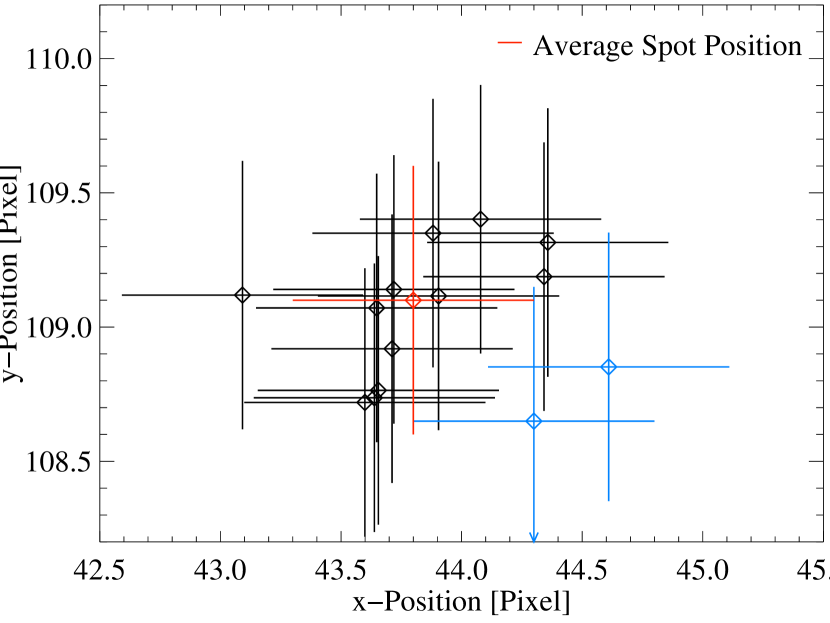
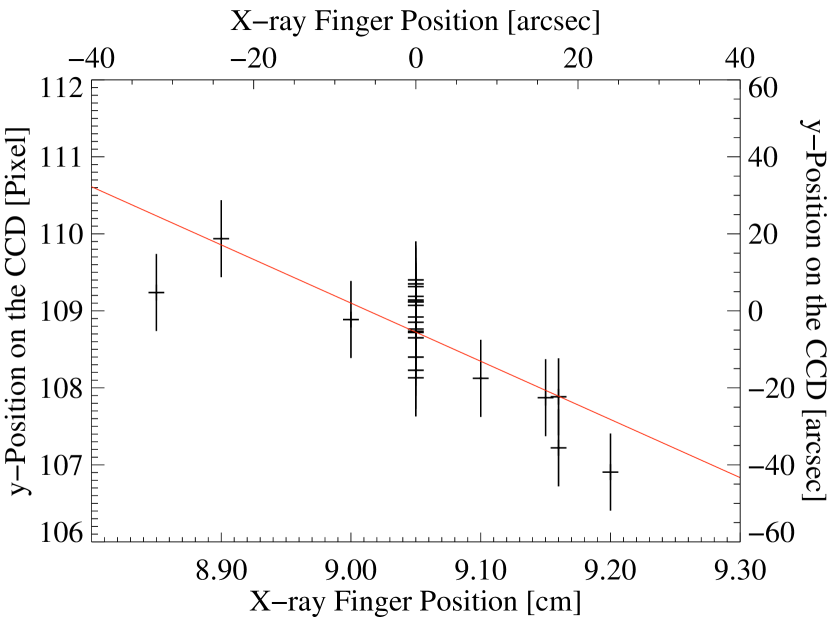
To verify the stability of the alignment, we observed the X-ray spot at the beginning and towards the end of the data taking period in 2004, during magnet movement, and for different magnet orientations. The barycenter of energy of the X-ray spot calculated from each measurement is shown in figure 10 before and after the 2004 data taking period, and during magnet movement. The measurements yield a stability of the position of the spot better than throughout the data taking period of 2004. The overall pointing accuracy of the CAST helioscope inferred from redundant angular encoder systems and direct optical observations of the sun is better than , which is perfectly adequate, given the angular field of view of the magnet bore of . Since the X-ray finger was installed in 2004 after the first data taking period in 2003, the alignment could not be continously monitored during that time. As a consequence we had to consider a larger and conservatively chosen extraction region for the potential axion signal on the CCD for the analysis of the 2003 data [zioutas:05a]. The results of an off-axis scan, demonstrating the linear correlation of the horizontal position of the X-ray finger and the location of the observed X-ray spot image on the CCD is shown in figure 10.
3 X-ray Telescope Performance
3.1 Long Term Performance

A valuable feature of the pn-CCD with integrated front-end readout electronics is the excellent longterm stability of operating parameters and performance resulting in homogeneous data sets collected over longer periods of time. Daily calibration measurements with the CAST pn-CCD using a flat field illuminating source, allow a permanent monitoring of the performance of the detector. A summary of the most important detector parameters monitored during the 2004 data taking period is given in figure 11. Please note, that the errors indicated for the Gain, CTI, and peak position are dominated by the error of the fitting procedure. The signal noise averaged over all pixels shows variations which are correlated to variations observed in the energy resolution of the detector. Please note that both parameters do not mirror the performance achieved under controlled laboratory conditions. We assign this to the variable and sometimes high noise level in the CAST hall which was not designed to be a low noise experimental area. In no way did the observed degradation affect the result of the axion search, especially the overall detection sensitivity for axions of the experiment. All other detector parameters are stable throughout the data taking period of 2004, similar to the performance achieved during the 2003 data taking period of CAST.
3.2 Detector Background

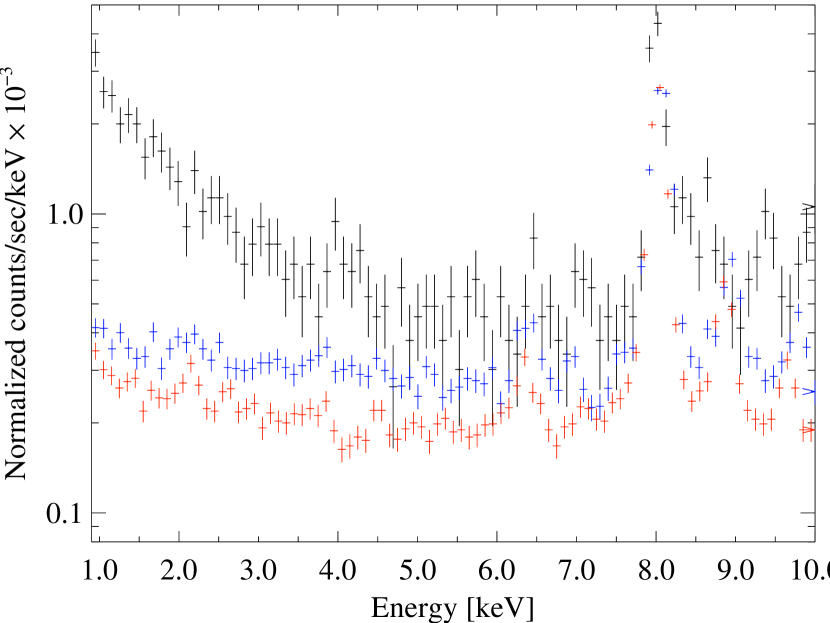
In rare event searches which are not free of background, the background count rate limits the overall sensitivity of the experiment and background reduction becomes crucial to maximize the sensitivity of the experiment. In general, the detector background can be reduced by a choice of radio-pure detector materials, passive or active shielding of the detector, by pattern recognition methods, and by minimizing the active detector volume by focusing the expected signal to a small area on the detector. The fact that the CAST experiment is located above surface, and does not benefit from the shielding effect of the over burden of underground laboratories, limits the attainable background level. The strategy to maximize the signal-to-noise level of the X-ray telescope is therefore twofold: concentrate the potential axion signal on a small area of the detector and reduce the background by passive shielding as much as possible. A typical background spectrum measured during the data acquisition phase in 2004 integrated over the whole CCD sensitive area which demonstrates the performance of the X-ray telescope is shown in figure 12. In the axion sensitive energy range from to the resulting mean normalized count rate integrated over the full detector area is , corresponding to a mean differential flux of . The integral background count rate of in the solar axion spot area () is remarkably low for an experiment above surface. The most prominent contributions to the low energy background apparent from figure 12 are the fluorescent emission lines from material close to the pn-CCD chip, like Cu (K-photo peaks and escape peak), Au, and Pb. Below the background is dominated, besides the Si escape peak from the Cu line, by an almost flat continuum of predominantly Compton scattered photons and secondary electrons (for a more detailed explanation see \citeasnounpopp:99a and \citeasnounhaberl:02a).


The material close to the CCD chip had not been selected for low levels of radioactive impurities. Nevertheless, samples of all detector components close to the CCD chip and the pn-CCD chip itself were probed for their radioactivity in the Canfranc Underground Laboratory of the University of Zaragoza. Based on these activity measurements, simulations using the GEANT4 Monte Carlo simulation package were carried out to estimate the contribution of natural radioactivity to the overall pn-CCD background. According to the results of the simulations the contribution of natural radioactivity, e.g. induced by contamination of the detector materials with 238U, 235U, or 40K can account for at most of the observed background level, whereas about of the measured background are induced by external gamma-rays originating from the environment surrounding the detector [rodriguez:07a]. with a half-life of is usually one of the strongest sources of natural radioactivity and contributes significantly to the observed background [heusser:95a]. For the pn-CCD which is operated in vacuum the contribution of Radon to the total background is not of importance at the actual level of sensitivity.
3.3 Background Systematics
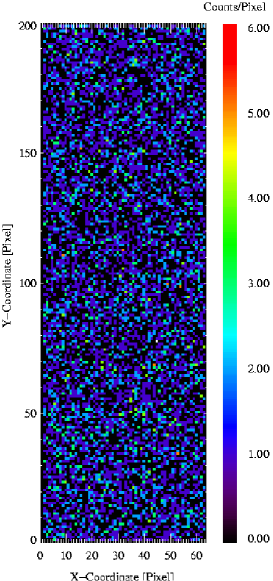
A major advantage of the X-ray telescope is the fact that the expected solar axion image is smaller than the active area of the pn-CCD and thus background and potential signal can be measured simultaneously during the observation of the sun by selecting different regions of interest on the pn-CCD. Nevertheless, we made extensive systematic studies of the observed background during tracking and non-tracking times and depending on different operating conditions. Figure 13 shows the spatial distribution of the events observed with the pn-CCD during 2004. The data was observed under axion sensitive condition, but while the CAST magnet was not pointing to the sun. Figure 14 shows the corresponding background light curve (count rate versus time), integrated over the sensitive area of the pn-CCD. The count rate stays constant at a level of over the entire data taking period of 2004 in the energy band of to . We also considered the variability of the background on different time scales. The right image of figure 14 demonstrates the temporal behavior of the background count rate during one day, averaged over different magnet orientations. Selecting different extraction regions on the CCD, does not affect the results we obtained for the spectral distribution and the temporal behavior of the background.
A statistical analysis of the background count rate measured in 2004 while the telescope was pointing at the sun reveals a gradual decrease with time to a level of about of the rate observed at the beginning of the 2004 data taking. Such a temporal behavior could be due to the systematical change of the detector location while following the solar azimuth at sunrise for a period of days. The detector moves progressively away from the concrete wall of the experimental hall which according to MC simulation results could be a significant background source. During the 4-months data taking period in 2003 when the detector shielding was less hermetic and the background rate was higher by a factor of no such change of background rate was observed.
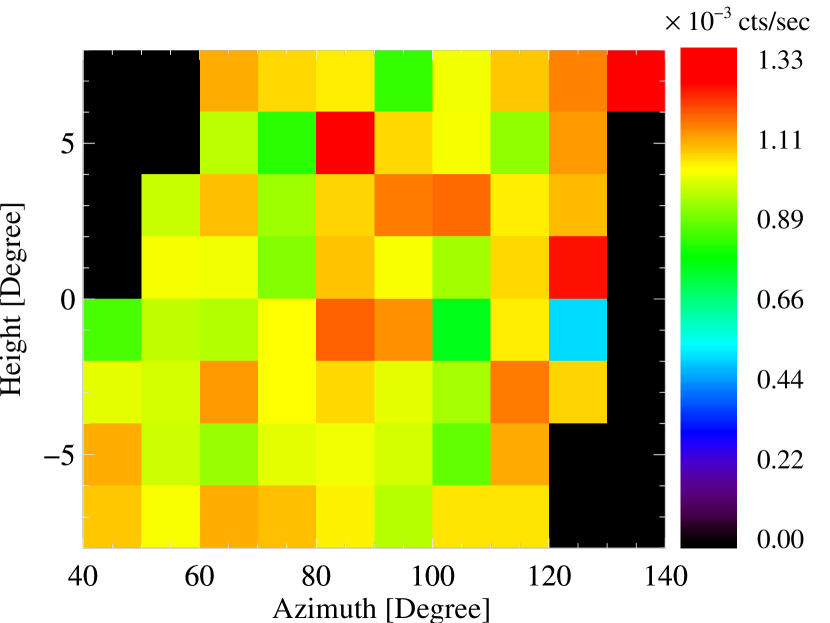
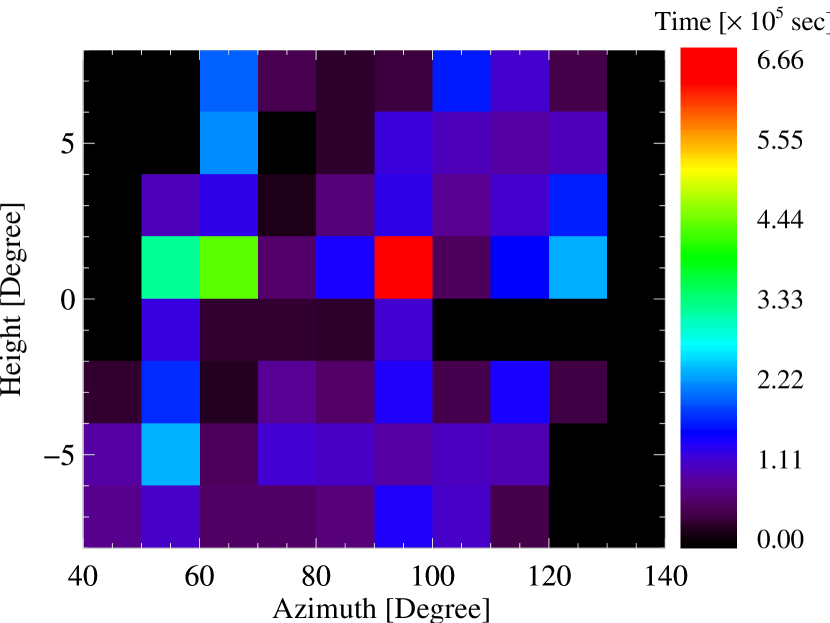
During solar observations the CAST magnet and the detectors change their orientation relative to the environment of the experimental area (concrete walls, cryogenic installation). This movement might influence the background observed by the detectors in a systematic way. Especially the distance between the CCD detector and the concrete wall close to the CCD detector changes during individual solar observations. In addition, during the movement of the magnet, while following the track of the sun, the back side of the detector will face different areas of the wall which change during the course of the year. Measurements of the environmental gamma background in the CAST experimental area with a germanium gamma spectrometer show a variation of the contribution of, e.g., the chain to the total environmental background by more than one order of magnitude between different locations in the experimental area [dumont:04a]. To minimize the influence of this effect on the detector background of the CCD, a lead shield was installed behind the CCD detector to reduce the apparent background variations below the limit of sensitivity of the CCD detector. Figure 15 shows the background count rate integrated over the full sensitive area of the CCD depending on the pointing direction of the magnet as observed with the X-ray telescope in the axion sensitive energy range (left image) and the corresponding integration time for each cell (right image). The residual variations apparent from the picture are within the statistical uncertainties consistent with a constant background level, taking especially the short integration time in some cells into account.
4 Conclusions and Outlook
The X-ray telescope of CAST is in operation since summer 2003 and is taking data in routine operation. First results of data acquired in 2003 and 2004 have already been published \citeasnounzioutas:05a and \citeasnounandriamonje:07a. These results demonstrate how the sensitivity of rare event experiments as CAST can be improved by a combination of a focusing optics and a detector with high spatial resolution. Taking into account that an upper limit on approximately depends on the background count rate according to , the X-ray telescope improves the sensitivity of CAST by a factor of , compared to a non-focusing detector system. Further background reduction could be achieved by rebuilding the detector components from materials selected for radio-purity and with a graded-Z shield close to the pn-CCD chip which acts as an absorber for low energy photons ().
During 2003 and 2004 CAST explored the axion mass region up to . In the absence of a significant axion signal above background an upper limit on the axion to photon coupling of (95% CL) could be derived. This new limit supersedes the previous astrophysical limits for axion masses from the helium-burning lifetime of HB stars [raffelt:96a, raffelt:06a]. The results from this data taking period were published in [zioutas:05a] and [andriamonje:07a]. Since mid 2006 the CAST experiment probes for axions with a mass (second phase of CAST). To explore this mass range the axion conversion region has to be filled with a buffer gas to restore coherence between the axion and photon wave function. By systematically changing the pressure inside the magnet bore the mass range from to can be covered. Due to the vast amount of pressure settings (approximatly 660) necessary to scan the axion mass region continuously, the integration time per pressure setting (axion mass) is limited to per detector. As a consequence we expect ( integration period) as background contribution. Further optimization of the shielding or detector materials would not significantly improve the sensitivity of the X-ray telescope of CAST.
References
References
- [1] \harvarditemAbbon et al.2007andriamonje:06a Abbon P, Andriamonje S, Aune S, Dafni T, Davenport M, Delagnes E, de Oliveira R, Fanourakis G, Ferrer Ribas E, Franz J, Geralis T, Gros M, Giomataris Y, G. I I, Kousouris K, Morales J, Papaevangelou T, Ruz J, Zachariadou K \harvardand Zioutas K 2007 New J. Phys. this volume.
- [2] \harvarditemAltmann et al.1998altmann:98a Altmann J, Egle W J, Bingel U, Hafner W, Gänswein B, Schwarz H \harvardand Neugschwender A 1998 in \citeasnounhoover:98a pp. 350–358.
- [3] \harvarditemAndriamonje et al.2007andriamonje:07b Andriamonje S, Aune S, Autiero D, Barth K, Belov A, Beltrán B, Bräuninger H, Carmona J, Cebrián S, Collar J I, Dafni T, Davenport M, Di Lella L, Eleftheriadis C, Englhauser J, Fanourakis G, Ferrer Ribas E, Fischer H, Franz J, Friedrich P, Geralis T, Giomataris I, Gninenko S, Gómez H, Hasinoff M, Heinsius F H, Hoffmann D H H, Irastorza I G, Jacoby J, Jakovčić K, Kang D, Königsmann K, Kotthaus R, Krčmar M, Kousouris K, Kuster M, Lakić B, Lasseur C, Liolios A, Ljubičić A, Lutz G, Luzon G, Miller D, Morales A, Morales J, Ortiz A, Papaevangelou T, Placci A, Raffelt G, Riege H, Rodríguez A, Ruz J, Savvidis I, Semertzidis Y, Serpico P, Stewart L, Vieira J, Villar J, Vogel J, Walckiers L \harvardand Zioutas K 2007 New. J. Phys. in preparation.
- [4] \harvarditemAndriamonje et al.2007andriamonje:07a Andriamonje S, Aune S, Barth K, Belov A, Beltrán B, Bräuninger H, Carmona J, Cebrián S, Collar J I, Dafni T, Davenport M, Di Lella L, Eleftheriadis C, Englhauser J, Fanourakis G, Ferrer-Ribas E, Fischer H, Franz J, Friedrich P, Geralis T, Giomataris I, Gninenko S, Gómez H, Hasinoff M, Heinsius F H, Hoffmann D H H, Irastorza I G, Jacoby J, Jakovčić K, Kang D, Königsmann K, Kotthaus R, Krčmar M, Kousouris K, Kuster M, Lakić B, Lasseur C, Liolios A, Ljubičić A, Lutz G, Luzon G, Miller D, Morales A, Morales J, Ortiz A, Papaevangelou T, Placci A, Raffelt G, Riege H, Rodríguez A, Ruz J, Savvidis I, Semertzidis Y, Serpico P, Stewart L, Villar J, Vogel J, Walckiers L \harvardand Zioutas K 2007 J. Cosmol. Astropart. Phys. 010 [hep-ex/0702006].
- [5] \harvarditemAutiero et al.2007autiero:06a Autiero D, Beltrán B, Carmona J M, Cebrián S, Chesi E, Davenport M, Delattre M, Di Lella L, Formenti F, Irastorza I G, Gomez H, Hasinoff M, Lakić B, Luzón G, Morales J, Musa L, Ortiz A, Placci A, Rodriguez A, Ruz J \harvardand Villar J A 2007 New. J. Phys. this volume.
- [6] \harvarditemCebrián et al.2007rodriguez:07a Cebrián S, Rodríguez A, Kuster M, Beltrán B, Gómez H, Hartmann R, Irastorza I G, Kotthaus R, Luzón G, Morales J, Ruz J, Strüder L \harvardand Villar J A 2007 Astroparticle Physics Journal accepted.
- [7] \harvarditemCharpak et al.2002charpak:02a Charpak G, Derré J, Giomataris Y \harvardand Rebourgeard P 2002 Nucl. Instrum. Methods Phys. Res., Sect. A 478, 26–36.
- [8] \harvarditemDumont2004dumont:04a Dumont G 2004 Background measurement for the cast experiment Technical Note CERN-SC-2004-027-RP-TN CERN.
- [9] \harvarditemEgle et al.1998egle:98a Egle W J, Altmann J, Kaufmann P, Münker H, Derst G, Schwarz H \harvardand Neugschwender A 1998 in \citeasnounhoover:98a pp. 359–368.
- [10] \harvarditemFreyberg et al.2005freyberg:06a Freyberg M J, Bräuninger H, Burkert W, Hartner G D, Citterio O, Mazzoleni F, Pareschi G, Spiga D, Romaine S, Gorenstein P \harvardand Ramsey B D 2005 Experimental Astronomy 20, 405–412.
- [11] \harvarditemFriedrich et al.1998friedrich:98a Friedrich P, Bräuninger H W, Burkert W, Döhring T, Egger R, Hasinger G, Oppitz A, Predehl P \harvardand Trümper J 1998 in \citeasnounhoover:98a p. 369.
- [12] \harvarditemGiomataris et al.1996giomataris:96a Giomataris Y, Rebourgeard P, Robert J P \harvardand Charpak G 1996 Nucl. Instrum. Methods Phys. Res., Sect. A 376, 29–35.
- [13] \harvarditemHaberl et al.2002haberl:02a Haberl F, Briel U G, Dennerl K \harvardand Zavlin V 2002 in F Jansen, ed., ‘New Visions of the X-ray Universe in the XMM-Newton and Chandra Era’ Vol. 488 of ESA SP ESA Publications Division Noordwijk.
- [14] \harvarditemHeusser1995heusser:95a Heusser G 1995 Annu. Rev. Nucl. Part. Sci. 45, 543–590.
- [15] \harvarditemHoover \harvardand Walker1998hoover:98a Hoover R B \harvardand Walker A B, eds 1998 Vol. 3444 of Proceedings of SPIE SPIE Bellingham, WA.
- [16] \harvarditemKahn \harvardand Blisett1980kahn:80a Kahn S M \harvardand Blisett R J 1980 Astrophys. J. 238, 417–431.
- [17] \harvarditemKuster et al.2005kuster:05d Kuster M, Bräuninger H, Dogan B O, Joux J N, Kotthaus R \harvardand Lippitsch A 2005 Cast scientific and technical report CSTR-05-002: Alignment for phase II Technical report CERN/CAST.
- [18] \harvarditemPeccei \harvardand Quinn1977peccei:77a Peccei R D \harvardand Quinn H R 1977 Phys. Rev. Lett. 38, 1440–1443.
- [19] \harvarditemPopp et al.1999popp:99a Popp M, Haberl F, Briel U, Soltau H \harvardand Strüder L 1999 in O. H Siegmund, ed., ‘EUV, X-Ray, and Gamma-Ray Instrumentation for Astronomy X’ Vol. 3765 of Proceedings of SPIE SPIE Bellingham, WA pp. 693–702.
- [20] \harvarditemPopp et al.2000popp:00a Popp M, Hartmann R, Soltau H, Strüder L, Meidinger N, Holl P, Krause N \harvardand von Zanthier C 2000 Nuclear Instruments and Methods in Physics Research A 439, 567–574.
- [21] \harvarditemRaffelt et al.2006raffelt:06a Raffelt G G et al. 2006 Preprint [hep-ph/0611250]
- [22] \harvarditemRaffelt et al.1996raffelt:96a Raffelt G G Stars as Laboratory for Fundamental Physics 1996 (Chicago, IL: The Univesity of Chicago Press)
- [23] \harvarditemSikivie1983sikivie:83a Sikivie P 1983 Phys. Rev. Lett. 51, 1415–1417.
- [24] \harvarditemStrüder et al.1990strueder:90a Strüder L, Bräuninger H, Meier M, Predehl P, Reppin C, Sterzik M, Trümper J, Cattaneo P, Hauff D, Lutz G, Schuster K F, Schwarz A, Kendziorra E, Staubert R, Gatti E, Longoni A, Sampietro M, Radeka V, Rehak P, Rescia S, Manfredi P F, Buttler W, Holl P, Kemmer J, Prechtel U \harvardand Ziemann T 1990 Nucl. Instrum. Methods Phys. Res., Sect. A 288, 227–235.
- [25] \harvarditemStrüder et al.2001strueder:01a Strüder L, Briel U, Dennerl K, Hartmann R, Kendziorra E, Meidinger N, Pfeffermann E, Reppin C, Aschenbach B, Bornemann W, Bräuninger H, Burkert W, Elender M, Freyberg M, Haberl F, Hartner G, Heuschmann F, Hippmann H, Kastelic E, Kemmer S, Kettenring G, Kink W, Krause N, Müller S, Oppitz A, Pietsch W, Popp M, Predehl P, Read A, Stephan K H, Stötter D, Trümper J, Holl P, Kemmer J, Soltau H, Stötter R, Weber U, Weichert U, von Zanthier C, Carathanassis D, Lutz G, Richter R H, Solc P, Böttcher H, Kuster M, Staubert R, Abbey A, Holland A, Turner M, Balasini M, Bignami G F, La Palombara N, Villa G, Buttler W, Gianini F, Lainé R, Lumb D \harvardand Dhez P 2001 Astron. Astrophys. 365, L18–L26.
- [26] \harvarditemvan Bibber et al.1989bibber:89a van Bibber K, McIntyre P M, Morris D E \harvardand Raffelt G G 1989 Phys. Rev. D 39, 2089–2099.
- [27] \harvarditemWeinberg1978weinberg:78a Weinberg S 1978 Phys. Rev. Lett. 40, 223–226.
- [28] \harvarditemWilczek1978wilczek:78a Wilczek F 1978 Phys. Rev. Lett. 40, 279–282.
- [29] \harvarditemWolter1952wolter:52a Wolter H 1952 Ann. der Physik, VI. F. 10, 94–114.
- [30] \harvarditemZioutas et al.2005zioutas:05a Zioutas K, Andriamonje S, Arsov V, Aune S, Autiero D, Avignone F T, Barth K, Belov A, Beltrán B, Bräuninger H, Carmona J M, Cebrián S, Chesi E, Collar J I, Creswick R, Dafni T, Davenport M, di Lella L, Eleftheriadis C, Englhauser J, Fanourakis G, Farach H, Ferrer E, Fischer H, Franz J, Friedrich P, Geralis T, Giomataris I, Gninenko S, Goloubev N, Hasinoff M D, Heinsius F H, Hoffmann D H H, Irastorza I G, Jacoby J, Kang D, Königsmann K, Kotthaus R, Krčmar M, Kousouris K, Kuster M, Lakić B, Lasseur C, Liolios A, Ljubičić A, Lutz G, Luzón G, Miller D W, Morales A, Morales J, Mutterer M, Nikolaidis A, Ortiz A, Papaevangelou T, Placci A, Raffelt G, Ruz J, Riege H, Sarsa M L, Savvidis I, Serber W, Serpico P, Semertzidis Y, Stewart L, Vieira J D, Villar J, Walckiers L \harvardand Zachariadou K 2005 Phys. Rev. Lett. 94(12), 121301–+.
- [31]