Exploring DNA translocation through a nanopore via a multiscale Lattice-Boltzmann Molecular-Dynamics methodology
Abstract
A multiscale approach is used to simulate the translocation of DNA through a nanopore. Within this scheme, the interactions of the molecule with the surrounding fluid (solvent) are explicitly taken into account. By generating polymers of various initial configurations and lengths we map the probability distibutions of the passage times of the DNA through the nanopore. A scaling law behavior for the most probable of these times with respect to length is derived, and shown to exhibit an exponent that is in a good agreement with the experimental findings. The essential features of the DNA dynamics as it passes through the pore are explored.
pacs:
47.11.-j, 87.15.Aa, 83.10.MjI Introduction
An important biological process that has attracted the attention of recent experimental studies is the translocation of a biopolymer such as DNA through narrow pores. These kind of processes are not only important in phenomena like viral infection by phages, inter-bacterial DNA transduction or gene therapy,TRANSL but are also believed to open a way for ultrafast DNA-sequencing by reading the base sequence as the biopolymer passes through a nanopore. Experimentally, it is possible to explore the translocation process through micro-fabricated channels under the effect of an external electric field, or through protein channels across cellular membranes.EXPRM Some universal features of DNA translocation can be analyzed by means of suitably simplified statistical schemes statisTrans and non-hydrodynamic coarse-grained or microscopic models.DynamPRL ; Nelson However, a quantitative description of this complex phenomenon calls for state-of-the-art modeling. Here, we describe a multiscale approach to capture the essential features of the generic problem of a polymer translocating through a nanometer sized pore by taking into account the effect of a surrounding solvent. We are mainly interested in interpreting our results in relation to experiments of DNA translocation through solid-state pores, which are directed towards technological applications as was previously mentioned. We also explore to what extent the results obtained describe the actual biological behavior of DNA translocation.
II Multiscale methodology and set-up
In the present work a multiscale approach ourLBM is used to trace the dynamic evolution of a polymer that is pulled through a narrow pore in the presence of a fluid solvent. Within this framework, methods involving different levels of the statistical description of matter (for instance, continuum and atomistic) combine into a composite computational scheme. The basic elements of the methodology used are a Lattice Boltzmann treatment of the fluid solvent,LBE and a Molecular Dynamics simulation of the solute polymer. The solute-solvent dynamics are treated by coupling the polymer to the hydrodynamic field of the surrounding solvent. Owing to the dual field-particle nature of the Lattice Boltzmann technique, this coupling proceeds seamlessy in time and only requires standard interpolation/extrapolation for information-transfer in physical space. The scheme is general and applicable to any situation where a long polymer is moving in a solvent. This motion is of great interest for a fundamental understanding of polymer dynamics in the presence of the solvent. Previous studies dealt with hybrid models for polymer dynamics.hybrid1 ; hybrid2 However, in these methods the coupling of the polymer dynamics to the fluid solvent and the different time scales are not handled explicitly and as efficiently as in the current model. These claims of efficiency are supported by the linear scaling of the computational time with the number of polymer beads and solvent degrees of freedom (see Ref.6).
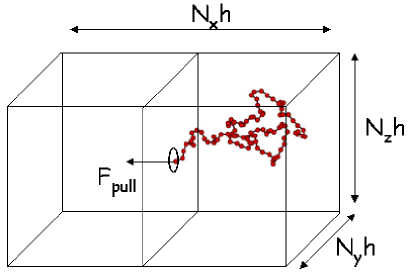
For our simulations, we consider a three-dimensional box of size lattice units, with the spacing between lattice points. We choose , , with or depending on the size of the translocating polymer chain. The separating wall is located in the mid-section of the direction, at , and the polymer is initialized via a standard self-avoiding random walk algorithm and further relaxed to equilibrium by Molecular Dynamics. The solvent is initialized with the equilibrium distribution corresponding to a constant density and zero macroscopic speed. Periodic boundary conditions are imposed for the fluid in all directions. The polymer has a length in the range of beads, and at resides entirely in the right chamber (). The interaction of the polymer with the wall, as well as the interactions between non-adjacent beads are modelled through Lennard-Jones potentials. The bond length between consecutive beads is kept fixed at . At the center of the separating wall, a square hole of side is opened, through which the polymer can move from one chamber to the other. Translocation is induced by a constant local electric field which acts along the direction, and is confined in a rectangular channel of size along the streamline ( direction) and cross-flow ( directions). The three dimensional box considered in the simulations is presented in Fig.1. A polymer configuration as well as the separating wall are also shown. The direction of the translocation is denoted by the arrow of the pulling force . The process falls in the fast translocation regime, where the total translocation time is much smaller than the typical Zimm time of the polymer towards its minimum energy/maximum entropy configuration. More details on the main parameters of the simulation are given elsewhere.ourLBM Throughout this work, length and time are measured in units of the lattice spacing and time-step .
III Passage times and statistics
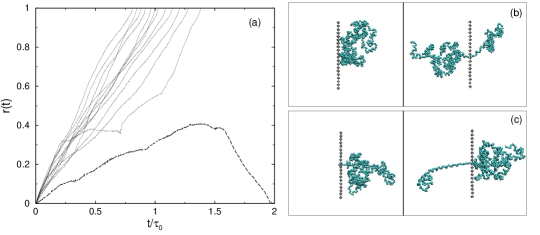
We first turn to the derivation of the scaling behavior of the translocation process. Simulations of a large number of translocation events ( up to ) for each polymer length were carried out. The ensemble of simulations is generated by different realizations of the initial polymer configuration and the variety of such events as well as their duration for beads are shown in Fig.2(a). By accumulating all these events for all lengths, duration histograms were constructed. These are not gaussians but are rather skewed towards longer times. This is clearly seen in Fig. 2(b), where the events in Fig. 2(a) have been projected into a duration histogram. Accordingly, we use the most probable time (peak of the distribution) as the representative translocation time for every distribution; this is also the definition of the translocation time in experiments, to which we compare later. Calculating the most probable times for each length leads to a nonlinear relation between the translocation time and the number of beads : , with an exponent . Preliminary results of simulations in the absence of a solvent give an exponent over , similar to theoretical work based on Brownian models. KARDAR Such a difference indicates a noticeable acceleration ot the process due to hydrodynamic interactions. Overall, our results are quite similar to the corresponding experimental data for DNA translocation through a nanopore,NANO which we will discuss in the last section.

IV Polymer Dynamics
Additional insight can be gained by analyzing the polymer dynamics during translocation. The molecule shows a blob-like conformation as it moves through the hole. It may either translocate very fast or move from one chamber to the other intermittently, with pauses. The fluid imposes fluctuations to the polymer motion and these are correlated to the entropic forces (gradient of the free energy with respect to a conformational order parameter, typically the fraction of translocated beads. These forces act on both translocated and untranslocated parts of the polymer.
It is very instructive to monitor the progress in time of the number of translocated monomers : serves as a reaction coordinate, with the total translocation time defined by the condition . The translocated monomers are plotted in Fig.3. The events described by different curves correspond to various initial configurations and represent completed translocation events. The translocation for a given polymer proceeds along a curve virtually related to its initial configuration and its interactions with the fluid. A configuration for a typical event at a specific timestep is shown in Fig.3(b). The initial conformation of the same polymer is shown in the left of this panel. In the same figure for a retraction event is represented by a curve which returns to 0. In this case, some of the parameters in the simulations have changed: specifically, the temperature was decreased to kT=10-5 instead of 10-4, the Lennard-Jones coupling was stronger (0.002 instead of 10-4) and the pulling force was reduced from to . All numbers are given in simulation units.ourLBM The parameter space largely remains to be further explored, and this exploration is expected to lead to a host of new interesting features in the dynamics of the translocating polymer. The configuration for the retracted case is also shown (Fig.3(c)) at a time where it already has started to reverse its motion. The initial configuration for this polymer is presented in the left of the same panel. An elongated conformation is clearly visible, that delays the translocation, leading to an increase of the entropic force acting at the untranslocated part of the chain which eventually leads to polymer retraction. However, inspection of all initial polymer conformations as the ones depicted in Fig.3 cannot lead to a classification of these configurations and a subsequent prediction of the corresponding curves.
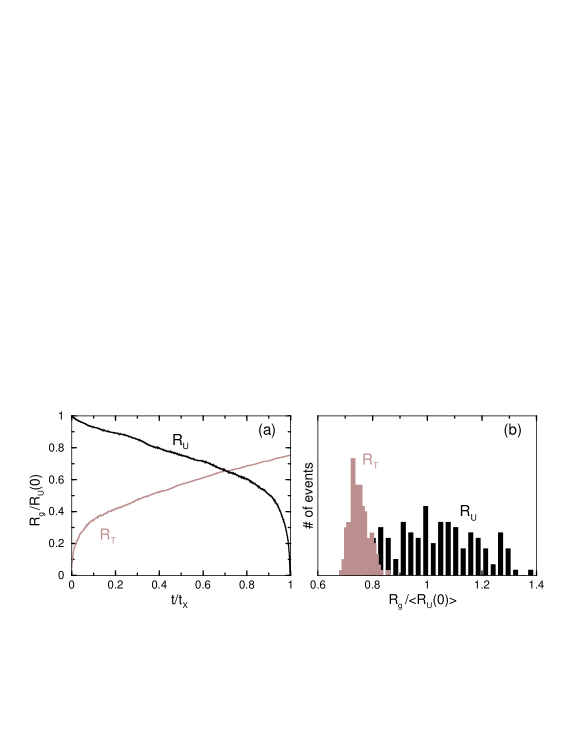
The dynamics of the translocating polymer can be further examined by analyzing the radius of gyration. To this end, in Fig.4(a) we represent the time-evolution of the radii of gyration for the two sections of the polymer, the untranslocated () [] and translocated [], respectively. The curves related to these two sections differ considerably. By definition, vanishes at , but at the same time increases, although not up to the value . This feature indicates a very different behavior of polymer at the beginning and at the end of the translocation process. The polymer retains its blob-like configuration, but its final volume is smaller than it was initially, at . This is the result of the strong entropic constraint set by the presence of the hole. The distribution of the radii of gyration for all the events is shown in Fig.4(b), for both the untranslocated part at zero time, and the translocated one at the end of the process, . This histogram clearly shows that at the end of the process the polymer becomes more confined than it was initially at . A detailed explanation would require taking into account the many-body correlations and the non trivial interplay between all forces acting on the polymer. It is conceivable that, by allowing the polymer to further advance in time, it will regain its initial volume, but this remains to be examined. Nevertheless, in this work we focus on the first-passage times, namely up to the time needed for the last bead to translocate through the pore.
V Connection to experiment
As was already mentioned, our results are quite similar to the experimental data for DNA translocation through a nanopore.NANO An encouraging comparison is that the scaling we found for the translocation time with polymer length (with , ) is quite close to the experimental measurement for DNA translocation ().NANO Previous studies used different interpretations of their coarse-grained simulations of DNA packing in bacteriophages beadParam1 or -phage DNA in solution beadParam2 : one bead can typically represent a number of base-pairs (bp), ranging from about 8 base-pairs (similar to the hydrated diameter of B-DNA in physiological conditions) to base-pairs.
In order to interpret out results in terms of physical units, we calculated the persistence length () of the semiflexible polymers used in our simulations. Accordingly, the formula for the fixed-bond-angle model of a worm-like chain was used lpWCL : , where is complementary to the average bond angle between adjacent bonds. In lattice units () an average persistence length for the polymers considered, was found to be approximately . For -phage DNA nm lpDNA . This is equated to for our polymers, thus the lattice spacing is nm, which is also the size of one bead. Thereby, one bead maps approximately bp, given that the base-pair spacing is nm. With this mapping, the pore size is about nm, close to the experimental pores which are of order nm. The polymers presented here correspond to DNA lengths in the range kbp. The DNA lengths used in the experiments are larger (up to kbp); the current multiscale approach can be extendet to handle these lengths, assuming that appropriate computational resources are available. Additional details on the mapping of the anonymous polymers simulated in this work to real biopolymers will be given elsewhere.
VI Conclusions
A multiscale methodology has been applied to study polymer translocation through a narrow pore in the presence of a fluid solvent. Special emphasis has been placed on the passage times and their scaling with the polymer length. Hydrodynamic interactions assist translocation, and the dynamics of the polymer during the process was monitored. Further exploration of the parameter space of our model reveals interesting features, like the retraction of the polymer chain. Visual inspection of the detailed dynamics of the simulations suggests a rather complex picture for the atomic-scale mechanisms underlying the translocation process. Comparison of our results revealed encouraging similarities with experiment on DNA translocation through narrow pores, especially in the scaling law of the translocation time with polymer length. A thorough exploration of parameter space is required in order to permit direct contact with experimental results. Nevertheless, our results so far are encouraging in that a multiscale approach seems capable of providing a realistic description of DNA translocation through a nanopore and promises to yield interesting insight into this complex process.
Acknowledgments
M.F. acknowledges support by the Nanoscale Science and Engineering Center, funded by the National Science Foundation under Award Number PHY-0117795.
References
- (1) Lodish, H., Baltimore, D., Berk, A., Zipursky, S., Matsudaira, P. and Darnell, J., Molecular Cell Biology, W.H. Freeman and Company, New York, 1996.
- (2) Kasianowicz, J.J, Brandin, E., Branton, D. and Deamer, D.W., Proc. Nat. Acad. Sci. U.S.A., 93 (1996) 13770; Meller, A., Nivon, L., Brandin, E., Golovchenko, J. and Branton, D., ibid, 97 (2000) 1079.
- (3) Sung, W. and Park, P.J., Phys. Rev. Lett., 77 (1996) 783.
- (4) Matysiak, S., Montesi, A., Pasquali, M., Kolomeisky, A.M. and Clementi, C., Phys. Rev. Lett., 96 (2006) 118103.
- (5) Lubensky, D.K. and Nelson, D.R. Biophys. J., 77 (1999) 1824.
- (6) Fyta, M.G., Melchionna, S., Kaxiras, E. and Succi, S., Multiscale Model. Simul., 5 (2006) 1156.
- (7) Benzi, R., Succi, S. and Vergassola, M., Phys. Rep., 222 (1992) 145.
- (8) O’Connell, S. T., and Thompsonn, P. A. Phys. Rev. E, 52 (1995) R5792; Malevanets, A., and Yeomans, J. M. Europhys. Lett., 52(2) (2000) 231; Malevanets, A., and Kapral, R. Lecture Notes in Physics, 640 (2004) 116.
- (9) Thacher, T., Ganesan, S., Askar, A., and Rabitz, H. J. Chem. Phys., 85 (1986) 3655; Irbck, A., J. Chem. Phys., 101 (1994) 1661; Barsky, S., Delgado-Buscalioni, R., and Coveney, P. J. Chem. Phys., 121 (2004) 2403.
- (10) Kantor, Y. and Kardar, M., Phys. Rev. E, 69 (2004) 021806.
- (11) Storm, A.J., Storm, C., Chen, J., Zandbergen, H., Joanny, J-F., and Dekker, C., Nanolett., 5 (2005) 1193.
- (12) Spakowitz, A.J. and Wang, Z.G., Biophys. J., 88 (2005) 3912; Forrey, C. and Muthukumar, M. Biophys. J., 91 (2006) 25 and references therein.
- (13) Perkins, T.T., Smith, D.E. and Chu, S., Science, 276 (1997) 2016; Hur, J.S., Shaqfeh, E.S.G. and Larson, R.G., J. Rheol., 44 (2000) 713; Jendrejack, R.M., de Pablo, J.J. and Graham, M.D., J. Chem. Phys., 116 (2002) 7752.
- (14) Yamakawa, H.: Modern Theory of Polymer Solutions, Harper & Row, New York, 1971.
- (15) Hagerman, P. J., Annu. Rev. Biophys. Biophys. Chem., 17 (1988) 265; Smith, S., Finzi, L., and Bustamante, C.: Science, 258 (1992) 1122.