Present address: ] Mesa+ Institute for Nanotechnology, University of Twente, Enschede, The Netherlands
Trapping of Rb atoms by ac electric fields
Abstract
We demonstrate trapping of an ultracold gas of neutral atoms in a macroscopic ac electric trap. Three-dimensional confinement is obtained by switching between two saddle-point configurations of the electric field. Stable trapping is observed in a narrow range of switching frequencies around 60 Hz. The dynamic confinement of the atoms is directly visualized at different phases of the ac switching cycle. We observe about Rb atoms in the 1 mm3 large and several microkelvins deep trap with a lifetime of approximately 5 s.
pacs:
32.80.Pj, 32.60.+i, 39.25.+k, 33.80.PsTrapping neutral particles has proven tremendously successful for the study of their properties and interactions. Particles in a low-field seeking quantum state can be trapped in a minimum of a static field. Particles in a high-field seeking quantum state cannot be confined in a static field, as static fields cannot possess a maximum in free space Wing (1984); Ketterle and Pritchard (1992). Trapping of atoms and molecules in their lowest-energy quantum level, which is always high-field seeking, is therefore not possible in static electric or magnetic fields. These ground-state atoms and molecules can be confined, however, when electrodynamic fields are used. Optical dipole traps, for instance, have found widespread application in ultracold atom experiments Grimm et al. (2000). Paramagnetic ground-state atoms and molecules can be trapped in ac magnetic fields, as has been demonstrated for Cs atoms Cornell et al. (1991).
A more versatile way of trapping ground-state atoms and molecules in a large volume is to make use of ac electric fields. To date, different ac electric trap configurations have been proposed Shimizu and Morinaga (1992); Morinaga and Shimizu (1994); Peik (1999). The operation principle of an ac electric trap for neutral particles is analogous to that of the Paul trap for ions Paul (1990); a potential energy surface is created with a saddle point at the trap center, resulting in attractive forces (focusing) in one direction and repulsive forces (defocusing) along the other two directions. The electric field configuration is then switched to a second one in which the roles of the forces are reversed. Alternating between these two configurations at the appropriate frequency, using either a sine wave or a square wave, leads to dynamic confinement of the particles.
Trapping with ac electric fields is particularly appealing for polar molecules that show a first-order Stark effect and that can therefore be strongly confined. For ground-state ammonia molecules, ac electric traps with a depth of several millikelvins have been demonstrated van Veldhoven et al. (2005); Schnell et al. (2007), and the motion of the trapped molecules has been analyzed in detail Bethlem et al. (2006). In addition, any ground-state atom or nonpolar molecule can be confined in an ac electric trap via their induced dipole moment. This includes species that are hard to trap otherwise, e.g., singlet homonuclear diatomics. The second-order Stark interaction leads to shallower traps, but has the advantage that all ground-state sublevels can be trapped. Recently, about 100 ground-state Sr atoms have been trapped in a microstructured ac electric trap on a chip with a lifetime of 80 ms Kishimoto et al. (2006).
Here we demonstrate trapping of ground-state 87Rb atoms in a macroscopic ac electric trap loaded from a magnetic trap. Absorption imaging of the cloud of trapped atoms is used to visualize the dynamics of the confinement. The operation characteristics of the trap are studied as a function of the switching frequency. We also discuss the prospects of sympathetic cooling of molecules with ultracold atoms using spatially overlapped traps.
In the experiment, the Rb atoms are collected in a 6-beam magneto-optical trap (MOT) loaded from a Zeeman slower. After a short compression of the MOT, optical molasses cooling, and optical pumping, the atoms are transferred into a spatially overlapped quadrupole magnetic trap. About atoms in the , hyperfine level at a temperature of 100 K are trapped in the magnetic trap which is characterized by a field gradient of 72 G/cm along its symmetry axis. The quadrupole magnet is then moved horizontally over 42 cm in 3 s using a precision translation stage with a nominal position reproducibility of 3 m. The cold cloud is transferred without significant atom loss or heating Lewandowski et al. (2003) into a second quartz cell. This second ultrahigh vacuum chamber houses the ac trap. The final position of the cloud is carefully overlapped with the center of the ac trap. Approximately 1.5 s after arriving at the final position the magnetic field is switched off. The magnetic field has completely disappeared after 150 s, and 350 s later high voltage is applied to the ac trap electrodes. After a variable trapping time, the trap electrodes are switched to ground, and the remaining atoms are detected by absorption imaging.
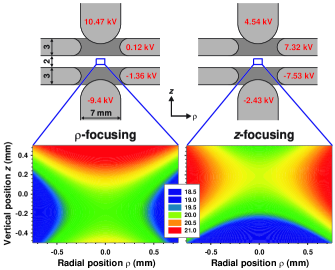
The ac trap is cylindrically symmetric with respect to the axis and consists of four highly polished electrodes of nonmagnetic stainless steel, as shown in Fig. 1. The two end cap electrodes have a hemispherical shape of radius 3.5 mm and are separated by 6 mm. The ring electrodes have an opening diameter of 6.7 mm, a thickness of 3 mm, and a corresponding inner semicircular shape of 1.5 mm radius. They are separated by a 2 mm gap. Care is taken to align the electrodes to the vertical rotational symmetry axis as well as to the horizontal mirror symmetry plane.
The electric field in the trap is a superposition of a dc dipole field and an ac hexapole field, with an additional dc quadrupole field to counteract gravity. Our trapping scheme thereby follows Peik’s proposal Peik (1999), and has the advantage that both the direction and the magnitude of the electric field at the center of the trap remain constant. Instead of the proposed sine wave, however, the hexapolar component of the field is switched between two configurations. The voltages that are applied to the four electrodes to obtain either one of the electric field configurations, denoted as focusing and focusing, are shown in Fig. 1. The ac switching frequency is given by , where is the sum of the durations of the -focusing and -focusing phases. At a given switching frequency, the relative duration of the two field configurations can be adjusted. The square-wave alternation between these configurations as applied in the experiments is schematically indicated in the lower part of Fig. 2.
The calculated electric field strengths in the trapping region are plotted in Fig. 1. At the trap center, the electric field is 20 kV/cm in both configurations. For the set of voltages indicated on the left-hand side of Fig. 1, the field exhibits a minimum along the axis and a maximum along the radial () direction, resulting in forces that are attractive along and repulsive along . Therefore, we refer to this state as focusing. For the set of voltages indicated on the right-hand side of Fig. 1, the situation is reversed; the atoms are attracted to the center along and repelled in the direction, therefore referred to as focusing.
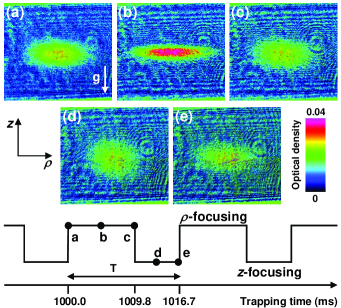
The dynamics of the atoms in the ac trap driven at the switching frequency, referred to as micromotion in ion traps, is illustrated in Fig. 2. Five absorption images of the cloud are shown at various times, labelled (a)(e), within the 61st trapping cycle. All pictures are taken after 0.1 ms of time of flight (TOF), reflecting the spatial distribution of the atoms at the switch-off time. All are side-view images of the cloud; i.e., gravity is pointing along the negative direction. The data are taken at the optimum frequency of 60 Hz, where the 61st switching cycle begins after 1000 ms. The switching cycle is asymmetric, starting with a 59% -focusing phase followed by a 41% -focusing phase. Figure 2(a) shows the cloud at the beginning of the cycle where the atoms have just been focused. The cloud is slightly oblate. Figure 2(b) is an image of the atoms in the middle of the -focusing phase. From the -focusing phase the atoms have velocity components along towards the center of the trap, and are spreading out along . This expansion is slowed down, however, by the -focusing forces. In the middle of the -focusing phase the atoms are at a turning point of the micromotion and have a maximum spread in the direction. Then they are turned around and move back towards the center. In the direction, the velocity components of the atoms towards the center have led to a contraction of the cloud resulting in the pancake shape shown in Fig. 2(b). As they are defocused along during the -focusing phase, they start to spread out in this direction. This can be seen in Fig. 2(c) which shows the spatial distribution of the atoms at the end of the -focusing phase. The cloud appears to have the same shape as in Fig. 2(a), but the velocity components of the atoms are now pointing inwards along and outwards along . This leads to an approximately spherical shape in Fig. 2(d) where the cloud has maximum spread in the direction. Figure 2(e) shows the cloud at the end of the cycle which is identical in shape to Fig. 2(a).
Figures 2(b) and 2(d) illustrate why switching between two saddle-point configurations leads to a net focusing force. The atoms are always closer to the center when the defocusing forces are on, and further away while the focusing forces are on. In Fig. 2(b) [Fig. 2(d)] the axial [radial] spread of the atoms is small and therefore the defocusing force is small. On the other hand, the spread in the focusing [] direction is big and the focusing forces are accordingly large. Thus, on average, the micromotion of the atoms leads to bigger focusing than defocusing forces and therefore the atoms remain confined. Close to the center of the trap, the force constant along the direction is twice as large as the one in the direction. This difference in forces can be compensated for by adjusting the asymmetry of the switching cycle. In this experiment, 59% of focusing was found to yield the largest number of trapped atoms, whereas for a symmetric switching cycle no trapping was observed. A similar behavior was found previously in the ac trapping of polar molecules van Veldhoven et al. (2005); Bethlem et al. (2006).
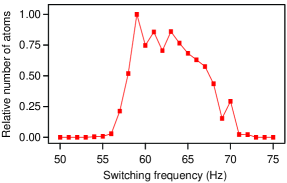
The relative number of atoms in the ac trap after 1.0 s of trapping is plotted in Fig. 3 as a function of the switching frequency. These data are also taken with 59% of focusing. Optimum trapping is observed at a switching frequency of 60 Hz. At this frequency, we infer from the absorption images that the number of trapped atoms is about . After 10 s of ac trapping, the number of atoms remaining in the trap is reduced to 10% of this value. This corresponds to a trap lifetime of about 5 s, presumably limited by collisions with background gas. As can be seen in Fig. 3, the low-frequency cutoff around 56 Hz is followed by a steep increase in the number of atoms to the maximum at 60 Hz. At higher switching frequencies the number of atoms decreases smoothly as trapping becomes less efficient. Above 72 Hz no atoms are detected. The range of working frequencies is narrow compared to that of both Paul traps for ions Paul (1990) and ac traps for polar molecules Bethlem et al. (2006). The observed frequency range is in good agreement with results from trajectory calculations.
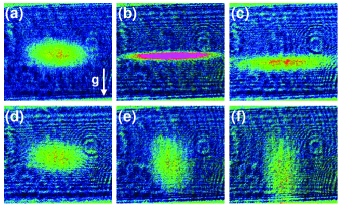
Figure 4 shows the cloud of atoms for a number of TOF values after a trapping time of 1.0 s at a switching frequency of 60 Hz. The upper row of pictures shows the free ballistic expansion of the atoms directly after the -focusing phase, whereas for the lower row the ac trap has been switched off at the end of focusing. In Fig. 4(a) the atoms are imaged after a TOF of 0.1 ms. Given that the atoms have not moved much since the trap was switched off, this is the atomic distribution at the end of focusing also seen in Fig. 2(a). After 4 ms TOF [Fig. 4(b)], the cloud has a pancake shape as the velocity distribution along the axial direction leads to focusing in this direction. Additionally, the cloud is expanding along . Figure 4(c) is taken after 7 ms of expansion. The cloud has spread out in the direction as the atoms continued to move along ; atoms originally at the top of the cloud, are now at the bottom, and vice versa. In addition, the atoms are falling towards the electrodes at the bottom edge of the picture. Still, the cloud has a smaller diameter in the direction than in Fig. 4(a). In Figs. 4(d)4(f) the atoms have just experienced -focusing forces resulting in a different velocity distribution than in 4(a)4(c). Figure 4(d) shows the cloud after a TOF of 0.1 ms as already seen in Fig. 2(c). Now the atoms are accelerating towards the center in the radial direction and expanding in the axial direction. In Fig. 4(e) after 4 ms of free flight the cloud has thus become cigar shaped. In Fig. 4(f) after 7 ms of TOF, the cloud is even smaller in the radial direction and is falling out of view.
Free ballistic expansion measurements have also been carried out to determine the kinetic energy (excluding micromotion) of the trapped atom cloud. As the observed densities in the ac trap are on the order of cm-3 or less, the cloud is in the collisionless regime. Therefore, different nonthermal velocity distributions of the atoms are expected along and . By TOF imaging at the turning points of the micromotion [Figs. 2(b) and 2(d)], we determine the mean kinetic energy to be K in the direction and K in the direction, with the Boltzmann constant. Multipole-expansion fits to the calculated electric fields in our trap indicate that higher-order terms up to the decapole are significant. The finite octupole and decapole components result in additional forces that considerably reduce the trap depth Bethlem et al. (2006).
The experimental setup presented in this work has been designed with the aim to produce ultracold molecules via sympathetic cooling. Cooling of molecules through elastic collisions with ultracold atoms has been discussed as a promising approach to bring molecules into the quantum degenerate regime Modugno et al. (2001). To avoid losses due to inelastic collisions, the molecules need to be in their ground state Lara et al. (2006). Therefore, an appealing method would be to confine ground-state atoms and molecules simultaneously in the same ac trap. However, polarizable atoms cannot be trapped at the same ac frequencies as polar molecules because of the largely different Stark interaction strengths. Thus, an ac trap for polar molecules has to be spatially overlapped with a different kind of atomic trap, i.e., a magnetic trap or a dipole trap. Moreover, these traps should not perturb each other. Here, we have demonstrated that a magnetic trap for atoms can be spatially overlapped with an ac electric trap. In a separate experiment, we have also operated this ac trap with voltages and switching frequencies that would confine ground-state ND3 molecules, while the atoms remained magnetically trapped. We have thereby experimentally verified that the Rb atoms in the magnetic trap are not perturbed by the ac electric fields needed for trapping molecules. At the same time, the magnetic fields used to trap the atoms have a negligible effect on the trapping of closed-shell polar molecules like ND3. The compatibility of these traps is an important prerequisite for sympathetic cooling of molecules using magnetically trapped ultracold atoms.
In conclusion, we have demonstrated trapping of about Rb atoms in a macroscopic ac electric trap operated at a switching frequency of 60 Hz. The physical process at the basis of trapping is illustrated with absorption images taken at different phases of the ac switching cycle. The trap depth is several microkelvins and can be increased by applying higher voltages and by using an optimized electrode geometry that reduces higher-order multipole field components. The experimental setup presented here is well suited to pursue cooling of ground-state molecules into the quantum degenerate regime, either via simultaneous trapping of nonpolar molecules and atoms in an ac electric trap, or via overlapping a magnetic trap for atoms and an ac electric trap for polar molecules.
Acknowledgements.
This work is part of the research program of the “Stichting voor Fundamenteel Onderzoek der Materie (FOM)”. A. M. would like to thank the Alexander von Humboldt Foundation for their support. We acknowledge fruitful discussions with H.L. Bethlem, P. Lützow, and S.A. Meek, and technical assistance from W. Erlebach, G. Heyne, and A.J.A. van Roij. We thank F. Schreck for the data acquisition software.References
- Wing (1984) W. H. Wing, Prog. Quant. Electron. 8, 181 (1984).
- Ketterle and Pritchard (1992) W. Ketterle and D. E. Pritchard, Appl. Phys. B 54, 403 (1992).
- Grimm et al. (2000) R. Grimm, M. Weidemüller, and Y. B. Ovchinnikov, Adv. At., Mol., Opt. Phys. 42, 95 (2000).
- Cornell et al. (1991) E. A. Cornell, C. Monroe, and C. E. Wieman, Phys. Rev. Lett. 67, 2439 (1991).
- Shimizu and Morinaga (1992) F. Shimizu and M. Morinaga, Jpn. J. Appl. Phys. 31, L1721 (1992).
- Morinaga and Shimizu (1994) M. Morinaga and F. Shimizu, Laser Phys. 4, 412 (1994).
- Peik (1999) E. Peik, Eur. Phys. J. D 6, 179 (1999).
- Paul (1990) W. Paul, Rev. Mod. Phys. 62, 531 (1990).
- van Veldhoven et al. (2005) J. van Veldhoven, H. L. Bethlem, and G. Meijer, Phys. Rev. Lett. 94, 083001 (2005).
- Schnell et al. (2007) M. Schnell et al., J. Phys. Chem. A (to be published).
- Bethlem et al. (2006) H. L. Bethlem et al., Phys. Rev. A 74, 063403 (2006).
- Kishimoto et al. (2006) T. Kishimoto et al., Phys. Rev. Lett. 96, 123001 (2006).
- Lewandowski et al. (2003) H. J. Lewandowski et al., J. Low Temp. Phys. 132, 309 (2003).
- Modugno et al. (2001) G. Modugno et al., Science 294, 1320 (2001).
- Lara et al. (2006) M. Lara et al., Phys. Rev. Lett. 97, 183201 (2006).