Liquid drop splashing on smooth, rough and textured surfaces
Abstract
Splashing occurs when a liquid drop hits a dry solid surface at high velocity. This paper reports experimental studies of how the splash depends on the roughness and the texture of the surfaces as well as the viscosity of the liquid. For smooth surfaces, there is a “corona” splash caused by the presence of air surrounding the drop. There are several regimes that occur as the velocity and liquid viscosity are varied. There is also a “prompt” splash that depends on the roughness and texture of the surfaces. A measurement of the size distribution of the ejected droplets is sensitive to the surface roughness. For a textured surface in which pillars are arranged in a square lattice, experiment shows that the splashing has a four-fold symmetry. The splash occurs predominantly along the diagonal directions. In this geometry, two factors affect splashing the most: the pillar height and spacing between pillars.
pacs:
47.20.Cq, 47.20.Ma, 47.40.Nm, 47.55.D-I. Introduction
When a liquid drop hits a solid surface, it often
splashes and breaks into thousands of smaller droplets. Splashing
is an excellent example of a singular breakup phenomenon with an
underlying instability that is still not properly understood. As
illustration, it was only recently discovered that the surrounding
air pressure is an important parameter for creating a splash on a
smooth dry substrate so that the splash can be completely suppressed
in a low pressure environment Xu2005 . Splashing is also
broadly important in industry with applications in ink-jet
printinginkjet , combustion of liquid fuelcombustion ,
spray dryingdrying and surface coatingcoating .
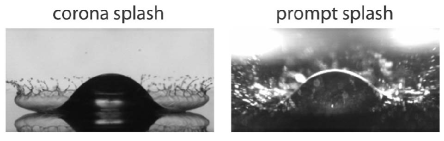
There are two distinct types of splashingRiboo : “corona” and “prompt”. Corona splashing occurs on smooth surfaces, where a symmetric corona is first formed, and droplets are ejected from the expanding corona; prompt splashing takes place on rough surfaces, where there is no corona, and droplets are created at the spreading contact line. Fig. 1 shows photographs of the two cases. A previous study proposed to explain this difference: corona splashing is caused by the effects of the air surrounding the drop and prompt splashing is caused by the effects of surface roughness arxiv .
Splashing has been studied since the time of Worthington in 1867 Worthington . Since then, there have been many experimental studies which have attempted to find a criterion for when splashing would occur. Notably, Mundo et alMundo established an empirical relationship for the no-splashing to splashing transition that depended on the surface roughness, , the velocity of impact, , the surface tension of the fluid, , the diameter of the drop, , the dynamic viscosity of the fluid, , and the density of the fluid, . They found that: , where and are Weber number and Reynolds number respectively: , . is a constant and that depends on surface roughness . Splashing will occur when . When no splashing will occur. WuWu and Range et alRange investigated the dependence of splashing on the Ohnesorge number, . They studied the case , where they could neglect the effects of viscosity, and obtained the relationship: , where and are fitting parameters. When , they saw a splash. Note that neither of these relationships take into account the effects of the gas surrounding the liquid during the splash.
Some researchers also investigated the fingering instability at the rim of the expanding liquid disc. AllenAllen proposed that the Rayleigh-Taylor instability caused the fingering. Bhola et alBhola and Mehdizadeh et alMehdizadeh obtained reasonable agreement between this theory and their experiments. Thoroddsen et alThoroddsen experimentally studied the fingers and proposed that the instability is caused by the presence of air trapped under the liquid drop.
This paper reports on experiments both for corona splashing on smooth
dry surfaces and for prompt splashing on rough and textured dry
substrates. For corona splashing, there are several regimes that
depend on the velocity of impact and the fluid viscosity.
Undulations around the rim of the spreading fluid are measured as a
function of the air pressure on the smooth dry surfaces. There is a
sharp jump in the number of undulations at the threshold pressure.
For prompt splashing, both random roughness and roughness created by
regular textured surface were studied. For a textured surface
consisting of a regular array of pillars, the dependence of
splashing on the vertical pillar height, lateral pillar size and
pillar spacing was studied independently.
II. Corona splash on smooth surface
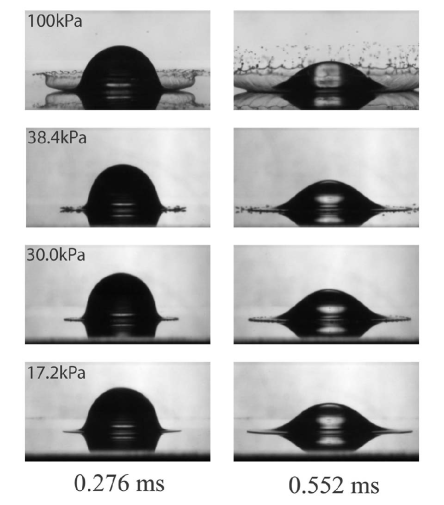
Previous experiment has shown that the surrounding air is crucial for corona splashing on a smooth dry surface Xu2005 : The rows of Fig. 2 show images of splash at different background air pressures for a drop of ethanol hitting a glass substrate. Surprisingly, as the pressure is lowered, fewer droplets are ejected; under low enough pressure no droplets emerge at all after impact. At a threshold pressure, , the splash just begins to be formed as is shown in the second row of the figure.
The threshold pressure, , as a function of impact velocity, , is shown in the main panel of Fig. 3. The curve is not monotonic. In the high velocity region above a characteristic velocity, , decreases as the impact velocity is raised. This is what we might naively expect. However, in the region , the curve is non-monotonic. This non-monotonicity indicates two different regimes at low and high velocities. Further experiments show that varies with liquid viscosity and drop size unpublished .
Experiments have also revealed that when the surrounding gas is heavier (for example, using Kr and SF6) and with larger liquid viscosity it is easier to create a splash. We compared two stressesXu2005 : the destabilizing stress from air, , and the stabilizing stress from surface tension, , and found:
| (1) |
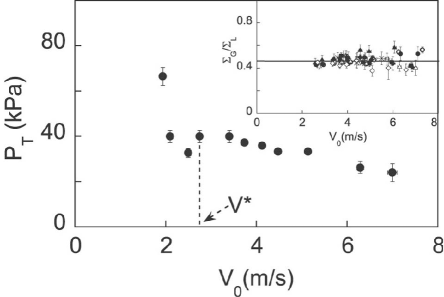
Here is the adiabatic constant of the gas, is the gas molecular weight, is Boltzmann’s constant, is the temperature, is the diameter of the drop, is the kinematic viscosity of liquid, and is the surface tension. A heavier gas or a larger liquid viscosity will increase the ratio, . The ratio of these two stresses was found to be approximately constant for velocities above at threshold pressure. This is shown in the inset to Fig. 3 where at threshold pressure is plotted for gases of different molecular weights(4 146 Dalton), liquids of different viscosities (0.68 2.6 cSt) and different impact velocities (2.5 7 m/s). At threshold pressure, in the regime , so that Eq.1 successfully collapses all the data without any fitting parameter.
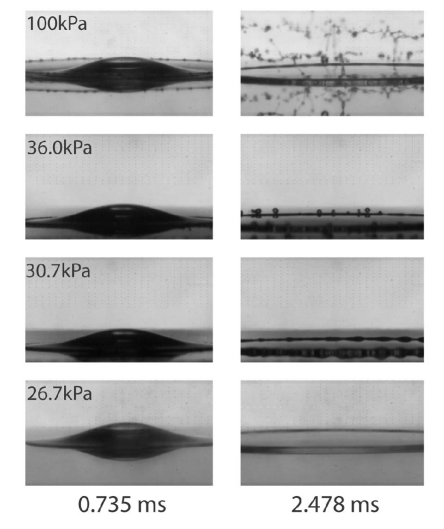
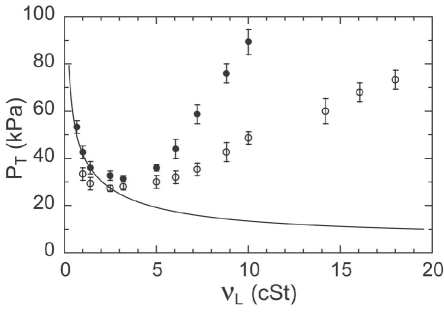
The prediction of Eq.1 that increasing the liquid viscosity leads to a lowering of the threshold pressure was verified by the data in Fig. 3 which spanned the range . Nevertheless this result is counterintuitive from our experience with high viscosity liquids and calls for more experiments covering a broader range of viscosity. By using silicone oils of different molecular weights, the liquid viscosity could be varied by more than one order of magnitude, while keeping a very similar mass density () and surface tension(mN/m). Fig. 4 shows photographs of a relatively viscous ( cSt) silicone oil drop hitting a dry glass substrate under different pressures of air. Again, we find that the splash decreases as the air pressure is decreased, and that no splash occurs when the background pressure is low enough. But one difference between Fig.4 and Fig.2 is that splashing occurs at a much later time when the viscosity is large. This is most obvious if one compares the second rows. Clearly one effect of viscosity is to delay the splashing time, as we might have expected.
Fig.5 shows the threshold pressure, , vs. liquid viscosity, , for mm diameter drops hitting the substrate with an impact velocity m/s. The upper curve shows, as before, the splashing threshold pressure, , where splashing is first detected. The lower curve shows the threshold pressure, , for where an undulation in the expanding sheet of liquid is first observed. is defined as the lowest pressure at which undulations (or bumps) first show up, and below which no undulations can be seen. Both threshold pressures first decrease then increase with increasing viscosity. This indicates two different regimes. At low , as the viscosity is increased, the threshold pressure to create a splash decreases. Thus viscosity helps to produce splash, as predicted by Eq.1. The solid line is the scaling relation derived from Eq.1, which agrees well with the small data. However, the prediction starts to deviate at higher viscosity where the threshold pressures increase with . In this regime, the higher the viscosity, the higher the pressure of air needed to create a splash and viscosity suppresses splashing.
Why there are two different behaviors? We think that for the
low regime, the expanding liquid film is stabilized mainly
by surface tension so that viscosity only affects the film
thickness: . Thus a larger causes a
thicker film which is easier to destabilize. But for the high
regime, viscous drag is important and helps to stabilize the
spreading drop.
III. Number of undulations versus pressure
Researchers have extensively studied the fingering
instability that occurs as a splash is created
Allen ; Bhola ; Mehdizadeh ; Thoroddsen . “Fingers” mean long
protrusions at the rim of the expanding liquid film. In our
experiment, we also observed undulations around the rim as shown in
the inset to Fig.6. Here, a feature similar to “fingering” is
observed. However in this case, the undulations do not extend very
far out from the rim. In order to prevent possible confusion, we
call them “undulations” or “bumps”. Previous studies have
focused on the number of fingers as a function of impact velocity
and surface roughness. Here we concentrate on the behavior and
number of the bumps as the air pressure is varied.
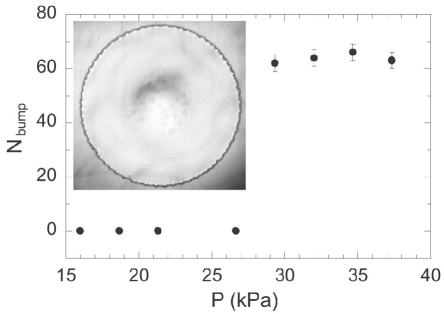
In Fig.6 we show at different pressures. We determine
the number of undulations, , from pictures such as the one
shown in the inset. At all pressures, is measured at the
same fixed radius of expansion where the undulations are most clear.
The main panel shows that at threshold pressure ,
jumps from zero to a finite value, and stays constant for
higher pressures. The absence of undulations at low pressure
suggests that no instability can grow below . The
apparent pressure independence of above
could be due to the narrow pressure range we are able to measure:
above
a certain pressure the entire expanding film is lifted into air.
IV. Discussion on instability mechanism
What is the mechanism for destabilizing the system and causing the occurrence of a splash on a smooth surface? What is the instability that eventually produces a splash? This question is still under debate. One prevailing theory first proposed by AllenAllen , is that it is due to the Rayleigh-Taylor instabilityTaylor . This is an instability occurring at the interface of two fluids with different densities, when the acceleration, , points from the light fluid, , towards the heavy fluid, . Linear instability theory predicts an exponential growth in amplitude, , with growth rate . The wavenumber, , and the growth rate, , of the fastest growing mode are predicted to beSharp :
| (2) |
| (3) |
Here the light fluid is the surrounding air and the heavy fluid is the expanding liquid. The expanding disc decelerates so that the direction of satisfies the requirement for the Rayleigh-Taylor instability. However, since , Eqs.2 and 3 do not vary appreciably with air pressure. Therefore splashing should not vary with air pressure if it were caused by Rayleigh-Taylor instability. This is inconsistent with our experiment.
Another interface instability, the Kelvin-Helmholtz instability, can take place when there is velocity jump at the interface. For inviscid fluids and , the wavenumber and the growth rate of the fastest growing mode are: Acheson ; Villermaux ; Yoon :
| (4) |
| (5) |
With the relative velocity between two fluids at the interface. In our case, is the velocity of the expanding liquid film. The Kelvin-Helmholtz instability strongly depends on the density of the lighter fluid, , and thus may be relevant to our experiment. However, our previous resultsXu2005 indicate that compressibility of air is important. This suggests that we should replace the Bernoulli term in Eq.4 with , with the speed of sound in the surrounding gas.
| (6) |
The characteristic length in the expanding liquid film is the film thickness, . This suggests that the instability might be able to grow if:
| (7) |
Since we also have , from Eq.6 and Eq.7, we obtain as a criterion for the instability to grow:
| (8) |
The left hand side is exactly in Eq.1. In the
low viscosity regime, our experiment gives for the splashing threshold which is consistent with the
criterion in Eq.8. This suggests the possibility the
Kelvin-Helmholtz instability may be the underlying instability
mechanism for corona splashing.
V. Prompt splash on rough surface
A completely different type of splash, the prompt splash,
occurs on rough surfaces. By systematically varying the degree of
surface roughness and the air pressure, we discovered two different
mechanisms for the two kinds of splashes: surrounding air is
responsible for the corona splash discussed above and surface
roughness is responsible for the prompt splasharxiv . Under
ordinary conditions (atmospheric pressure and non-zero roughness), a
splash is a mixture of both contributions. By working under low
pressure with a negligible amount of air, we are able to study pure
prompt splashing.
Since a prompt splash is caused by surface roughness, it may retain information about surface roughness in the distribution of sizes of the ejected droplets. We find that this is the case. We mix a small amount of ink into our ethanol and then collect the ejected droplets on a sheet of white paper. We then obtained the sizes of ejected droplets by measuring the size and darkness of the stains left on the paper. Our previous studyarxiv shows that the number of droplets, , decays exponentially with their radius, : (see inset of Fig. 9(b)). This indicates the existence of a characteristic decay length, .
The decay length, , correlates with roughness of the surface,
arxiv . At small , we have the relationship
; but for large roughness, this breaks down as
saturates at a constant value. We can understand this behavior in
the following manner. After impact, the thickness of expanding
film, , grows continuously from being molecularly thin just after
the impact, to approximately at the end of the
film expansion. When the surface roughness is small, can grow to
be much larger than . At the beginning, when is small, the
film is thinner than and continues to eject droplets until the
film becomes much thicker than the surface roughness. After
grows to be larger than , the roughness is too small to
destabilize the liquid film and produce a splash. Thus the
distribution of ejected droplets reflects the surface roughness
and we find . However, when the roughness is
large, can never grow to be greater than . Consequently,
can only grow to the maximum size of at its final
thickness. This is consistent with the decay constant, ,
saturating around , which is roughly the film thickness at
the end of expansion.
VI. Prompt splash on textured surface
The last section showed that roughness has a strong effect on prompt splash. To understand this dependence in more detail and to understand how surface properties affect splashing, we study splashing on a well-defined textured surface of regular patterns.
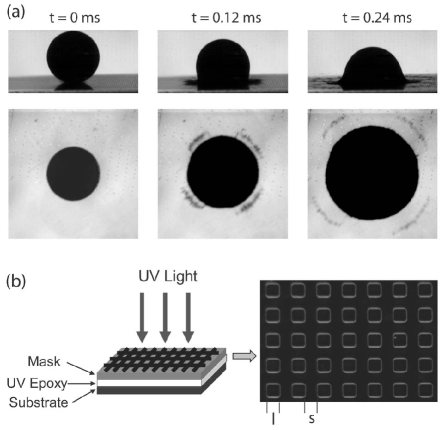
The textured surface is made with UV-lithography: We first spin coat UV epoxy (SU8-2000, MicroChem Corp.) onto a clean glass microscope slide. We then cover the slide with a mask of pre-designed pattern (square blocks in a square lattice) and expose the slide to UV light. After development, the UV epoxy film which is directly under the transparent part of the mask will harden and the rest of it can be rinsed away, resulting in a structure on the substrate of square pillars arranged in a 2D square lattice as shown in Fig. 7b. There are three important quantities relating to our splash experiments in this textured surface: (1) the vertical pillar height, , (2) the lateral pillar size, , and (3) the lateral spacing between pillars, . By changing the spin speed, we can vary pillar height, ; by designing different mask patterns, we can vary both and independently. Thus we can vary every aspect of the structure.
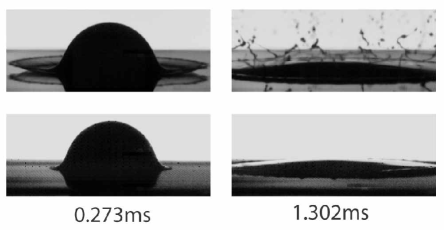
Fig. 7(a) shows photographs of a prompt splash on a textured surface under low air pressure. The impact velocity is , and the drop diameter is . The top row shows a side view of the splash. It has a similar look as the prompt splash on an ordinary rough surface. However, the bottom view shown in the second row reveals a very striking feature: the splashing occurs with four fold symmetry. The droplets are ejected predominantly along the diagonal directions of the square lattice. Fig. 7(b) shows the process of UV-lithography and a picture of textured surface under a microscope.
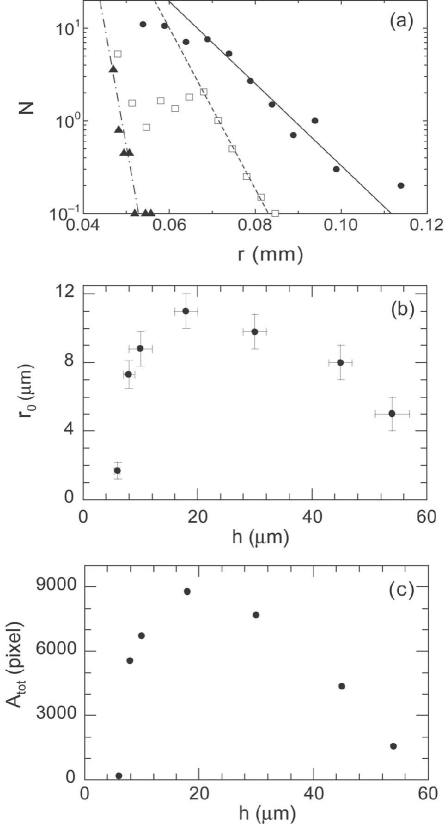
We can now vary the profiles of the surface and determine their effect on the splash and the ejected droplet distribution. Again we use the ink spot technique to measure the size distribution of droplets, as mentioned in last section. In the first set of experiments we first keep lateral size constant at , and vary the vertical height of the pillars, . Fig. 8(a) shows the number of droplets, , versus their radius, . Similar to the case with random roughness, we find an exponential decay at large , , with a characteristic decay length, , that varies with . Fig. 8(b) shows that varies with in a nonmonotonic manner. For small , increases with, and has a value comparable to, . This indicates that is determined by . However, when is greater than , the opposite trend occurs: decreases as increases. Fig.8(c) shows the sum of the areas created by all of the ink spots, , as a function of . is a quantity that indicates the total amount of ejected droplets. Fig.8(b) and (c) have the same shape, indicating that and are strongly correlated. The decreasing trend for large implies that larger roughness leads to less splashing. When is greater than , there is no splash at all.
These results are counterintuitive. We suspect they are caused by the way in which the impacting liquid drop can flow between the channels set up by the pillar structure. At small pillar heights, the liquid in the drop can easily reach the bottom of the canyon between the pillars and can then expand along the bottom surface. During expansion, the liquid film is destabilized by the pillars, producing droplets with a size related to the pillar height, . This produces a positive correlation between and for . However, as increases, it is increasingly difficult for the impacting drop to reach the bottom surface. In this case, we suspect that much of the drop expands on top of the pillars, rather than between them. Once , that is when the height is about the same size as the lateral dimensions and , the situation resembles a drop expanding on a flat surface with many holes rather than pillars. Here all the obstructions are underneath the liquid film and make only a small perturbation to its expansion. Because the impacting drop can only penetrate a finite depth below the pillar top, it does not know how far away it is from the bottom surface. This suggests that the amount of splashing should saturate as the pillar height is increased. We do not have a good explanation of the surprising fact that the splashing can be completely eliminated if the pillars are sufficiently tall.
To some extent, this is similar to the Cassie state of a drop on a superhydrophobic rough surface studied by Quéré et alDavid1 ; David2 , where a water drop can sit on top of air trapped in the rough profile of the substrate. However we note that their case is static whereas ours is probably driven by the fast dynamics of the expanding drop. Moreover in the case studied by Quéré et al the air plays an important role in supporting the weight of the drop. In our situation air has been pumped out of the system.
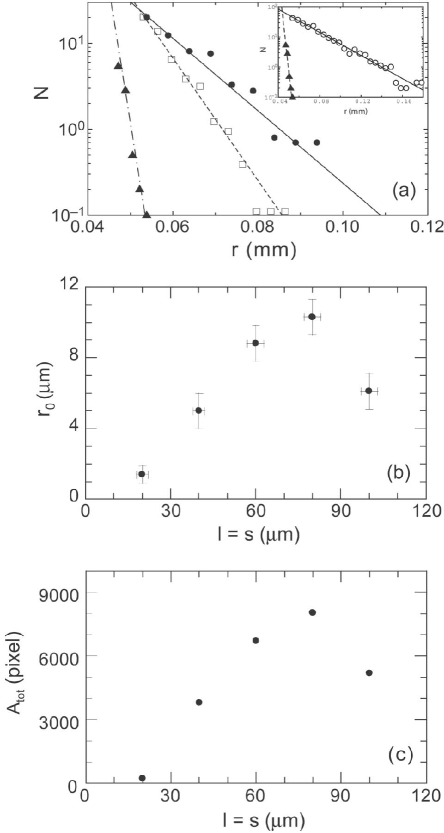
To understand the effect of the lateral dimension on the splashing, we make substrates of different and , while keeping fixed. Fig. 9(a) main panel shows versus with an exponential fitting function, , for different lateral sizes. Fig. 9(b) plots as a function of lateral pillar size and spacing . As and are varied we keep , and . Fig. 9(c) shows the total area, , vs. and . has the same dependence on and as does . Both quantities increase with lateral size in most of our range, then decrease at the end. This means that increasing the lateral dimensions will enhance splashing for small and . When the pillars are too sparse, splashing becomes less pronounced suggesting that it is more difficult to destabilize the liquid film. We should also note that is always much smaller than and , while much closer to the pillar height . This indicates that is more important in determining than are and .
A comparison of a textured surface with a random roughness surface is shown in the inset of Fig.9(a). Both curves decay exponentially, but random roughness curve (upper curve) has a much larger . This is surprising because both curves have similar roughness ( for the textured surface and for the case of random roughness). We can understand this qualitatively using the data shown in Fig.8(b). There we see starts to decrease at . Thus here at , it is already difficult for the drop to reach the bottom of the substrate and get destabilized. However, the random roughness is made by particles coated on surface. This substrate never resembles a flat surface with many holes. Therefore the random roughness surface makes a much larger splash with a larger .
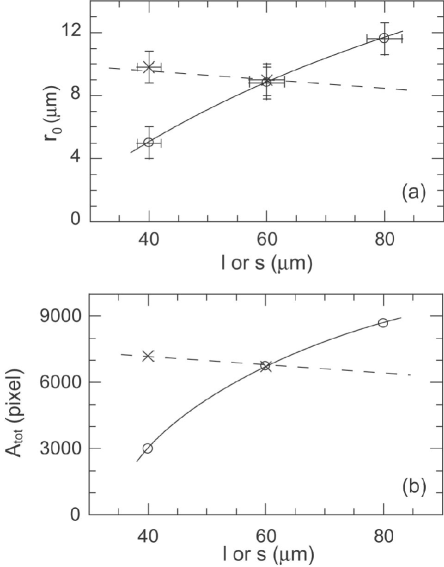
Fig. 9 demonstrates that changes as we vary and together. One further question is whether this is caused by a change in or a change in or in both? We can check this by varying and independently. Fig. 10 shows the result. The different symbols are for varying and separately while leaving all other conditions unchanged. Apparently increasing the spacing between pillars, , enhances and while has a much smaller effect on the splashing behavior.
The fact that increasing enhances splashing helps to explain why we see splashing in the diagonal directions in Fig. 7a. Along the diagonal, the distance between pillars is the greatest. Because is largest in those directions, splashing preferentially occurs in those directions.
The textured substrate not only affects the prompt splashing caused
by surface roughness, it also changes the behavior of corona
splashing caused by the surrounding air. Fig. 11(a) shows a typical
corona splash on a smooth surface at atmospheric pressure, while
Fig. 11(b) shows, at the same pressure, no splash at all on a
textured surface consisting of tall pillars. In both experiments the
drop hits the substrate at the same impact velocity. Different
amounts of splashing can also be achieved by creating pillars with
intermediate heights. These results suggest that the pillars form
channels through which the air can escape so that the importance of
the air for creating the splash is minimized. This discovery
demonstrates another way in which one can suppress splashing.
Moreover, it has the advantage that this suppression can be achieved
without decreasing the gas pressure.
VII. Conclusion
This paper systematically studied the splashing of liquid drops on various dry solid surfaces. This study corroborates that there are two mechanisms corresponding to the two kinds of splashes. Air causes the corona splash on smooth dry surfaces and substrate roughness causes the prompt splash. For the corona splash, we discovered several regimes. At high impact velocity, there are two regimes as the viscosity of the liquid is varied. We also studied the finger instability as function of air pressure and find a jump in the number of bumps. We suspect that Kelvin-Helmholtz instability coupled with the compressibility of air, is a possible mechanism for the splashing instability. This mechanism agrees well with our experimental data.
In order to examine the effect of surface roughness, we studied splashing on textured surfaces consisting of square pillars arranged in a square lattice. We found that the dimensions of the pillars strongly affect splashing. Here the pillar height, , is found to be the most important factor determining characteristic decay length, . We discovered that the splash preserves the symmetry of substrate. This shows that the splash direction can be controlled. We also find that corona splash under atmospheric pressure can be suppressed by making tall pillars on surface. This provide another way to reduce splash even under normal pressure. Since splashing is involved in many industrial processesinkjet ; combustion ; drying ; coating , these discoveries could have important practical applications.
Acknowledgement The author is particularly indebted to Sidney R. Nagel and Wendy W. Zhang for their suggestions and help on this work. L.X. is also grateful to Qiti Guo, Jingshi Hu, David Quéré, Mathilde Callies-Reyssat and Ling-Nan Zou for helpful discussions. This work was supported by MRSEC DMR-0213745 and NSF DMR-0352777. L.X. was supported by Grainger Fellowship.
References
- (1) L. Xu, W. W. Zhang and S. R. Nagel, Phys. Rev. Lett. 94, 184505 (2005).
- (2) J.L. Zable, IBM J. Res. Develop. 21, 315 (1977).
- (3) K.R. Koederitz, M.R. Evers, G.B. Wilkinson and J.A. Drallmeier, Int. J. Engine Research 3, 37 (2002).
- (4) F.V. Shaw, Ceramic Bulletin 69, 1484 (1990).
- (5) S. Sampath, X. Y. Jiang, J. Matejicek, A. C. Leger and A. Vardelle, Mater. Sci. Eng. A 272, 181 (1999).
- (6) R. Rioboo, M. Marengo and C. Tropea, Atomization and Sprays 11, 155 (2001).
- (7) L. Xu, L. Barcos and S. R. Nagel, arxiv.org/abs/physics/0608079 (2006).
- (8) A.M. Worthington, Proc. R. Soc. Lond. 25, 261 (1876-1877).
- (9) C. Mundo, M. Sommerfeld and C. Tropea, Int. J. Multiphase Flow 21, 151 (1995)
- (10) Z. N. Wu, ”Modélisation et calcul implicite multidomaine d’écoulements diphasiques gaz-gouttelettes.” Ph.D. Thesis, Université Pierre et Marie Curie, Paris, France, 1992.
- (11) K. Range and F. Feuillebois, J. Coll. Int. Sci. 203, 16 (1998).
- (12) R. F. Allen, J. Coll. Int. Sci. 51, 350 (1975).
- (13) R. Bhola and S. Chandra, J. Mater. Sci. 34, 4883 (1999).
- (14) N. Z. Mehdizadeh, S. Chandra and J. Mostaghimi, J. Fluid Mech. 510, 353 (2004).
- (15) S. T. Thoroddsen and J. Sakakibara, Phys. Fluids 10, 1359 (1998).
- (16) P. Jindal, L. Xu and S. R. Nagel, to be published.
- (17) G. I. Taylor, Proc. R. Soc. London Ser. A 201, 192 (1950).
- (18) D. H. Sharp, Physica D 12, 3 (1984).
- (19) D. J. Acheson, Elementary Fluid Dynamics (Oxford University Press 1990).
- (20) P. Marmottant and E. Villermaux, J. Fluid Mech. 498, 73 (2004).
- (21) S. S. Yoon, R. A. Jepsen, and T. J. O’Hern, ”Experimental Investigation on Splashing and Fingerlike Instability of Large Water Droplets”, ILASS-AMERICAS 2005.
- (22) A. Lafuma and D. Quéré, Nature Mater. 2, 457 (2003).
- (23) M. Callies and D. Quéré, Soft Matter 1, 55 (2005).