A Study of the LXeGRIT Detection Efficiency for MeV Gamma-Rays during the 2000 Balloon Flight Campaign
Abstract
LXeGRIT – Liquid Xenon Gamma-Ray Imaging Telescope – is the first prototype of a Compton telescope for MeV -ray astrophysics based on a LXe time projection chamber. One of the most relevant figures of merit for a Compton telescope is the detection efficiency for -rays, which depends on diverse contributions such as detector geometry and passive materials, trigger efficiency, dead time, etc. A detailed study of the efficiency of the LXeGRIT instrument, based both on laboratory measurements and Monte Carlo simulations, is presented in this paper.
1 Introduction
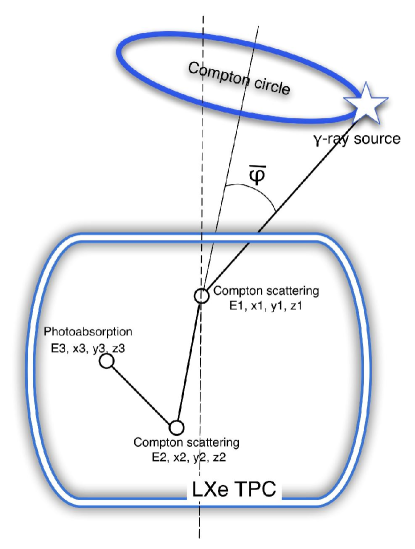
The concept of Compton telescope (CT) has proved the most successful so far in imaging astrophysical -ray sources in the energy band 1-30 MeV [1]. In a classical CT, without electron tracking, the initial direction of the -ray is determined to within a circle of angular radius around the direction of the scattered -ray, given by the spatial coordinates () and (), the subscripts 1 and 2 indicating the first and second interaction of the -ray. The scatter angle is given by an energy measurement, through the Compton formula for photons on free electrons
| (1) |
where is the energy of the scattered -ray, the initial energy of the -ray, the mass of the electron (0.511 MeV). Any detector able to measure () and () for each -ray with sufficient precision is a CT. The correct sequence of the two interactions must also be known.
COMPTEL [2] on the Compton Gamma Ray Observatory (CGRO) has been the most successful CT to date. COMPTEL was a double-scatter CT with a liquid scintillator detector as -ray converter and a NaI calorimeter. The two detectors were separated by a distance of 1.5 m to allow a measurement of the scatter direction with an accuracy of few degrees. In laboratory calibration, COMPTEL obtained an effective area of 20 cm2 or less, out of a geometrical area of the upper detector of 4188 cm2, therefore with an efficiency well below 1. The sequencing of Compton interactions was based on the time of flight measurement between the upper and lower detector. In flight the lower energy threshold for Compton imaging was 0.75 MeV, determined by rate considerations. An approach to CT largely different than COMPTEL was proposed some time ago [3], using a compact homogeneous detector with greatly enhanced position resolution (the principle is schematically shown in Fig. 1), specifically a liquid xenon time projection chamber (LXeTPC), in order to increase the efficiency and improve the background rejection capability well beyond the COMPTEL achievement. The practical realization of this proposal has been the liquid xenon -ray imaging telescope (LXeGRIT) [4, 5]. It has been tested at balloon altitude four times: twice in 1997, mainly engineering balloon flights, in 1999 with a heavy -ray shield and in 2000 with the un-shielded LXeTPC. The year 2000-balloon flight, in particular, lasted 27 hours and provided a data sample large enough to address all the main technical issues, to give a thorough in-flight calibration and to study the background in the near space environment [6, 7].
Aim of this paper is to present a detailed study of the efficiency of LXeGRIT to MeV -rays, based both on experimental data and Monte Carlo (MC) simulations. The focus will be on data taken just prior to the 2000 flight. The overall detection efficiency results from the combination of several contributions: detector geometry and passive materials, trigger efficiency, dead time and limited speed of the data acquisition system, on-line and off-line selections. These different contributions will be analyzed separately. LXeGRIT will be dealt with as an imaging calorimeter but we will stop short of discussing the key issue of imaging MeV -ray sources, too vast a subject to be included in the present work (see, e.g., [7]–Ch. 4). The paper is organized as follows:
2 LXeGRIT Trigger Efficiency Measurement
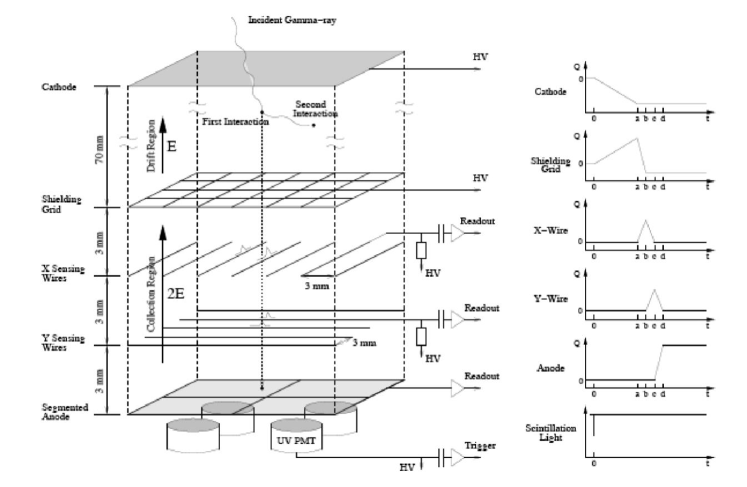
The LXeGRIT TPC is a position sensitive liquid ionization chamber self-triggered by the fast xenon scintillation. When a -ray interacts in the fiducial volume, both scintillation light and ionization charge are produced efficiently, with W-values of 24 eV [8] and = 15.6 eV [9]. The VUV photons (178 nm) are detected by four photomultiplier tubes (PMTs), which provide the event trigger and the initial time, t0. The ionization electrons drift under an external electric field, inducing a signal on two parallel wire planes, screened by a Fritsch grid. There are 62 wires in each plane and the pitch of the wires is 3 mm. The location of the hit wire(s) in the two wire planes provide the and coordinates in the TPC reference frame, while the time, measured starting from t0, gives the interaction depth ( coordinate). The wires do not collect the charge, which is finally collected by one of four independent anodes, and the amplitude measures the energy deposited in the interaction. Once the event has been built by the data acquisition system (DAQ), on-line selections are applied to the signals from the wires and the anodes. If not rejected, the raw event, i.e. anode and wire digitized waveforms, is written to disk. A detailed description of the LXeTPC and its working principle is given in [7, 5]; a schematic diagram of the LXeTPC showing the principle of operation, readout structure and expected pulse shapes is given in Fig. 2.
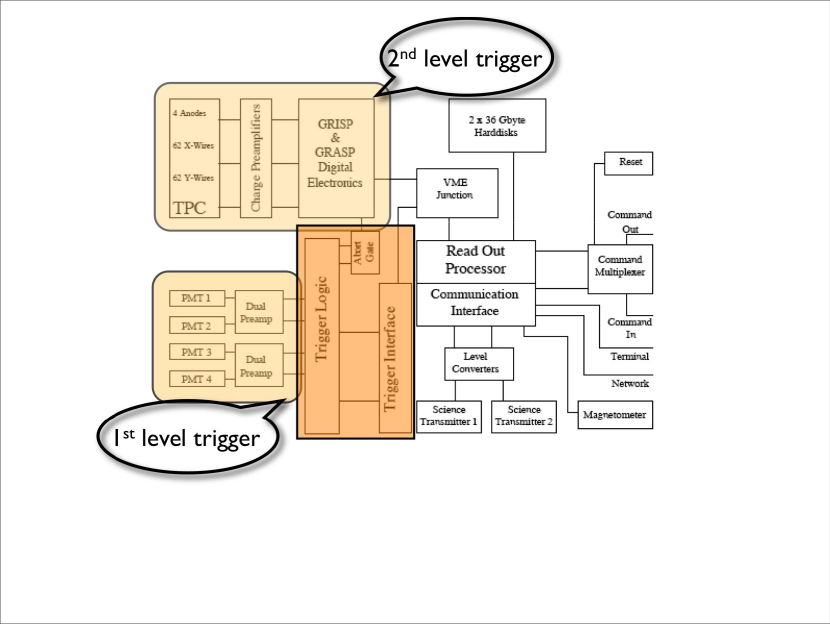
The event trigger works on two different levels: a first level trigger (FLT) which requires a signal from the PMTs and a second level trigger (SLT) which performs further selections based on the anode/wire signature. The interconnections of the LXeGRIT trigger system and readout electronics are shown schematically in Fig. 3.
2.1 First Level Trigger
The FLT is provided by the logical OR of the four PMTs (Electron Tubes 9813QA). These 2-inch-diameter tubes, with a quantum efficiency of about 15 at 178 nm, see the LXe volume through four 2.4 inch diameter quartz windows with good transparency in the UV (88% at normal incidence). The bottom of the fiducial volume and the quartz windows are separated by a 3 cm thick layer of LXe plus the collection region, about 1 cm thick. This large separation reduces the solid angle for events in the fiducial volume, and consequently the light yield. Additional light losses are due to total reflection at the window/PMT interface. Several photoelectrons are expected for every MeV of energy deposited in the fiducial volume [11]. The FLT, while allowing a fast (s) decision, is unable to select specific event categories of interest for Compton imaging. The 1999 balloon flight [12, 7] clearly demonstrated that, when the energy spectrum of the incident -rays is soft, as for the atmospheric -ray background, described by power law with spectral index 2, a high FLT efficiency is equivalent to accept a dominant fraction of events at low energies which are of little if any use for a CT, eventually reducing the efficiency for Compton imaging. For the 2000 flight, the light trigger efficiency was changed to minimize the shortcomings detected during the previous flight.
The efficiency was measured and resolved versus energy and position, following the procedure described in [13]. The collected data fall into three classes:
-
A.
events with an interaction detected in the fiducial volume (charge signal) and a light trigger which matches the external trigger – this class is the one contributing to the efficiency;
-
B.
events with an interaction detected in the fiducial volume and a light trigger which does not match the external trigger (just a chance coincidence count) – this class introduces a background in the measurement, that has to be accounted for;
-
C.
events with an interaction detected in the fiducial volume and without a light trigger – this class gives the inefficiency.
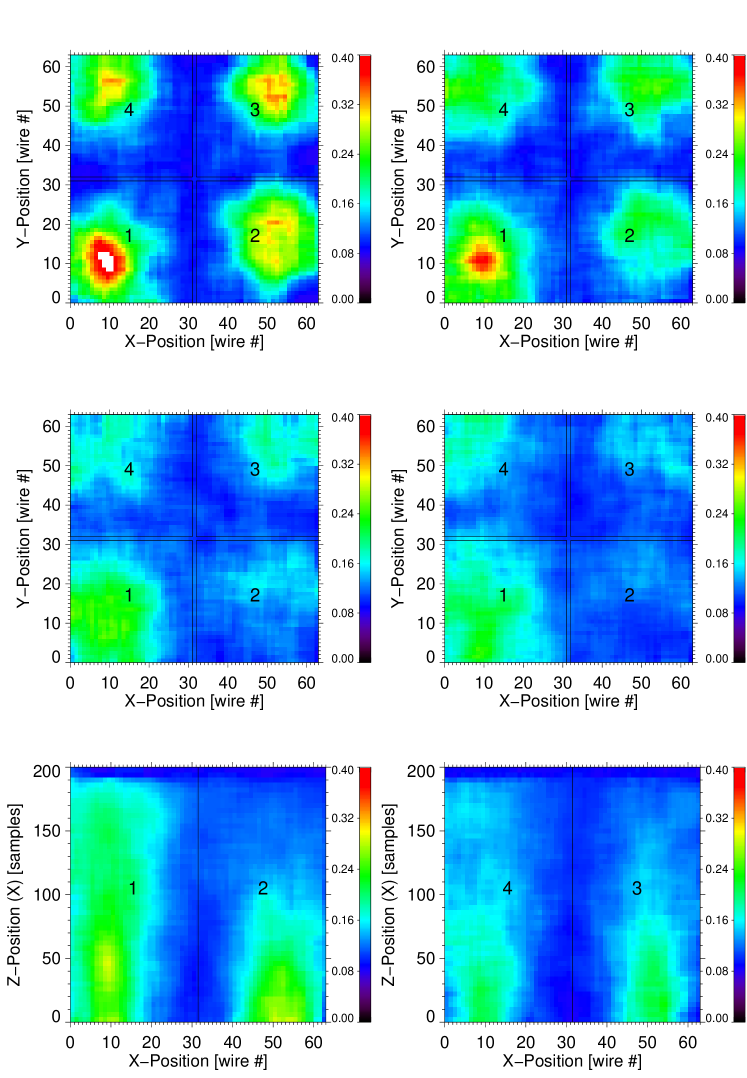
The efficiency is measured as the number of events in class A divided by the total number of events subtracted class B. The measurement described in [13] used a 22Na source, which emits three photons at the same time, one at 1.275 MeV and two at 0.511 MeV which are emitted back-to-back, so that one of the two 0.511 MeV photons could be used to tag the source. The spatial correlation of the two photons allowed a low contamination due to chance-coincidences. While this allowed a detailed measurement of the spatial dependency of the trigger efficiency for the 1999 balloon flight settings, the energy range of that measurement was limited up to 0.511 MeV, rather low for a detector designed to work up to 10 MeV. A similar measurement was repeated for the 2000 settings using an 88Y source, which emits simultaneously two photons at 0.898 and 1.836 MeV with little angular correlation, and, separately, a 22Na source. The sources were loosely tagged detecting one of the photons from the decay with a NaI(Tl) counter. Given a source rate of several kHz and a low tagging efficiency, the level of contamination due to chance coincidence counts was high, and, combined with the low efficiency in the 2000 settings, more events ended up in class B rather than in class A. Nonetheless, the fraction of events in class B is independently determined and the final result is then corrected for with good accuracy. In fact, the (drift time) distribution for events triggered by random coincidence has no physical meaning and extends above the nominal cathode position (7 cm), which delimitates the TPC active volume. This is visible in Fig. 4 where the distribution drops sharply at = 7 cm. The shape of the distribution for events in class B was determined through data where a random trigger was fed in as FLT. It did show no appreciable dependence on , so that the fraction of background events was read out from the distribution itself. The efficiency of the FLT is in this way measured for energies up to about 2 MeV. The efficiency was resolved in a four dimensional data space – energy, , , – as made possible by the imaging capability of the TPC. Since each event has to be spatially resolved and, at the same time, the four PMTs see the total energy deposited in the fiducial volume, the analysis was limited to 1-site events, for which a univocal association between total energy loss and position is given. The efficiency in the 4D space was described factoring out the energy dependence, i.e.
where is a position dependent weighting factor. The dependence of the efficiency on the deposited energy is shown in Fig. 5 for the four PMTs combined, using data from both 22Na and 88Y sources. A PMT mostly detects interactions happening within its own quadrant and very few events are detected by more than one PMT at the same time, because of the strong solid angle effect on light collection. The response of each PMT is measured and parameterized individually and the energy dependence is described analytically. For use in MonteCarlo simulations, the spatial dependence was parameterized in a lookup table with a granularity of 1.17 cm in and 1.8 cm in and (6 slices times 1111 bins in the plane). The dependence on is shown in Fig. 4 for one PMT. As expected, the efficiency decreases with increasing distance from the PMT’s location ( = -4 cm). The energy spectrum is the one in Fig. 5; selecting energy deposits larger than 1 MeV the overall efficiency is greatly increased. An example of efficiency map for the light trigger is shown in Fig. 6, as measured using a tagged 88Y source, integrated over all energies. The four panels correspond to four different slices, going from the bottom of the fiducial volume (upper-left) to the top (bottom-right), i.e. moving farther away from the PMTs. The impact of solid angle is apparent, and closer to the PMTs the overall efficiency is higher and less uniform. At locations corresponding to the four PMTs below the wire structure an enhanced efficiency is clearly visible.


2.2 Second Level Trigger
The SLT is provided by on-line selections based on the wire and anode signals:
-
i.
the event is built (see Sec. 2.3) and the number of threshold-crossings on the and wires (wire hits) is checked to be greater than a predefined minimum and less than a predefined maximum. This step requires little readout time, since each channel is 1 byte only. It is also sensitive to specific event multiplicities, relevant for a CT since Compton imaging requires at least two interactions;
-
ii.
the amplitude of the anode waveform is checked against a given threshold. Imposing a threshold on the anode waveform is very effective in rejecting low energy events which are useless for a CT, but, for LXeGRIT electronics, it requires to readout the digitized waveforms and the slowness of this process greatly reduces the usefulness of this on-line selection.
The SLT has proven to be a powerful tool, although critically dependent on the noise level of the wires, and requiring careful monitoring. The impact of the SLT was verified for each experiment by applying a posteriori the on-line selections to a sample of data acquired with full digitization of all wires. The outcome of one of these routine checks is shown in Figs. 7, 8 for data taken with an 88Y source placed a few meters away from the TPC. The minimum number of wire hits required both in the and in the wire plane was 6, the maximum 16. Each interaction usually gives 1 or 2 hits, depending on the energy deposit and the threshold of the specific wire. The maximum has no impact on -events and mainly filters out relativistic charged particles crossing the chamber and giving many hits at the same time. Ideally a minimum of 6 wire hits would select only events with 3 or more interactions, but in a situation with non-negligible electronic noise a certain fraction of 1-site events is accepted (see Fig. 8). Moreover, the fraction of accepted events depends on energy, since an interaction with large energy is more likely to be detected over noise. For events with multiplicity 3 or higher the SLT efficiency is above 1 MeV, where most of these events are. The main goal of this SLT filter is therefore to reject low energy (below 0.5 MeV) 1-site events, especially important when the -ray flux has a soft spectrum. This simple procedure just counts the number of wire hits and does not exploit the 3D imaging capability of the TPC. When data are analyzed off-line, the , and coordinates are matched and the contamination due to noisy events is reduced to a truly negligible level [14].


2.3 Data acquisition
The DAQ system developed for the 2000 flight of LXeGRIT is described in [10]. The total throughput of the system is limited to about 1.6 MB/s, restricting the event building rate to 40-50 events/s when data are taken in a mode that reads all information from anodes and wires, providing a full image of the chamber (in this case the event size is about 30 kB). The more usual data-taking mode transfers only wire waveforms which crossed preset thresholds together with the four anode waveforms and the maximum rate of built events increases to 200-400 Hz, the actual value heavily depending on the selection parameters and the specific source. In flight conditions and for typical settings the average event size is 5.5 kB.
The deadtime behavior of the system is non-paralysable with respect to the DAQ, i.e. the rate at the trigger level and the recorded count rate are related as [16]
where is the deadtime of the system, 3 ms in 2000 flight; for , kHz. The performance of the DAQ is usually the main limiting factor to the efficiency of LXeGRIT and imposes an upper limit to the maximum rate of useful events, i.e. events written to disk and made available for further analysis. Once this upper limit is saturated, the final efficiency for Compton imaging can be improved only by being more selective and enhancing the fraction of multi-site events in the final data sample. In comparison, the TPC itself, given a maximum charge collection time of about 40 s, is hardly dead-time limited in any realistic situation.
3 Monte Carlo simulation of the LXeGRIT detector
3.1 Mass model
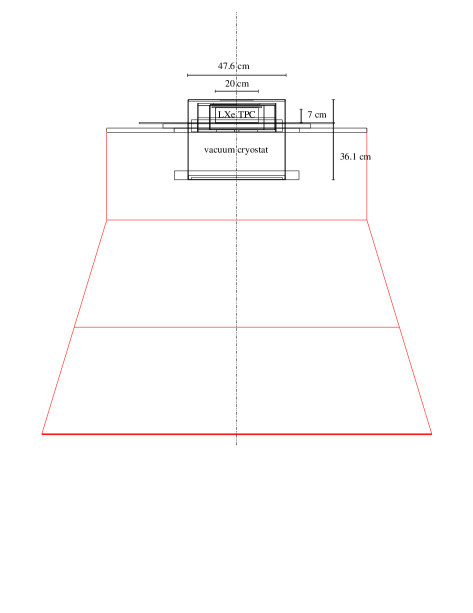
The LXeGRIT TPC, with an active volume of a 18.618.67 cm3 (2.4 l) is housed inside a stainless steel cylindrical vessel, with a diameter of 35 cm and 11.5 cm high, with an internal volume of about 10 l. The walls of the vessel are 3 mm thick, and the top flange is 10 mm thick, thinned to 5 mm in the area covering the TPC. Between the bottom of the active volume and the bottom flange there is a gap of 3.6 cm, filled with passive LXe. To reduce passive LXe around the TPC electrodes structure, stainless steel spacers are used on three sides (the fourth one housing the HV feedthrough). Thermal insulation of the cold vessel is provided by a vacuum cryostat. The lower section of the cryostat encloses the four PMTs with their HV divider circuits and the electronics boards used to decouple the HV bias to the wires from the signal coupling boards. The cryostat, also made out of stainless steel, has a cylindrical shape with 3 mm thick walls while and a 7 mm thick top flange, thinned to 5 mm above the sensitive area. The diameter of the vacuum cryostat is 47.6 cm and the height is 36.1 cm. The total mass, including LXe, is about 190 kg.
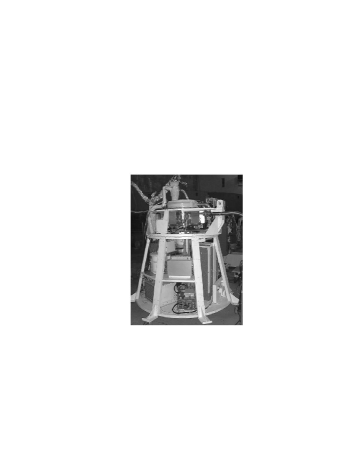
A picture of the LXeGRIT payload in 2000 flight’s gondola configuration, is shown in Fig. 9-. The various components of the equipment are rather evenly distributed and the most abundant material is by far aluminum. Including the gondola in the MC mass model is necessary when a large fraction of the -ray flux comes from below the LXeTPC, as it is the case for the atmospheric -ray flux [6]. The gondola is modelled as a truncated cone, 102 cm high with a diameter of 183 cm at the bottom and a diameter of 122 cm at the top(see Fig. 9-). A simplified mass model has been implemented, using parallel “disks and donuts” at four different locations in . Its main features are shown in Fig. 9-. The accuracy of this model is expected to be adequate when the -ray flux is azimuthally symmetric, or any azimuthal dependence is washed out by the spinning of the instrument around the axis.
MC studies of the performance of the LXeGRIT instrument have been based on the GEANT 3.21 detector simulation package [15]. Different -ray sources (from internal background to point-like monochromatic sources to diffuse sources with power law spectra) have been encoded in the simulation and are selectable through an input card file. For each interaction of a -ray tracked through the mass model, , , , energy deposit and interaction type are recorded; secondary Bremsstrahlung photons are tagged as such, regardless of their specific interaction mechanism. For each photon which deposits at least 10 keV in the fiducial volume, an entry is created in the output file. Up to this point, only the mass model of the detector and the physics of -ray interaction are accounted for. The other main effects are then introduced in this order: first, treatment of the charge signal; second, treatment of the light signal.
The response of the TPC to a charge signal is parameterized in terms of minimum energy threshold and minimum spatial separation required to resolve two close-by interactions. Based on extensive comparisons of experimental and MC generated data ([7]–Ch. 2 and 3), the minimum separation in the and coordinates is described by a normal distribution with mean value 5 mm, 3 mm RMS and a sharp minimum of 4 mm; for the coordinate a normal distribution with mean value 4 mm, 1 mm RMS and a sharp minimum of 3 mm is used. A pair of interactions must be resolved both in the and planes, but can be confused in or or . If this condition is not fulfilled the two interactions are clustered. The minimum energy threshold follows a normal distribution with mean value 150 keV, 40 keV RMS and a sharp minimum of 40 keV. This energy threshold is applied to each single interaction (after clustering) and not to the total energy loss in the fiducial volume. The minimum energy threshold and minimum separation match the performance of the TPC wire readout. The deposited energy is then smeared according to the measured energy resolution for the anode signals, (FWHM), where is the energy is MeV ([7]–Ch. 3). This model mainly describes the wire response, which sets an energy threshold higher than the anode threshold, together with providing a finer spatial resolution. Only the energy resolution is determined by the fitted anode signal.
The efficiency of the light trigger is applied to the MC data, where each event is described as a sequence of localized energy deposits (, , , ), , with the event multiplicity. The lookup tables described in Sec. 2.1 give the probability to trigger the detector for each individual (, , , ). For 1-site events this immediately gives the trigger probability for the entire event, while for multi-site events this is calculated combining the interactions. The corresponding statistical weight is then assigned to each -ray.
The part of the detector response due to further on-line checks (SLT) is introduced at this point of the data analysis, parameterized versus energy for each multiplicity, as shown in Sec. 2.2.
3.2 Event Multiplicity and Detection Efficiency
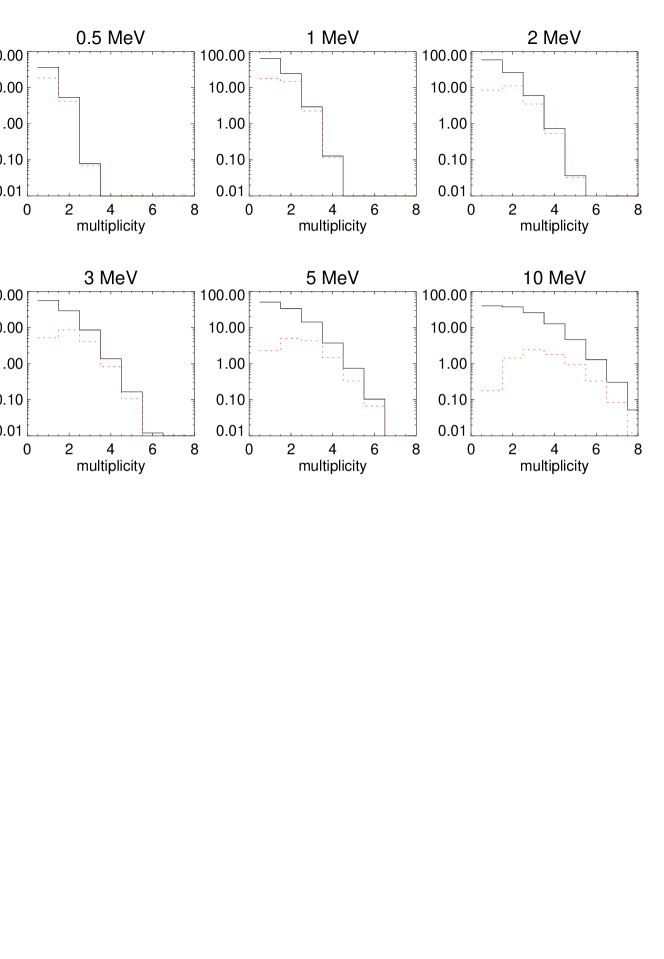
The interaction multiplicity for 0.5, 1, 2, 3, 5 and 10 MeV photons, for normal incidence and with the detector response as described above, but without including the response of the FLT and SLT, DAQ deadtime and off-line data analysis, is shown in Fig. 10. The same curves for fully contained events are superimposed. While the single site events are the most numerous at all energies, the fully contained events are more easily found in the multi site sample for energies exceeding 1 MeV. The interaction multiplicity is reduced compared to the true number of interactions a -ray undergoes before escaping the detector or being photoabsorbed. This reduction is due both to the 150 keV energy threshold and to the spatial confusion of closeby interactions. While the energy threshold implies a neat loss of detection efficiency, the effect of spatial confusion is to degrade the interaction multiplicity, even if the total energy is still correctly measured. At energies above 5 MeV the detected multiplicity may substantially exceed the number of interactions of the original photon, due to the presence of secondary Bremsstrahlung photons.
The detection efficiency calculated under the assumption of negligible FLT, SLT and off-line reconstruction inefficiencies is shown in Fig. 11, both for mere spectroscopy and Compton imaging. These results set an upper limit to the efficiency of the detector. As a calorimeter, efficiencies for different multiplicities can be summed up, while as a CT only efficiencies to double and multi site events can be combined. As a CT, the efficiency is overestimated even for negligible FLT and SLT inefficiencies, because multiple interactions have to be time-sequenced before proceeding to Compton imaging.

In Fig. 12 the relative effective area for sources at different angles from the vertical ( axis, in this case) is shown, defining the field-of-view (FoV) of the instrument. A power law spectrum with spectral index 2 was assumed, as is the case for the Crab Nebula. The large FoV is about 100∘ opening angle (FWHM) or 2.5 steradian. Two main parameters determine the FoV: the aspect ratio of detector diameter to depth and the amount of passive materials surrounding the detector. LXeGRIT has a large aspect ratio of 18.6:7, which is the dominant contributor to the decline in effective area with zenith angle. This geometrical effect is energy-independent. Absorption in passive materials, especially covering the side of the detector, yields an additional decline for fully contained events (left panel) at large zenith angles. This effect is energy-dependent, and most pronounced at low energies, as shown in the right panel for contained events. The variation in effective depth of the detector is a smaller energy-dependent effect.

4 Comparison of Experimental and Monte Carlo data
Figures 13, 14 and 15 show three examples of the accuracy of the Monte Carlo model in reproducing experimental data. Fig. 13 shows the energy spectrum for 1-site events from an 88Y source placed at a 2 m distance from the TPC, 30∘ off-axis. On the left, the energy spectrum for MC data before including FLT and SLT; on the right, the comparison of experimental data and MC data after including FLT and SLT. A similar comparison for 2-site events from the same exposure is shown in Fig. 14. Notice that the we use an absolute normalization, given the intensity of the source, which is the same for the energy spectra in Fig. 13 and in Fig. 14. The overall suppression of 1-site events and the reduction of the large Compton continuum below 0.5 MeV after FLT and SLT is apparent in Fig. 13. This is crucial for LXeGRIT, since its efficiency is limited by the DAQ livetime fraction.
Fig. 15 shows an Am-Be energy spectrum, combining multiplicities up to 3: since the cross-section for pair-production is large at 4.4 MeV, the single escape peak (3.92 MeV) is the dominant feature. The full energy peak (FEP) and the double escape peak are also well identified. At energies above 4 MeV Bremsstrahlung plays a non negligible role in LXe 111The critical energy Ec, above which Bremsstrahlung dominates ionization as an energy loss mechanism for electrons, is 11 MeV in LXe, but the energy spectrum is significantly modified by Bremsstrahlung for energies as low as 4 MeV. and it contributes to the lack of sharpness in the energy peaks. MC simulated data have been superimposed and the comparison shows that the main features are well reproduced. Neutrons from the source were not included in this simulation 222The intensity of the Am-Be source was unknown and the MC has been normalized to match the single escape peak..


4.1 A detailed example of efficiency calculation
A specific example of efficiency calculation for an 88Y source at a distance of 2 m, on-axis, is given in this section. 88Y emits two photons at 0.898 (branching ratio 94.4) and 1.836 MeV (100). The total source rate was 2738 kBq, therefore the source was emitting 1.836 MeV photons with a rate of 2738 kHz and 0.898 MeV photons with a rate of 2585 kHz. Taking into account a 5700 s exposure and solid angle, the 18.618.6 cm2 geometrical area of the TPC was hit by 1.08107 1.836 MeV photons and 1.01107 0.898 MeV photons. The DAQ livetime fraction was 50 livetime and the efficiency in writing to disk was only 18, for only that fraction of the bandwidth of disk writing was used. This last efficiency is usually 100. Correcting for these two inefficiencies, one is left with 9.7105 1.836 MeV photons and 9.1105 0.898 MeV photons. Counting the events in the two FEP gives the overall detection efficiency. This procedure introduces an uncertainty of about 5 because of the necessary background subtraction. The results are:
-
•
0.898 MeV: 0.39104 events, i.e. 0.43 efficiency
-
•
1.836 MeV: 1.30104 events, i.e. 1.34 efficiency
These small figures require some explanations. As discussed in Sec. 3.2, Fig. 11 gives an upper limit to the detection efficiency, including only the efficiency for containment and the inefficiency due to passive materials. It is about 18 at 0.898 MeV and 11 at 1.836 MeV. The light trigger efficiency alone reduces this detection efficiency by a factor of almost 9 at 0.898 MeV and a factor of 3 at 1.836 MeV. The SLT further reduces the efficiency by a factor of 3 at 0.898 MeV and a factor 1.7 at 1.836 MeV (Fig. 7, from the same experiment). This decreases the efficiency to 0.6 at 0.898 MeV and 1.9 at 1.836 MeV. Losses due to noisy wires, events with excessive baseline noise on the anodes, and other anomalous events identified and rejected in the off-line analysis, account for the missing part ([7]–Ch. 3, and [14]). The efficiency differs for different multiplicities, mainly as a result of the SLT, which is designed to enhance the fraction of multi-site events. Inefficiencies due to DAQ livetime and disk writing are independent of the interaction multiplicity, and the FLT efficiency has on average little dependence on the interaction multiplicity.
There are various sources of uncertainty on the specific efficiencies, some of them systematically lowering the final figure:
-
•
the overall measured efficiency is known quite precisely, the main uncertainty coming from the subtraction of the background beneath the line (%);
- •
-
•
for a typical data set, the SLT efficiency is known within 5 for all the multiplicities, statistics usually being the limiting factor;
-
•
the efficiency of the off-line procedure to extract the signal is more easily evaluated for 1-site events. In this case the efficiency in finding a good signal is very close to 100 for energies larger than few hundreds keV, and the 30 inefficiency comes from the fraction of “noisy” events rejected off-line. For multi-site events the efficiency can be lower since, for instance, the chance of not hitting a noisy wire decreases with interaction multiplicity.
-
•
the precision of the MC expectation before FLT and SLT should be within 5 once the assumed conditions are matched. Many factors can systematically reduce the detection efficiency: noisy or dead wires, higher energy thresholds etc. Again, these factors are more relevant for higher multiplicities.
It is clear from comparing the overall expected efficiencies to the measured ones, as in Fig. 11 (where the measured efficiencies have been corrected for the estimated FLT, SLT and off-line efficiencies), that the expectation is optimistic but within reason, the discrepancy ranging between 15 and 30 (roughly equivalent, for example, to the effect of 12 noisy wires out of 124), for different energies and multiplicities. As a conclusion, it is easy at this point to extrapolate what the efficiency would be if the DAQ could handle a 10 times larger rate. With a light trigger efficiency as high as the one obtained in 1999 for the same detector (50% or higher at 0.511 MeV, [13]) the final efficiency could be close to the one depicted in Sec. 3.2.
5 Conclusions
In this paper we have presented a study of the efficiency of the LXeGRIT instrument for detecting MeV -rays. We have shown that the detector response is well understood in its various components and well reproduced through MC methods. The LXeGRIT DAQ clearly constitutes a severe bottleneck when dealing with sources which generate a relatively high trigger rate (few kHz), not an uncommon situation, given the size of the LXeTPC. For the 2000 balloon flight in year 2000, we chose to reduce the efficiency at the trigger level, to specifically select multiple Compton events in the few-MeV region. The rationale of this choice was to to maximize the fraction of multiple Compton events given that the maximum event rate was fixed by saturating the DAQ bandwidth. If not limited by the current DAQ, this same prototype could have achieved a detection efficiency as a calorimeter close to 20 at 1 MeV, which can be obtained in the current configuration only for sources generating a trigger rate lower than 100 Hz.
Acknowledgments
This work was supported by NASA grant NAG5-5108 to the Columbia Astrophysics Laboratory.
References
- [1] V. Schönfelder (ed.), “The Universe in Gamma Rays”, Springer-Verlag (2001)
- [2] V. Schönfelder et al., ApJS 86 (1993) 657
- [3] E. Aprile et al., in: EUV, X-Ray and Gamma-Ray Instrumentation for Astronomy and Atomic Physics, eds., C.J. Hailey and O.H.W. Siegmund (1989)
- [4] F. Xu, Ph.D. Dissertation Thesis, Columbia University (1998)
- [5] E. Aprile et al., Nucl. Instr. and Meth. A 412 (1998) 425
-
[6]
A. Curioni et al., Vol. 4851 of Proc. of SPIE (2002) 151,
astro-ph/0211584 - [7] A. Curioni, Ph.D. Dissertation Thesis, Columbia University (2004)
- [8] T. Doke et al., Nucl. Instr. and Meth. A 291 (1990) 617
- [9] T. Takahashi et al., Phys. Rev. A12 (1975) 1771
-
[10]
E. Aprile et al., IEEE Trans. Nucl. Sci Vol. 48 NO 4 (2001) 1299,
astro-ph/0012276 - [11] E. Aprile et al., IEEE Trans. Nucl. Sci., Vol. 50 NO 5 (2002) 1303
-
[12]
E. Aprile et al., Vol. 4140 of Proc. of SPIE (2000) 333,
astro-ph/0012398 -
[13]
U. G. Oberlack et al., IEEE Trans. Nucl. Sci Vol. 48 NO 4 (2001) 1041,
astro-ph/0012395 -
[14]
U.G. Oberlack et al., in preparation
- [15] GEANT, Detector Description and Simulation Tools, CERN Program Library, Long Writeup W5013
- [16] G.F. Knoll, Radiation detection and measurements, 2nd ed. (Wiley, 1989)