Preprint of:
Wolfgang Singer, Timo A. Nieminen,
Norman R. Heckenberg and Halina Rubinsztein-Dunlop
“Collecting single molecules with conventional optical tweezers”
Physical Review E 75(1), 011916 (2007)
Collecting single molecules with conventional optical tweezers
Abstract
The size of particles which can be trapped in optical tweezers ranges from tens of nanometres to tens of micrometres. This size regime also includes large single molecules. Here we present experiments demonstrating that optical tweezers can be used to collect polyethylene oxide (PEO) molecules suspended in water. The molecules that accumulate in the focal volume do not aggregate and therefore represent a region of increased molecule concentration, which can be controlled by the trapping potential. We also present a model which relates the change in concentration to the trapping potential. Since many protein molecules have molecular weights for which this method is applicable the effect may be useful in assisting nucleation of protein crystals.
pacs:
87.80.Cc,83.85.Cg,83.85.EiOptical tweezers can trap and manipulate micrometer sized particles, and a variety of applications in physics, chemistry and biology have been explored Ashkin (1970); Grier (2003). The underlying principle is photon momentum transfer which, for a tightly focussed laser beam, results in the creation of a three-dimensional trapping potential Ashkin et al. (1986). The depth of the optically induced trapping potential is determined by, among other parameters, the polarizability of the trapped object and the intensity of the laser beam. The polarizability of a Rayleigh particle scales with its volume Svoboda and Block (1994). Since trapping of a particle requires a trapping potential which is sufficiently larger than the thermal energy of the particle, there is a minimum size of particle that can be trapped. Trapping of solid particles with sizes down to tens of nanometres has been reported Svoboda and Block (1994); Harada and Asakura (1996). Also aggregation of polymer chains with radii of gyration in this size regime in an optical field has been observed Smith et al. (1999). However, there are important thermodynamic differences between the trapping of particles that aggregate and particles that do not—in the latter case, the partial pressure due to the trapped particles increases as the concentration increases, while in the former, the number density does not increase. The trapping of large macromolecules has been demonstrated Katsura et al. (1998); Ichikawa et al. (2005), in this case DNA molecules of kDa, but there do not seem to have been any studies of the trapping of non-aggregrating molecules of sizes spanning the limits of what can be trapped, which is orders of magnitude smaller than this.
Here we report on experiments carried out with PEO molecules of different molecular weight (Sigma Aldrich, USA, kDa, 300 kDa, 900 kDa). We show that the concentration of molecules within the trapping region can be controlled and reversibly changed by the trapping power. We also show that only molecules above a certain molecular weight can be trapped.
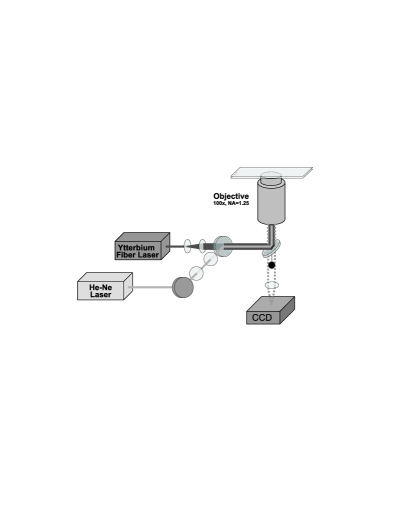
To create the trapping potential we used a standard tweezers setup, based on an inverted microscope (see figure 1), where the CW trapping laser (ytterbium fiber laser, 1064 nm, IPG, USA) was coupled into a , NA=1.25 objective (Olympus, Japan) and brought to a focus in the liquid containing the PEO molecules. The power of the trapping laser was varied between 0 and 0.7 W in the object plane. The temperature of the sample slide and the objective were kept constant using thermoelectric coolers.
To monitor the effects of the trapping potential on the PEO molecules a low power He-Ne laser (JDS Uniphase, USA) was aligned collinearly with the trapping laser beam, and focused onto the same position. The increased concentration of the initially homogeneously dispersed molecules in the focal region is associated with a higher index of refraction – as compared to the surrounding water – and thus resulted in scattering of the He-Ne light. To further increase the sensitivity of the setup we blocked the central portion of the He-Ne reflection, allowing only rays which are scattered at angles larger than those of the incident beam to reach the CCD camera. For this purpose the incident He-Ne laser beam did not fill the back aperture of the objective, thus a beam block between the dichroic mirror and the CCD camera could be used to discriminate between light reflected from the glass surfaces and the light scattered from the probe volume. The scattered light was monitored with a CCD camera, and its intensity was quantified using a MATLAB program evaluating the corresponding pixels.
The PEO was dissolved in deionized water and the whole sample was heated up to C for several days prior to use to ensure that the molecules were completely dissolved. The radii of gyration of the respective PEO molecules in water together with the respective overlap concentrations and the concentrations actually used are listed in table 1 Zebrowski et al. (2003); Bivash et al. (2002); Devanand and Selser (1991). The different sample solutions all had the same number density of dissolved PEO molecules (m-3). The corresponding PEO concentrations in the different samples were all well below the overlap concentration, thus the PEO molecules could be treated as single particles.
| molecular | gyration | overlap conc. | conc. of sample |
|---|---|---|---|
| weight [kDa] | radius [nm] | [wt %] / m-3 | [wt %] / m-3 |
| 100 | 17.6 Devanand and Selser (1991) | 0.48 Bivash et al. (2002) / 15033 | 0.01 / 313 |
| 300 | 33.5 Devanand and Selser (1991) | 0.36 Zebrowski et al. (2003) / 3758 | 0.027 / 281 |
| 900 | 63.6 Devanand and Selser (1991) | 0.16 Bivash et al. (2002) / 556 | 0.077 / 268 |
Since the power of the detection laser was kept constant for all measurements ( mW), the scattered light intensity was a measure of the increase of the concentration in the focal region. A trapping potential created by the fiber laser typically caused an increase of the intensity of the scattered light until it eventually reached a stable value (see figure 2). This value represented the steady-state equilibrium concentration for the given potential. The intensity of the scattered light increased exponentially, as the fit with a function of the type showed.
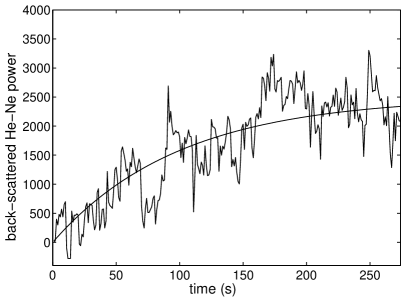
The typical timescales to reach the steady-state concentration were in the order of minutes, depending on trapping power. The long timescales rule out the possibility that the light scattering is caused by a temperature induced change of the refractive index of the medium, since temperature effects due to heating would occur in milliseconds Niemz (2004).
To demonstrate that the molecule concentration could be increased reversibly the trapping power was changed stepwise (figure 3(a)). Laser powers above a threshold power resulted in an increase of the concentration of the molecules in the focal volume, whereas trapping laser powers below the respective threshold power led the scattered light intensity to decrease to zero. This threshold behavior is similar to the switch–on behavior of the current–voltage characteristic of a diode. As for diodes, the relation is in fact exponential, which means that for trapping potentials above a certain threshold — the thermal energy — the concentration increases dramatically.
The intensity of the scattered He-Ne laser light depends on unknown parameters, like the elastic scattering properties of the PEO molecules. Thus the scattered light can not directly be used to quantify the concentration in the focal volume. Nevertheless, the intensity of the scattered light is a measure of the relative concentration change, and by fitting the experimentally obtained intensities with the mentioned exponential function, time-constants as a function of trapping laser powers could be obtained. The reciprocal of the time-constant can be called a collection rate, which we denote by .
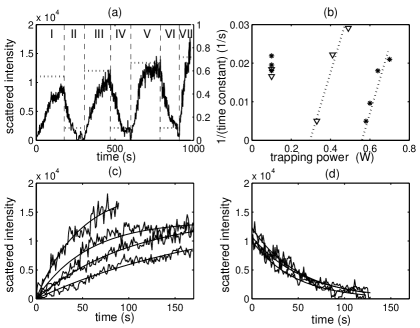
A summary of the collection rates as a function of the trapping power used for PEO molecules with molecular weight kDa and kDa is plotted in figure 3(b). For laser powers which cause an increase of the concentration the collection rate increases with the power of the trapping laser (figure 3(c)). From figure 3(b) the threshold trapping power for the respective molecular weight (in this case for kDa) could be extrapolated. We defined the threshold power for the different molecular weight PEO molecules at the intersection of the fitted straight line with the -axis. The threshold for the molecules with kDa is W, and for kDa is W.
As expected, the higher the molecular weight of the PEO molecules the lower the threshold trapping powers needed to confine the molecules. For PEO molecules with a molecular weight of kDa the concentration of the molecules could not be increased to a detectable level (using laser powers of up to 0.7 W).
If the laser power was below the threshold for the respective PEO molecules, the decrease of the scattered He-Ne light intensities had the same time-constants (independent of the scattered light intensity at the steady-state concentration). The time-constants for the kDa PEO molecules were slightly larger than the ones for the kDa molecules. This is consistent with theory which predicts smaller diffusion-coefficients for larger particles. This can be attributed to the fact that for laser powers below the threshold the decrease of the concentration of molecules in the focal volume is solely driven by diffusion. Thus the time-constants for the decrease are independent of the initial concentration.
This is in contrast to the increase of molecule concentration which dependents on the trapping potential, and consequently the time-constant depends on the trapping power.
Our finding that the time-constant depends on the trapping power is consistent with a calculation of the achievable trapping potential for a particle in a laser beam with a Gaussian intensity profile. Since the individual molecules are much smaller than the wavelength of the trapping laser the gradient force
| (1) |
can be calculated using Rayleigh scattering, where is the Poynting vector, and the other symbols have their usual meaning Harada and Asakura (1996); Stratton (1941). The quasi-static polarizability of a non-magnetic dielectric sphere of radius and refractive index , immersed in a medium of refractive index is given by Stratton (1941)
| (2) |
where denotes the relative refractive index. A comparison of the gyration radii of PEO in water with the stretched chain lengths Cooper et al. (1991) (m for 300 kDa, and 7.2 m for 900 kDa) of the PEO molecules shows that the individual molecules can be approximated as spheres with gyration radii . A subsequent integration of the gradient force over the beam profile
| (3) |
gives the trapping potential. Since the gradient force is proportional to the intensity gradient, the trapping potential at any point is simply proportional to the intensity at this point.
In order to trap a particle the trapping potential needs to be larger than the mean thermal energy of the particle. On this account we calculated a contour for which the particle has to overcome a potential of to escape the trap. This contour is associated with a certain surface area, and this surface area increases with the trapping power. The increase is due to the fact that for higher laser powers a potential depth of is already created at larger distances from the focal point.
The extension of the ‘’ surface area with the laser power is reflected by the decreased time-constant necessary to reach the steady-state intensity. This can be illustrated by visualizing the equi-intensity contour as an event horizon, which has a larger surface area for higher laser powers, and a smaller for lower powers. The event horizon divides the liquid into a region where particles can freely diffuse, and a region (the volume inside of the contour) where the particles remain trapped, once they have entered this region (by diffusion). Since the potential of the trap outside of this event horizon is too small to attract particles the trap can only be loaded by passive diffusion of the particles suspended in the surrounding liquid. Particles which diffuse through the mentioned surface area get trapped in the focal volume. Since those particles can no longer diffuse out of the trap, the concentration in the focal volume increases with time. Since the area of the surface determines how many particles per time diffuse through it, it directly determines the initial collection rate.
If the trapping power is below the threshold, the particles can diffuse out of the trap. The time-constant for the diffusion out of the trap is (for ) is only determined by the diffusion coefficient of the particles in the liquid.
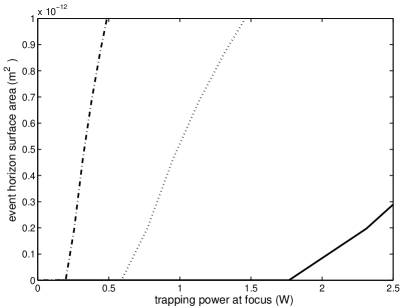
The thermal energy of a molecule does not depend on its molecular weight. Consequently, the threshold trapping potential necessary for stable trapping is independent of the molecular weight. However, since the achievable trapping potential for a given trapping laser power does depend on the molecular weight, molecules with different molecular weight (and therefore different polarizabilities, see eqn. (2)) have different threshold trapping powers, as confirmed by both our experiments (fig. (3b)) and our calculations (fig. 4). Both our results and calculations also show that for the trapping powers we used (W) the achievable trapping potential for molecules with molecular weight of kDa was not sufficient to stably confine these molecules.
While it is tempting to conclude that the qualitative agreement between theoretical expectations and our observations allow us to definitively identify optical trapping as the mechanism responsible for the increase in concentration of PEO molecules, it is important to rule out other possible mechanisms that might contribute. For example, the combination of convection and thermophoresis was used to Braun and Libchaber Braun and Libchaber (2002) to trap DNA. It should be noted that the geometry used by Braun and Libchaber differs significantly from ours — their trapping occurred in the bottom 5 m of their sample chamber, while in our experiments, the molecules are trapped in a volume of approximately 1 m 1 m 3 m located 60 m above the bottom of our sample chamber (which had a total depth of 500 m). Therefore, the interaction between convection, thermophoresis, and the chamber floor that allowed trapping by Braun and Libchaber cannot occur in our experiment. As both the objective and sample slide in our experiment were maintained at a constant temperature, the only heating would be in the vicinity of the focus, which is where we observed the increase in concentration. Noting that the Soret coefficient of PEO in water is positive Kita et al. (2004), thermophoresis would oppose trapping, and can be discounted as a mechanism responsible for trapping — in the absence of the three-way interaction between temperature gradient, convection, and chamber bottom, thermophoresis alone would act to reduce the concentration.
We can estimate an upper limit to convective flow in the trap. At the maximum power we had available, the expected temperature rise, not accounting for the effect of cooling the sample slide or objective, would be 13 K Peterman et al. (2003). As this heating is localised in the focal region, we can approximate it as a uniformly heated sphere of water, surrounded by cooler water. Over-estimating (since we shall be content with an upper limit) the size of such as sphere as 10 m in diameter, the net upward force due to the reduced density is 0.019 pN, which will be in equilibrium with viscous drag at a speed of 0.2 m/s. The actual flow speed is likely to be much slower (for example, assuming a diameter of 5 m, also still an overestimate, gives a speed of 0.06 m/s). In any case, convective flow would be fastest in the focal volume of the trap, and act against trapping by pulling particles out of the trap through viscous drag. It is possible that convective flow might deliver PEO molecules to the trap, but unless the optical gradient force can exceed the drag, the molecules will not be trapped.
As both thermophoresis and convection can be ruled out as causes of the trapping we observed, this leaves optical gradient forces as by far the most likely mechanism at work. Thus we can, with confidence, state that we have optically trapped the PEO molecules.
We have shown that using optical tweezers it is possible to locally increase the molecule concentration of large molecules. We propose that this method could be used to assist nucleation of protein crystals. In contrast to conventional methods—where nucleation is triggered by changing the properties of the whole growing medium—the suggested tweezers-assisted nucleation would favor the creation of only one nucleation site in the entire solution. The ability to affect molecules increases with molecular weight. Crystals of large proteins are especially difficult to grow, and their structure cannot be analyzed using alternative methods like NMR Tugarinov et al. (2004). For smaller protein molecules, alternatively, the concentration of a large molecular weight precipitant could be increased, which results in a lower saturation concentration of the respective proteins.
We would like to acknowledge the support from the University of Queensland and the Australian Research Council.
References
- Ashkin (1970) A. Ashkin, Physical Review Letters 24, 156 (1970).
- Grier (2003) D. G. Grier, Nature 424, 810 (2003).
- Ashkin et al. (1986) A. Ashkin, J. M. Dziedzic, J. E. Bjorkholm, and S. Chu, Optics Letters 11, 288 (1986).
- Svoboda and Block (1994) K. Svoboda and S. M. Block, Optics Letters 19, 930 (1994).
- Harada and Asakura (1996) Y. Harada and T. Asakura, Opt. Comm. 124, 529 (1996).
- Smith et al. (1999) T. A. Smith, J. I. Hotta, K. Sasaki, H. Masuhara, and Y. Itoh, J. Phys. Chem. 103, 1600 (1999).
- Katsura et al. (1998) S. Katsura, K. Hirano, and Y. Matsuzawa, and K. Yoshikawa, and A. Mizuno, Nucleic Acids Research 26, 4943 (1998).
- Ichikawa et al. (2005) M. Ichikawa, Y. Matsuzawa, and K. Yoshikawa, J. Phys. Soc. Japan 74, 1958 (2005).
- Zebrowski et al. (2003) J. Zebrowski, V. Prasad, W. Zhang, L. M. Walker, and D. A. Weitz, Physicochem. Eng. Aspects 213, 189 (2003).
- Bivash et al. (2002) B. R. Bivash, Dasgupta, S.-Y. Tee, J. C. Crocker, B. J. Frisken, and D. A. Weitz, Phys. Rev. E 65, 051505 (2002).
- Devanand and Selser (1991) K. Devanand and J. C. Selser, Macromolecules 24, 5943 (1991).
- Niemz (2004) M. H. Niemz, Laser-Tissue Interactions, Fundamentals and Applications (Springer Verlag, 2004).
- Stratton (1941) J. A. Stratton, Electromagnetic Theory (McGraw-Hill, 1941).
- Cooper et al. (1991) E. C. Cooper, P. Johnson, and A. M. Donald, Polymer 32, 2815 (1991).
- Braun and Libchaber (2002) D. Braun and A. Libchaber, Phys. Rev. Lett. 89, 188103 (2002).
- Kita et al. (2004) R. Kita, S. Wiegand, and J. Luettmer-Strathmann, J. Chem. Phys. 121, 3874 (2004).
- Peterman et al. (2003) E. J. G. Peterman, F. Gittes, and C. F. Schmidt, Biophys. J. 84, 1308 (2003).
- Tugarinov et al. (2004) V. Tugarinov, P. M. Hwang, and L. E. Kay, Annu. Rev. Biochem. 73, 107 (2004).