Comment on “Taleyarkhan et al. Reply:”
In their Reply Taleyarkhan et al. (2006a) to my previous Comment Naranjo (2006), Taleyarkhan and coauthors measure their detectors’ responses to a source, concluding that the resulting spectra differ substantially from the cavitation-fusion spectra published earlier in their Letter Taleyarkhan et al. (2006b). On the contrary, I conclude that the two data sets are qualitatively consistent.
NE-213 neutron spectra.
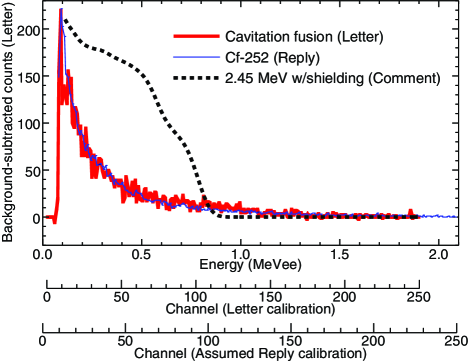
To compare proton-recoil spectra, their scales must first be calibrated, typically to equivalent electron energy via calibration sources. Though the authors provided and calibrations in their Letter (see Fig. 1(a) of my previous Comment), in their Reply, they do not provide a calibration along with their spectrum. Nevertheless, their detector’s response to , and the corresponding and calibrations, are given in Figs. 5(b) and 4 of Ref. Xu and Butt (2005). Comparison of the calibrated and the uncalibrated spectra shows that the detector’s gain was approximately 10% less in the Reply than in the Letter. Using this calibration for the Reply spectrum, Fig. 1 shows the Reply’s spectrum to be consistent with the Letter’s cavitation-fusion spectrum.
NaI(Tl) gamma spectra.
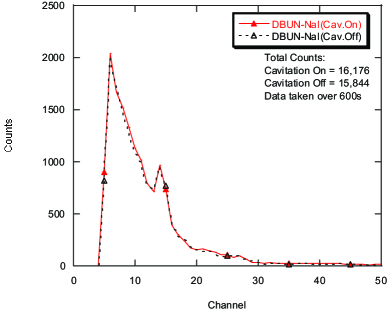
In Fig. 1(b) of the Reply, the authors compare their “cavitation on” spectrum against an experimental spectrum. As shown in Fig. 15(a) of the Letter’s supplement tal (reproduced here in Fig. 2), the “cavitation on” spectrum is within approximately 2% of the “cavitation off” background spectrum. Consequently, they are comparing the spectrum against the natural background, not the cavitation fusion signal. For example, the peak at channel 14, also present in their undeuterated control runs, is due to ’s 1.46 MeV , the predominant feature of the terrestrial background Petrasso et al. (1989). These features do not appear in the Reply spectrum because their relatively intense source, placed only 30 cm from the detector, overwhelms the natural background.
The appropriate comparison would be between the spectrum and the background-subtracted cavitation-fusion signal. In this case, however, the subtracted signal is a small fraction of the background, and the error on a channel’s count difference would be of greater magnitude than the difference itself. For example, in channel 14, there were approximately 970 ‘on’ counts and 940 ‘off’ counts, yielding a difference of . Such a comparison would therefore be unfortunately inadequate to distinguish between and DD-fusion.
In conclusion, Taleyarkhan and coauthors’ cavitation-fusion spectra are consistent with their own spectra.
Acknowledgements.
I thank S. Putterman for valuable discussions. This work is supported by DARPA. B. NaranjoUCLA Department of Physics and Astronomy
Los Angeles, California 90095, USA
February 1, 2007
PACS numbers: 78.60.Mq, 25.45.-z, 28.20.-v, 28.52.-s
References
- Taleyarkhan et al. (2006a) R. P. Taleyarkhan, R. C. Block, R. T. Lahey, Jr., R. I. Nigmatulin, and Y. Xu, Phys. Rev. Lett. 97, 149404 (2006a).
- Naranjo (2006) B. Naranjo, Phys. Rev. Lett. 97, 149403 (2006).
- Taleyarkhan et al. (2006b) R. P. Taleyarkhan, C. D. West, R. T. Lahey, Jr., R. I. Nigmatulin, R. C. Block, and Y. Xu, Phys. Rev. Lett. 96, 034301 (2006b).
- Xu and Butt (2005) Y. Xu and A. Butt, Nucl. Eng. Des. 235, 1317 (2005).
- (5) R. P. Taleyarkhan et al., EPAPS Document No. E-PRLTAO-96-019605.
- Zmeskal et al. (1990) J. Zmeskal et al., Phys. Rev. A 42, 1165 (1990).
- Nagele et al. (1989) N. Nägele et al., Nucl. Phys. A 493, 397 (1989).
- Petrasso et al. (1989) R. D. Petrasso, X. Chen, K. W. Wenzel, R. R. Parker, C. K. Li, and C. Fiore, Nature 339, 183 (1989).