Social dilemmas in an online social network: the structure and evolution of cooperation
Abstract
We investigate two paradigms for studying the evolution of cooperation—Prisoner’s Dilemma and Snowdrift game in an online friendship network obtained from a social networking site. We demonstrate that such social network has small-world property and degree distribution has a power-law tail. Besides, it has hierarchical organizations and exhibits disassortative mixing pattern. We study the evolutionary version of the two types of games on it. It is found that enhancement and sustainment of cooperative behaviors are attributable to the underlying network topological organization. It is also shown that cooperators can survive when confronted with the invasion of defectors throughout the entire ranges of parameters of both games. The evolution of cooperation on empirical networks is influenced by various network effects in a combined manner, compared with that on model networks. Our results can help understand the cooperative behaviors in human groups and society.
keywords:
Social networks , Prisoner’s Dilemma , Snowdrift game , Cooperation , Network effectsPACS:
89.75.Hc , 87.23.Ge , 02.50.Le., , ,
1 Introduction
Cooperative behaviors (mutualism and altruism) are ubiquitous in human society as well as in virtual online community. For instance, people unselfishly and collaboratively recommend commodities such as books, songs, CD/DVDs, etc to each other. Accordingly, this cooperative behavior (collaborative recommendation) promotes the long tail which is the success foundation of Amazon and eBay [1]. And yet, according to Darwinism, natural selection is based on competition. How can natural selection lead to cooperation among selfish individuals? Fortunately, together with classic game theory, evolutionary game theory provides a systematic framework for investigating the emergence and maintenance of cooperative behavior among unrelated and selfish individuals. Two simple games, namely, Prisoner’s Dilemma game (PDG) and Snowdrift game (SG), as metaphors for studying the evolution of cooperation have been extensively adopted by researchers from different background [2, 3, 4, 5, 6, 7]. In the original PDG, two players simultaneously decide whether to cooperate (C) or to defect (D). They both receive upon mutual cooperation and upon mutual defection. A defector exploiting a C player gets , and the exploited cooperator receives , such that . As a result, it is best to defect regardless of the co-player’s decision. Thus, in well-mixed infinite populations, defection is the evolutionarily stable strategy (ESS) [8], even though all individuals would be better off if they cooperated. Thereby this creates the social dilemma, because when everybody defects, the mean population payoff is lower than that when everybody cooperates. Whereas in the SG, the order of and is exchanged, such that . Its essential ingredient is that in contrast to the PDG, cooperation has an advantage when rare, which implies that the replicator dynamics of the SG converges to a mixed stable equilibrium where both C and D strategies are present [8]. It is important to note that in this state the population payoff is smaller than it would be if everyone played C, hence the SG still represents a social dilemma [9]. In addition, the SG is of much applications and interests within biological context. In order to solve these social dilemmas, a variety of suitable extensions on these basic models has been investigated [3, 5, 6, 7]. Most importantly, it is found that cooperation can be promoted and sustained in the network-structured population substantially [6, 10, 11]. Indeed, the successful development of network science provides a convenient framework for describing the dynamical interactions of games. The evolution of cooperation on model networks with features such as lattices [12, 13, 14, 15], small-world [17, 16, 18], scale-free [6], and community structure [19] has been scrutinized. Moreover, the understanding of the effect of network structure on the evolution of cooperation reaches to consensus gradually: the heterogeneity of the network of contacts plays a significant role in the emergence of cooperation. However, the puzzle of cooperation is unanswered yet. What on earth conditions the emergence of cooperation is still a challenging problem [20, 21]. Most noteworthy, Nowak summarized five possible rules for the evolution of cooperation corresponding to different situations (see Ref. [22] and references therein). Nevertheless, to our best knowledge, these results are mostly based upon simplified scenario and model. To inspect the evolution of cooperation, further details and characteristics of real world should be considered and integrated.
The World Wide Web (WWW) in its first decade was like a big online library, where people mainly searched for information. Today, owing to new social technologies, the web is undergoing a subtle but profound shift, dubbed Web 2.0, to become more of a social web, not unlike the WWW inventor Tim Berners-Lee’s original vision. The use of collaborative technologies such as blogs and wikis also leads to change of the ways of people’s thinking and communicating. People, especially college students, take advantage of online social network services for messaging, sharing information, and keeping in touch with each other. This creates an emerging online community which is largely being shaped by dynamic interactions between users in real time. Therefore, these services provide an extraordinary online laboratory to study dynamic pattern of social interactions conveniently and effectively. In what follows, the two aforementioned metaphors—PDG and SG in an empirical social network will be examined.
In this paper, we present our observations into a Chinese social networking site open to college students (the social networking site Xiaonei, which began in late 2005 in select universities, but grew quickly to encompass a very large number of universities.). We empirically study the evolution of cooperation on such online social network which retains the essential of real-world social interactions. In particular, it is suggested that the evolution of cooperation on empirical social networks is influenced by a variey of network effects, including heterogeneity, small-world effect, local highly-connected clusters, average connectivity, etc. In the rest of this paper, first, we will analyze the structure of the online social network, then investigate the two social dilemmas (PDG and SG) on this social network by the method analogous to replicator dynamics, observing the time evolution of cooperation. After that, we discuss the simulation results and make explanations. Finally, we draw the conclusion remarks.
2 The structure of the online social network
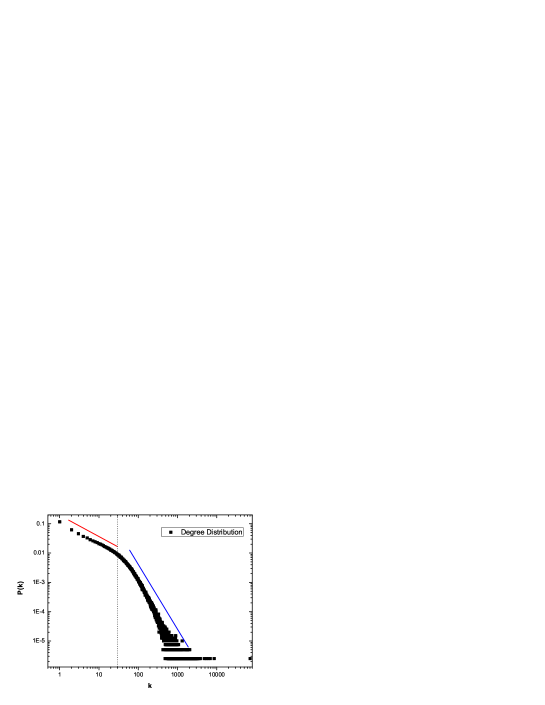
The actual relational data was obtained from a Chinese social networking site open to college students. We focus on the connected component, which is composed of nodes and bidirectional edges (we viewed this network as undirected one). We perform statistical analysis of the structure of this social network. The quantities such as degree distribution, clustering coefficient, average shortest path length, etc are calculated to capture the features of the online social network. In Fig. 1, we report the degree distribution , which gives the probability that randomly selected node has exactly edges. Clearly, we can see that follows two different scalings with , depending on the specified critical degree value . obeys a power-law form with when . Otherwise, , where for . The degree distribution above the critical degree is consistent with past findings of social networks with the degree exponent [23]. Whereas, for small degree below , the scaling exponent of is less than two. Considerable fraction of nodes have only low connectivity (see Tab. 1). About nodes’ degrees are not more than 30. The average degree is .
| k= | 1 | 2 | 3 | 4 | 5 |
|---|---|---|---|---|---|
| 11.6% | 6.2% | 4.6% | 3.7% | 3.3% |
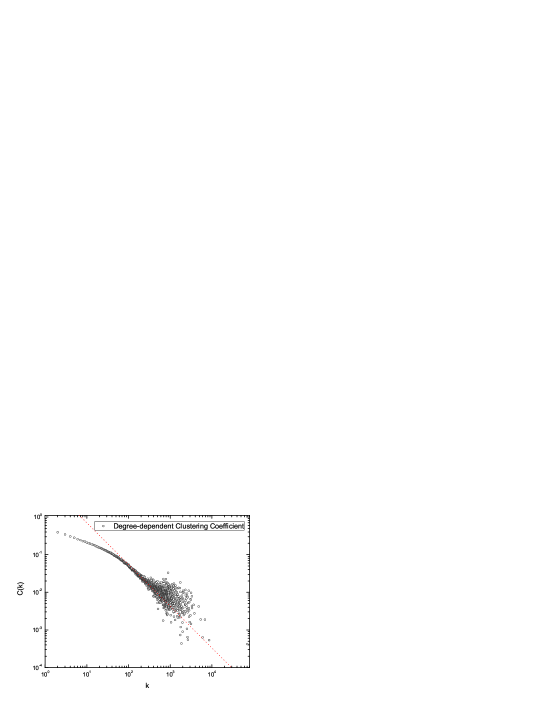
The length of average shortest path is calculated, which is the mean of geodesic distance between any pairs that have at least a path connecting them. In this case, . And the diameter of this social networks which is defined as the maximum of the shortest path length, is . The clustering coefficient of node is defined as , that is the ratio between the number of edges that actually exit between these neighbor nodes of node and the total number . The clustering coefficient of the whole network is the average of all individual ’s. We find the clustering coefficient , order of magnitude much higher than that of a corresponding random graph of the same size . Besides, the degree-dependent local clustering coefficient is averaging over vertices of degree . Fig. 2 plots the distribution of vs. . For clarity, we add the dot line with slope in the log-log scale. However, it is hard to declare a clear power law in our case. Nevertheless, the nonflat clustering coefficient distributions shown in the figure suggests that the dependency of on is nontrivial, and thus points to some degree of hierarchy in the networks. In many networks, the average clustering coefficient exhibits a highly nontrivial behavior with a power-law decay as a function of [24], indicating that low-degree nodes generally belong to well-interconnected communities (corresponding to high clustering coefficient of the low-connectivity nodes), while high-degree sites are linked to many nodes that may belong to different groups (resulting in small clustering coefficient of the large-degree nodes). This is generally the feature of a nontrivial architecture in which small-degree vertices are well-clustered around the hubs (high degree vertices), and organized in a hierarchical manner into increasingly large groups. Thus, our empirical social network has such fundamental characteristic of hierarchy.
Another important element characterizing the local organization of complex networks is the degree correlation of node and its neighbor. Following Newman [25], assortativity coefficient is measured by the Pearson correlation coefficient of the degrees at either ends of an edge, which can be written as
| (1) |
where are the degrees of the vertices at the ends of the th edge, with ( is the total number of edges in the observed graph or network). We calculate the degree assortativity coefficient (or degree-degree correlation) of the online social network. In our case, , which means the social network shows “disassortative mixing” on its degrees. Networks with assortative mixing pattern are those in which nodes with large degree tend to be connected to other nodes with many connections and vice visa. Technical and biological networks are in general disassortative, while social networks are often assortatively mixed as demonstrated by the study on scientific collaboration networks [25]. Internet dating community, a kind of social networks embedded in a technical one, and peer to peer (P2P) social networks are similar to our case, displaying a significant disassortative mixing pattern [26, 27].
Herein, we have presented the structural analysis of our online social network. The observed network has small-world property, that is, high clustering coefficient and short average shortest path length. Moreover, it is an inhomogeneous one, namely, the tail of degree distribution obeys a power law. Additionally, it has nontrivial hierarchical organizations—low-degree nodes generally belong to well-interconnected clusters, while high-degree vertices are linked to many nodes that may belong to different groups. Besides, it exhibits disassortative mixing pattern. In the successive section, we will investigate the evolution of cooperation in the social network, revealing the cooperation level is affected by the topological organizations of the social network.
3 Social dilemmas on the social network
We consider the evolutionary PDG and SG on the sampled social network (composed of nodes) which is a good representative of the original large-scale one. Each vertex represents an individual and the edges denote links between players in terms of game dynamical interaction. The individuals are pure strategists, following two simple strategies: cooperate (C) and defect (D). The spatial distribution of strategies is described by a two-dimensional unit vector for each player , namely,
| (2) |
for cooperators and defectors, respectively. Each individual plays the PDG/SG with its immediate “neighbors” defined by their who-meets-whom relationships and the incomes are accumulated. The total income of the player at the site can be expressed as
| (3) |
where the denotes the neighboring sites of , and the sum runs over neighbor set of the site . Following common practice [3, 9, 12, 28], the payoff matrices have rescaled forms for PDG and SG respectively,
| (4) |
where and .
In evolutionary games the players are allowed to adopt the
strategies of their neighbors after each round. Then, the
individual randomly selects a neighbor for possibly
updating its strategy. The site will adopt ’s strategy with
probability determined by the total payoff difference between
them [12]:
| (5) |
where the parameter characterizes the noise effects, including fluctuations in payoffs, errors in decision, individual trials, etc. denotes the complete rationality, in which the individual always adopts the better strategy determinately. Whereas denotes the complete randomness of decision. For finite value of , it introduces bounded rationality to individual’s decision making.
In what follows, we present our investigations to the two social dilemmas played by individuals occupying the vertices of the sampled social network. The evolution of the frequency of cooperators as a function of the parameter for PDG and for SG is obtained. Besides, we also observe the time evolution of cooperators under different values of (). Initially, an equal percentage of cooperators and defectors is randomly distributed among the elements of the population. Here, we adopt the synchronous updating rule. Each individual will adapt its strategy according to Eq. (5) after each round game. Equilibrium frequencies of cooperators are obtained by averaging over 1000 generations after a transient time of 20000 generations. Each data point results from averaging over 100 runs. In the following simulations, is kept invariant [29].
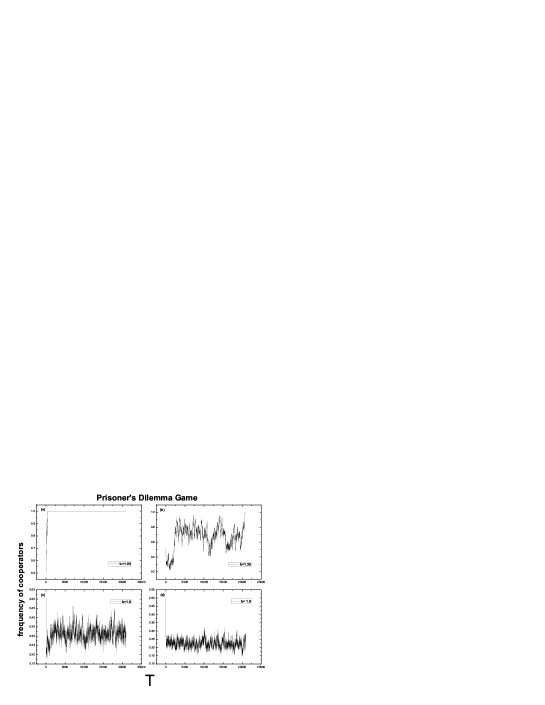
In Fig. 3, we report the frequency of cooperators as a function of temptation to defect in PDG. It is clear that nontrivially decreases with increasing . Note that the cooperation level is not as remarkable as that in model scale-free network [Barabási-Albert (BA)], especially for small . Nonetheless, the cooperators can survive for the entire range of (), avoiding dying out, when confronted with the intense invasion of advantaged defectors. Replicator dynamics in well-mixed population points out defection is the only evolutionarily stable strategy (ESS) in PDG. Hence cooperators will be wiped out by natural selection in well-mixed populations. In fact, interactions in real-world are heterogeneous, in the sense that different individuals have different numbers of average neighbors with whom they interact with, a feature associated with a power-law dependence of the degree distribution. Previous study on model BA scale-free network, which captures the real-world heterogeneity, found that scale-free networks provide a unifying framework for emergence of cooperation [6, 10, 11]. Here, our empirical study also provides a convincing evidence that degree heterogeneity is one of the factors promoting cooperation in realistic social networks. It is shown the time evolution of cooperation in PDG corresponding to different values of in Fig. 4. For small near one, starting from 50% cooperators, cooperators dominate the populations. When increases, the frequency of cooperation is diminished in a manner that cooperation level drop rapidly down at first, after generations and generations, the frequency of cooperation struggles to recover to a higher level (see Panels (b) and (c) in Fig. 4). For large near two, although defectors prevail in the networked populations, cooperators still can survive in such tough environment (about 10% on average).

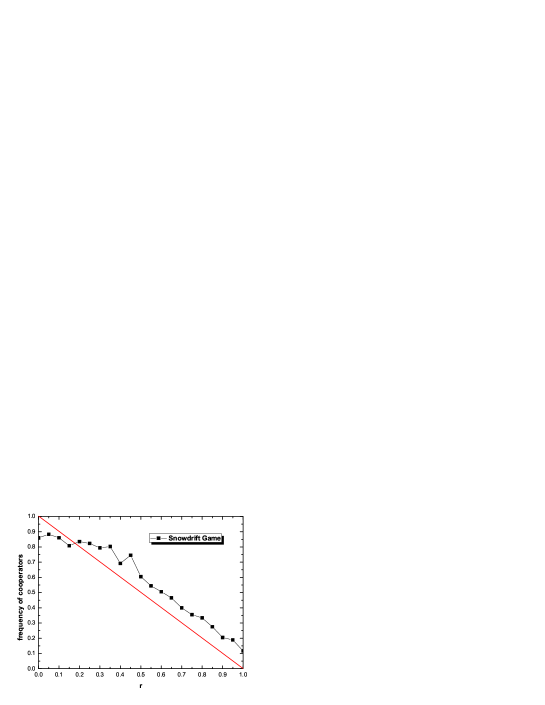
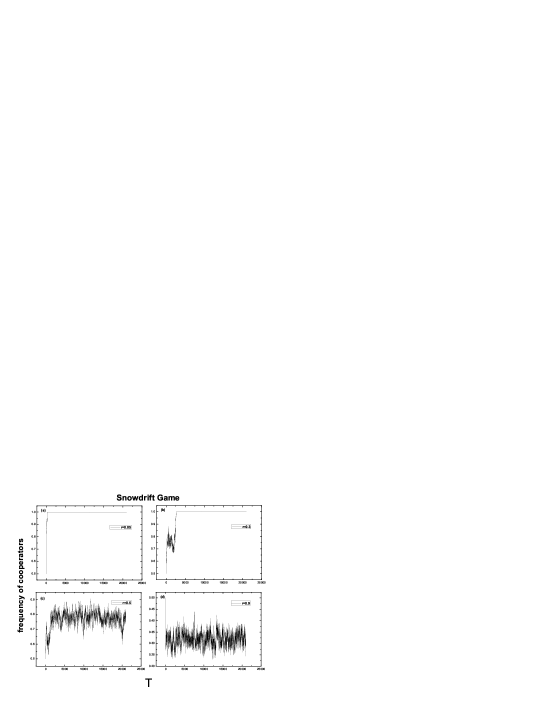
In parallel, the evolution of cooperation as a function of cost-to-benefit ratio of mutual cooperation for SG is presented in Fig. 5. In well-mixed scenario, replicator dynamics of the SG converges to an equilibrium frequency for cooperators given by , corresponding to the red straight line as shown in Fig. 5. Except for small value near zero, the cooperation level on our empirical social network is higher than that in the well-mixed situation. Thus cooperation is enhanced in our case. Generally speaking, because our social network incorporates various features, including heterogeneity, of which effects to cooperation are additive, the cooperation level is not promoted as much as in model BA scale-free networks where the cooperation level is mainly affected by heterogeneity. And also, we investigated the time evolution of cooperation for SG, as displayed in Fig. 6. For small value of , the population frequently evolves into an absorbing state of full cooperators when starting from an equal percentage of cooperators and defectors [see Fig. 6(a) and (b)]. As , the frequency of cooperators decreases from 50% quickly, and oscillates around the dynamic equilibrium state.
Moreover, fraction of runs which ended with full cooperators vs. for PDG and for SG is shown in Fig. 7. For each value of and , we ran 100 independent simulations, starting from cooperators. We found that, for in PDG and in SG, the networked population evolves into absorbing state of full cooperators with a probability around 50%. In this situation, except for some individual runs ending up with full cooperators, others ended up with low frequency of cooperation on occasion as a result of the different initial distributions of cooperators and defectors among the population. However, when for PDG and for SG, most of the runs ended up with massive defectors which resulted in the low frequency of cooperation. Accordingly, even though the network structure promotes cooperation, its positive influence to the evolution of cooperation is to some extent suppressed by the increasing parameters and .
On the other hand, together with heterogeneity, other factors including average connectivity [30], small-world effect [17], degree-degree correlation [31], randomness in topology [32], etc, play crucial roles in the evolution of cooperation. Rather than investigations on model networks where only one or few features of real-world relationships are present, the evolution of cooperation on the empirical social networks, which possess a variety of features in topological organizations, should be understood from a synthesis view. In our case, besides the scale-free feature, the online social network has small-world property, hierarchical organizations and disassortative mixing pattern. Concerning small-world property of the underlying network, the short average distance promotes the propagation process of cooperators. Furthermore, taking account for the hierarchical organizations [due to ’s dependence on ], i.e., local well-clustered low-degree nodes, such common cluster structure induces the clustering of cooperators, leading to the surviving and enhancement of cooperation [9]. The mixing pattern also influences the cooperation level substantially. It is thought that the cooperation level is optimum in uncorrelated networks (where the assortativity coefficient is zero) [31]. Our sampled network is a disassortative one (assortativity coefficient is ), thus the frequency of cooperators is diminished in a way by such mixing pattern. Finally, as pointed out in Ref. [30], maximum cooperation level occurs at intermediate average degree, in our case, the average connectivity of the sampled network is about . To a certain extent, this quantity of average connectivity affects the evolution of cooperation. Consequently, the evolution of cooperation on the empirical network is simultaneously affected by these additive factors as the underlying network possesses various characteristics of real-world social interactions. Actually, the combined network effects of these factors facilitate and maintain the cooperation among selfish individuals. Our results may shed light on the evolution of cooperation in social and economical systems.

4 Concluding remarks
In conclusion, we have studied two social dilemmas—PDG and SG in an online social network. We demonstrated that the social network has small-world property and is scale-free in degree distribution. In addition, it was shown that the underlying network has hierarchical organizations in which low-degree vertices are well-connected in different communities, while large-degree nodes are linked to many nodes that may belong to different groups. We also found that the social network shows disassortative mixing pattern. Then we investigated the evolution of cooperation on such empirical social network, observing the time evolution of frequency of cooperators for evolutionary PDG and SG respectively. The underlying network structure leads to the enhancement and maintenance of cooperation in unrelated and selfish individuals. Besides, with not too large for PDG and for SG, the networked population evolves into the absorbing state of full cooperators at a probability around half one. Otherwise, most of the runs ended up with massive defectors. Different from games on model networks, understanding the evolution of cooperation on empirical network should be conducted from a synthesis view because real-world relational networks incorporate various characteristics while model networks generally focus on some specified features. Thus, we conclude that the evolution of cooperation on the empirical network is jointly affected by additive network effects, including average connectivity, small-world property, degree heterogeneity (scale-free), degree-degree correlation, hierarchical organizations, etc. Our results may help understand the cooperative behaviors in human societies.
Acknowledgement
Delightful discussions with Wenxu Wang, Jing Wang, Zhuozheng Li, and Zhoujin Ouyang are gratefully acknowledged. This work was supported by NNSFC (60674050 and 60528007), National 973 Program (2002CB312200), National 863 Program (2006AA04Z258) and 11-5 project (A2120061303).
References
- [1] C. Anderson, Long tail: why the future of business is selling less of more, Hyperion, New York, 2006.
- [2] J. Maynard Smith, Evolution and the theory of games, Cambridge University Press, UK, 1982.
- [3] M. A. Nowak, R. M May, Nature 359 (1992) 826.
- [4] P. E. Turner, L. Chao, Nature 398 (1999) 441.
- [5] M. Doebeli, C. Hauert, Ecology Letters 8 (2005) 748.
- [6] F. C. Santos, J. M. Pacheco, Phys. Rev. Lett. 95 (2005) 098104.
- [7] G. Szabo, G. Fath, arXiv:cond-mat/0607344.
- [8] J. Hofbauer, K. Sigmund, Evolutionary games and population dynamics, Cambridge University Press, UK, 1998.
- [9] C. Hauert, M. Doebeli, Nature 428 (2004) 643.
- [10] F. C. Santos, J. M. Pacheco, J. Evol. Biol. 19 (2006) 726.
- [11] F. C. Santos, J. M. Pacheco, Tom Lenaerts, Proc. Natl. Acad. Sci. USA 103 (2006) 3490.
- [12] G. Szabó, C. Tőke, Phys. Rev. E 58 (1998) 69.
- [13] G. Szabó, C. Hauert, Phys. Rev. Lett. 89 (2002) 118101.
- [14] G. Szabó, J. Vukov, A. Szolnoki, Phys. Rev. E 72 (2005) 047107.
- [15] J. Vukov, G. Szabó, A. Szolnoki, Phys. Rev. E 73 (2006) 067103.
- [16] G. Abramson, M. Kuperman, Phys. Rev. E 63 (2001) 030901(R).
- [17] N. Masuda, K. Aihara, Phys. Lett. A 313 (2003) 55.
- [18] M. Tomassini, L. Luthi, M. Giacobini, Phys. Rev. E 73 (2006) 016132.
- [19] X.-J. Chen, F. Fu, L. Wang, Physica A (2007), doi:10.1016/j.physa.2006.12.024.
- [20] E. Pennisi, Science 303 (2005) 303.
- [21] A. M. Colman, Nature 440 (2006) 744.
- [22] M. A. Nowak, Science 314 (2006) 1560.
- [23] R. Albert, A.-L. Barabási, Rev. Mod. Phys. 74 (2002) 47.
- [24] E. Ravasz, A.-L. Barabási, Phys. Rev. E 67 (2003) 026112.
- [25] M. E. J. Newman, Phys. Rev. Lett. 89 (2002) 208701.
- [26] P. Holmea, C. R. Edling, F. Liljeros, Social Networks 26 (2004) 155.
- [27] F. Wang, Y. Moreno, Y.-R. Sun, Phys. Rev. E 73 (2006) 03612.
- [28] M. A. Nowak, S. Bonhoeffer, R. M. May, Int. J. Bifurcation Chaos, 3 (1993) 35.
- [29] ¡ltx:note¿We have confirmed that our results are still qualitatively valid under changing the value of . However, the effect of changing the value of is presented in Ref. [32].¡/ltx:note¿
- [30] C.-L. Tang, W.-X. Wang, X. Wu, B.-H. Wang, Eur. Phys. J. B, 53 (2006) 411.
- [31] Z.-H. Rong, X. Li, X.-F. Wang, Proceedings of Chinese Conference on Complex Networks, Wuhan China (2006) p.80-81.
- [32] J. Ren, W.-X. Wang, F. Qi, arXiv:cond-mat/0607457.