Scanning Near-Field Optical Coherent Spectroscopy of
Single Molecules at 1.4 Kelvin
Ilja Gerhardt, Gert Wrigge, Mario Agio, Pavel Bushev∗, Gert Zumofen, and Vahid Sandoghdar
Laboratory of Physical Chemistry, ETH Zurich, CH-8093 Zurich, Switzerland
Abstract
We present scanning near-field extinction spectra of single molecules embedded in a solid matrix. By varying the molecule-tip separation, we modify the line shape of the spectra, demonstrating the coherent nature of the interaction between the incident laser light and the excited state of the molecule. We compare the measured data with the outcome of numerical calculations and find a very good agreement.
OCIS codes: 270.1670, 180.5810, 290.2200, 300.6250
Scanning Near-field Optical Microscopy (SNOM) was invented about twenty years ago and has been used in a wide range of applications where a subwavelength spatial resolution is advantageous in optical studies[1]. One of the highlights of SNOM was to deliver the first images of single fluorescent molecules at room temperature in 1993[2], initiating the active and fruitful field of single molecule microscopy. Since then various groups have combined SNOM with spectroscopy of single emitters[3, 4, 5, 6] by detecting the inelastic fluorescence that is red-shifted with respect to the excitation light. Developments in both far-field[7, 8, 9] and near-field[10] spectroscopy of single nano-objects have shown, however, that it is possible to study them via the interference between the elastically scattered light and a reference beam. Very recently, we used this approach to demonstrate the first near-field extinction measurement on single molecules and reported a dip in transmission as large as without using any noise suppression method[11]. In this Letter, we present the dependence of the single molecule extinction spectra on the molecule-tip separation and compare our findings with the outcome of numerical simulations.
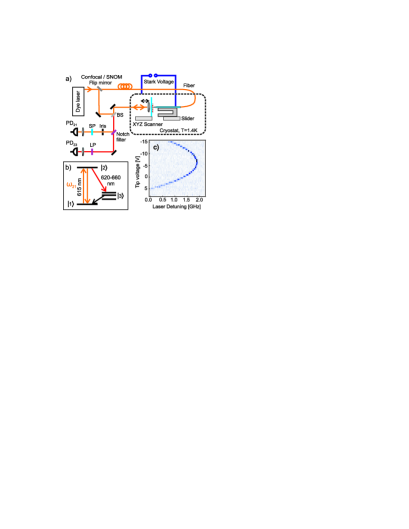
The experimental setup is schematically depicted in Fig. 1 and consists of a combined scanning confocal and near-field optical microscope that operates at T=1.4 K. Details of this setup, the tip, the sample and the theoretical concepts of our work have been described in Ref.11. In a typical experiment, we first detected single molecules via near-field fluorescence excitation spectroscopy[4], i.e. by recording the Stokes shifted emission on transition in Fig. 1b). We monitored the oscillation of a quartz tuning fork and used the shear-force interaction to control the tip-sample distance[12]. In this manner, we could position the tip at a given axial distance from the sample (thickness ) to within 10 nm. Upon lateral scanning of the tip, we found that despite electrical contacting of the tip to the ground, a substantial position dependent Stark shift was consistently present in all experiments. In order to compensate this effect, we first laterally centered the tip on the molecule by maximizing the fluorescence signal on detector . We then varied the voltage on the SNOM tip to the value corresponding to the apex of the voltage-shift parabola, as shown in Fig. 1c. This procedure allowed a near to full cancellation of the Stark shift, indicating that its origin is probably charge build-up on the sample or the oxidized surface of the tip.
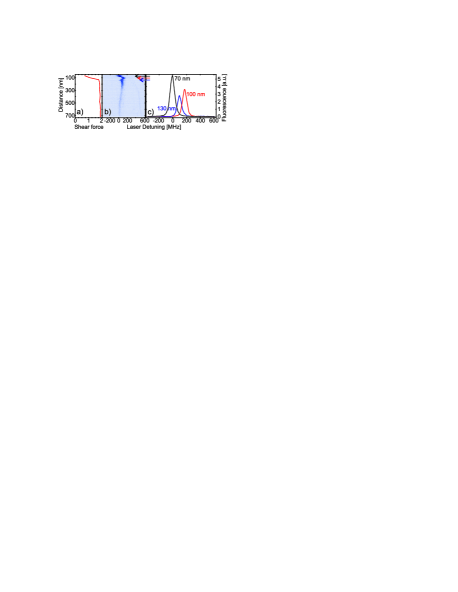
Even in the absence of an external electric potential, the presence of the tip could affect the linewidth and position of the molecular resonance [13] similar to the case of a molecule in front of a mirror. Our three-dimensional finite-difference time-domain (FDTD) calculations show that for a dipolar resonance with linewidth , we should expect a broadening in the range of to (depending on the molecular dipole orientation) for a tip-molecule separation of 30 nm. In our experiment, it turned out that we could not probe these effects because as shown by an example in Figs. 2b and c, we often encountered spectral instabilities for tip-sample separations under about 100 nm. The correspondence between the data in Fig. 2b and the simultaneously recorded shear force signal displayed in Fig. 2a indicates that this effect is due to a mechanical perturbation of the p-terphenyl matrix and that moreover, our shear-force signal is assisted by mechanical contact [14]. Although this phenomenon merits further investigations, in this work we have chosen to avoid it by operating the tip at distances larger than about 60 nm from the sample where the tip influence is negligible.
The signals on the two detectors and have been described in Ref.11 and its Supplementary Material. In short, while records the conventional Stokes shifted fluorescence , the signal on is the result of the interference between the transmitted laser light through the tip and the light that is coherently scattered by the molecule. Thus, a change in the position of the tip with respect to the molecule can lead to a change in the relative accumulated phase and a change in the resonance shape. Figure 3 shows examples of such spectra at three different tip-molecule positions.
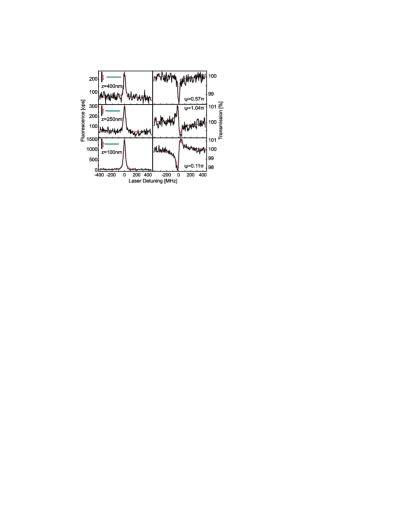
The coherent spectra recorded on can be fitted by if the intensity of the molecular emission is much smaller than the strength of its interference with the laser field, as is the case in our experiment[11, 7]. Here denotes the detuning between and the excitation laser frequency, is the transition linewidth, stands for the relative phase between the excitation and scattered lights, and is a parameter that we call visibility. We remark that in these experiments an iris of diameter 1 mm was used in the path of to select the axial part of the beam.
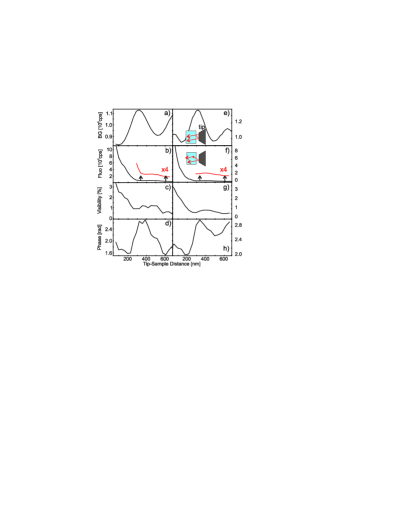
Figures 4a-d summarize the analysis of a series of spectra from different axial tip-molecule separations for a different tip and molecule than in Fig. 3. In order to compare our experimental data with theoretical expectations, we have performed three-dimensional FDTD calculations. The 50 nm-thick matrix was modelled according to the refractive indices of p-terphenyl along its crystal axes, and the molecule was taken to be a dispersive Lorentz material along its dipole moment. The tip was taken to be 700 nm long and buried 50 nm into convolutional perfectly-matched-layer absorbing boundary conditions to avoid finite-size effects[15]. The total electric field of the tip and the molecule was recorded on a reference sphere of radius centered at the molecule position. We verified that this field is transverse to within . The frequency dependent signals obtained were fitted in the same fashion as the experimental data.
Figure 4a plots the excitation intensity determined from the off-resonant tail of each frequency scan recorded on while Fig. 4e shows the corresponding FDTD results. As sketched by the inset in Fig. 4e, the oscillatory behavior of is caused by the interference between the part of the laser light that exits the tip and directly propagates to the detector and a second part that is first reflected from the sample and then from the tip (i.e. twice reflection phase shifts) before traversing the detection path. This oscillatory behavior has been also reported previously in conventional SNOM experiments[16]. The FDTD calculations also clearly reproduce this effect.
Figure 4b displays extracted from Lorentzian fits to the fluorescence excitation spectra (see Fig. 3). A 30-fold increase of the molecular fluorescence upon the decrease of the tip-sample distance from 600 nm to 100 nm provides the expected signature of near-field excitation. Furthermore, a careful scrutiny of also reveals an oscillation as displayed by the zoom in the inset. As indicated by the upper inset in Fig. 4f, this is caused by the interference between the part of the molecular fluorescence that is directed toward the detector and another part that is reflected from the aluminum tip. The location for the first minimum is in fair agreement with a simple ray optics picture that considers a phase shift of at the tip. Again the FDTD calculations in Fig. 4f agree well with the data.
Figures 4c and d show experimentally determined and as a function of the tip-molecule separation. As the molecule gets closer to the tip, it is excited more strongly and the visibility is increased. However, since is proportional to the field of the molecular emission and therefore to the field of the excitation beam at the position of the molecule[11], its growth is slower than the fluorescence signal displayed in Figs. 4b and f. In addition, is inversely proportional to the field of the laser at the detector[11] so that it is affected by the behavior of . Finally, we note that the reflection of the molecular emission from the tip manifests itself also in oscillations of and which correlate with those of and . Figures 4g and h display the results of the FDTD calculations which reproduce all features of the experimental data. We emphasize, however, that despite an excellent semiquantitative agreement with the measurements, predicting the absolute magnitudes of quantities such as phase and visibility require more precise knowledge of the geometry than has been possible in this work.
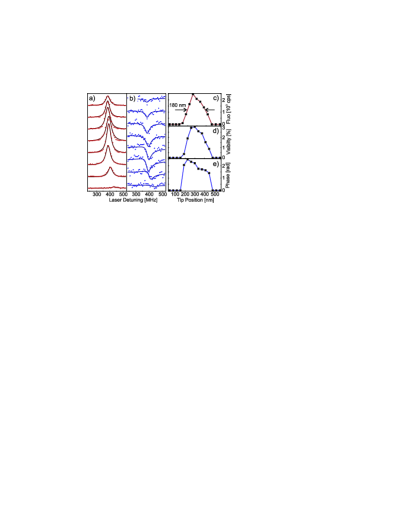
We have also investigated the spectra recorded at different lateral tip-molecule displacements, while keeping the tip at an axial distance of 90 nm from the sample. In Figs. 5a and b examples of spectra on and from one line of a 600600 nm2 lateral scan are presented. The line shape in Fig. 5b is clearly modified within a displacement of a fraction of a wavelength. Furthermore, the data reveal a small residual position-dependent Stark shift. Figures 5c-e plot , and for various lateral displacements.
In summary, we have presented direct near-field optical coherent spectroscopy on single molecules without the need for any noise suppression technique such as lock-in detection. We have investigated the tip position dependence of both inelastic and elastic components of the single molecule emission. Our FDTD calculations show very good agreement with the experimental results and reproduce all their central features.
We thank A. Renn and C. Hettich for fruitful discussions. This work
was financed by the Schweizerische Nationalfond (SNF) and the ETH
Zurich initiative on Quantum Systems and Information Technology
(QSIT). V. Sandoghdar’s email address is vahid.sandoghdar@ethz.ch.
∗ Present address: Abteilung Quanten-Informations-Verarbeitung, Universität Ulm, D-89069 Ulm, Germany.
References
- [1] M. A. Paesler and P. J. Moyer, Near-Field Optics: Theory, Instrumentation, and Applications (Wiley & Sons, 1996).
- [2] E. Betzig and R. J. Chichester, Science 262, 1422 (1993).
- [3] H. F. Hess, E. Betzig, T. D. Harris, L. N. Pfeiffer, and K. W. West, Science 264, 1740 (1994).
- [4] W. E. Moerner,et al, Phys. Rev. Lett. 73, 2764 (1994).
- [5] K. Matsuda, et al, Phys. Rev. Lett. 91, 177401 (2003).
- [6] J. R. Guest, et al, Phys. Rev. B 65, 241310 (2002).
- [7] T. Plakhotnik and V. Palm, Phys. Rev. Lett. 87, 183602 (2001).
- [8] K. Lindfors, T. Kalkbrenner, P. Stoller, and V. Sandoghdar, Phys. Rev. Lett. 93, 037401 (2004).
- [9] A. Högele, et al, Appl. Phys. Lett. 86, 221905 (2005).
- [10] A. A. Mikhailovsky, M. A. Petruska, K. Li, M. I. Stockman, and V. I. Klimov, Phys. Rev. B 69, 085401 (2004).
- [11] I. Gerhardt, et al, Phys. Rev. Lett. 98, 033601 (2007).
- [12] K. Karrai and R. D. Grober, Appl. Phys. Lett. 66, 1842 (1995).
- [13] R. X. Bian, R. C. Dunn, X. S. Xie, and P. T. Leung, Phys. Rev. Lett. 75, 4772 (1995).
- [14] M. J. Gregor, P. G. Blome, J. Schöfer, and R. G. Ulbrich, Appl. Phys. Lett. 68, 307 (1996).
- [15] J. A. Roden, and S. D. Gedney, Microw. Opt. Technol. Lett. 27, 334 (2000).
- [16] B. Hecht, H. Bielefeldt, D. W. Pohl, L. Novotny, and H. Heinzelmann, J. Appl. Phys. 84, 5873 (1998).