Nonlocal effects on the resonant dielectric surface
observed by near-field optical probing in mid-infrared range
Abstract
The local electromagnetic field distribution over the dielectric (SiC) surface illuminated by mid-IR light of frequency close to the lattice resonance was directly mapped with an apertureless scattering near-field optical microscope. Half of the sample surface was covered with a metal layer, in which some small holes were formed. It was found, that due to the eliminating of collective surface polarization effects, the amplitude of the electromagnetic field becomes several times higher over such holes than over infinitely open surface of the same dielectric.
pacs:
07.79.Fc, 68.37.Uv, 71.36.+c, 73.20.Mf, 78.20.Ci, 78.68.+m, 87.64.XxSurface states, containing the mixture of strongly interacting electromagnetic field and lattice oscillations at the solid surface (surface phonon-polariton states, SPP SPP_textbook ) attract the interest as possible base of optoelectronic microdevices OptoMicroDevProposed_Hillenbr , OptoMicroDevProposed_Keilmann , as well as surface plasmon polariton phenomena PlasmMicroDevProposed_Ebbessen . Surface polariton effects can be also utilized for the spectroscopy of molecules adsorbed on the substrate Anderson_APL2003 , if any field enhancement on subwavelength-size surface features takes place, like Raman scattering enhancement SERS1 , SERS2 on rough metal surface due to surface plasmon excitations.
Collective electromagnetic excitations in polar crystals, caused by the resonant displacement of charged atoms in the presence of electromagnetic fields, have been investigated since 1908 Mie_NaCl . Maxwell equations for the radiation must be solved together with the equations of motion for the charged atoms in the lattice. This task has been solved for bulk isotropic media LST_1941 ,Born_book_1954 ,Barron_1961 and for semi-infinite solid (it is well presented in Rup_Engm_1970 ,Mills_Burst_1974 ). The components of the E-field are presented as plane wave term with . For the light frequency at the reststrahlen band (near lattice resonance, between frequencies of purely transversal and purely longitudinal modes in bulk) the solution is known as the SPP mode. For cubic crystals the lateral SPP wavevector can be expressed analytically as
| (1) |
and the field decay in normal direction is described by
| (2) |
where is a frequency-dependent dielectric function, which can be expressed from experimentally observed bulk phonon polariton frequencies and
| (3) |
The consideration presented above assumes the collective nature of the SPP oscillations on the infinite surface. The wave vector conservation law suppresses effective excitation of the SPP by the external radiation in this ideal case. This symmetry rule can be lifted by any discontinuities of the surface electromagnetic properties, in particular by the sharp edge(s) of the metal mask Sievers_APL32_edge_launch formed on the surface. It was hardly possible to prove the validity of description of the SPP excitation near finite-size mask structures by the direct probing of the field distribution in sub-wavelength scale, until SNOM SNOM_first was invented. The point-like tip of SNOM has no translational symmetry, and therefore no symmetry restrictions. The scattering type (s-SNOM s_SNOM_first ) setup is a kind of SNOM in which the light scattered by the tapping AFM firstAFM tip is collected. The s-SNOM allows amplitude and phase Hillenbr_Phase_PRL_2000 mapping of the electromagnetic phenomena in close vicinity of the surface with a spatial resolution at some cases SNOM_1nm as sharp as 1 nm, regardless to the wavelength. The tip scatters some fraction of the SPP field to external space, and the amplitude of scattered wave can be in dipolar approximation described Keilmann_Alpha_eff_2004 by
| (4) |
where is the field at the tip location. The effective polarizability of the tip is a nonlinear function of the tip-sample separation and strongly depends on the local dielectric value of the sample.
In our experiment we investigated the configuration of the surface electromagnetic field excited on the surface of resonant media by the external radiation. We used the SiC crystal sample with c-axis normal to the surface. The laser frequency range (880-936 cm-1) was close to the lattice resonance of SiC (=796 cm-1, =968 cm-1), so that one could expect an effective SPP excitation caused by the laser beam. The sample surface was covered with 120 nm Au film, which is thick enough to be completely opaque for the light wave used. To define small (m) holes in the metal layer, a salt dust mask was used in the evaporation process, so that some ”lakes” of SiC remained open in the Au mask after the salt was washed away. Half of the sample surface was left uncover, so that we are able to compare the light scattering response on gold, on clean SiC surface far from the metal edge, and on SiC surface at small holes in Au layer.
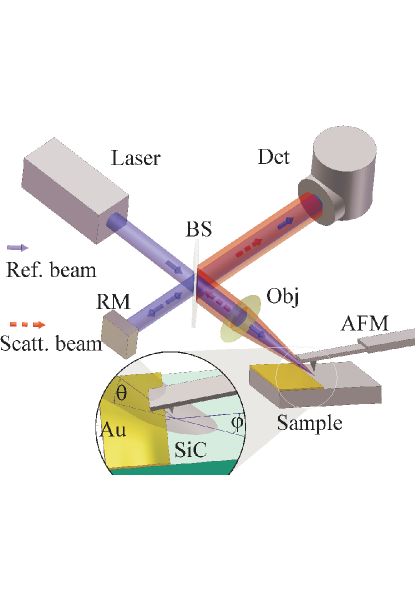
The experimental setup, based on s-SNOM instrument MPI_SNOM , is shown in Fig. 1. The beam of the tunable laser is focused onto the sample, so that the Pt-coated Si tip of tapping-mode AFM is in the center of focal spot. The shape of the focal spot could be described by soft (Gaussian) function of some hundreds micrometers width, and the phase fronts of the illumination light were proven to be flat across whole spot. That means, that the sample illumination could be well described by the plane wave with field amplitude . Thus, the direction of the exciting light is well defined in our experiment by azimuthal angle and incidence angle to the sample surface. The light scattered by the tip is collected back to the Michelson interferometer, and the variations of the detector signal are demodulated at higher harmonic components of the tip tapping frequency , utilizing the nonlinearity of dependency on . The averaging of demodulated signal over reference beam phase MPI_Interfr_Detect gives us full knowledge concerning amplitude and phase of scattered radiation variations.
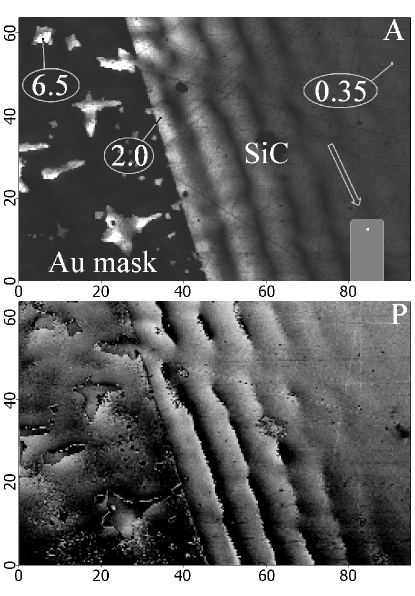
The near field scattering component amplitude/phase map is shown in Fig. 2. The spatial resolution is as sharp as at least 200 nm (judging by 10%-90% step) in topography, and also 180-200 nm in the optical response. That shows not only high lateral resolution of the instrument used, but also the sharpness of the mask features on the sample.
We have shown in our previous work APL_2005 that, in our particular case (media, tip, tapping amplitude and light frequency), the signal detected in the experiment is in fact proportional to the E-field above the surface and represents therefore the local polarization of the surface being mapped:
| (5) |
Here complex factor replaced , is a local property of surface point, determined by the tip motion, scattering z-dependency nonlinearity and the photocurrent demodulation at the 2nd harmonic component of the tip tapping frequency .
We have shown also that the local field , in turn, could be expressed as sum of incident radiation field and some term proportional to the amplitude of [running] SPP wave(s), which was launched somewhere far from the tip location:
| (6) |
where is a constant to convert polarization below the surface to the field above the surface by continuity conditions. Strictly speaking, Eqs. (1- 3) for anisotropic SiC are a bit more complicated than for cubic crystals (and we have taken that into account), but the difference in , is just a few percent Eps_SiC_Landolt_B , Eps_SiC_PRB_1997 for SiC. Therefore, even if one neglects the anisotropy completely, it results in no more than 1-2% error in our case.
As one can see on the map (Fig.2), the E-field amplitude above SiC surface within small openings in the metal mask is several times (we observed up to 20 times for some frequencies) higher than amplitude over open surface of the SiC far from the metal edge. That means the amplitude of local E-field at any surface point does not depend only on local amplitude/phase of incident light and on local sample dielectric constant at given light frequency. It indicates clearly, that also the presence of the resonant media far beyond the tip-sample near-field interaction region (of dimensions known to be about tip radius) plays significant role, so that excluding most of the surface around (with the opaque metal mask) leads to the dramatic increase of the local response at the point being investigated. In other words, all surface points of SiC lattice, driven by the external electromagnetic radiation, deliver their response to the point of observation as SPP wave. For the infinite open surface, the role of that polarization of neighbors is (in average) destructive in formation of the local field.
We can demonstrate our explanation by the model calculations utilizing Green’s function integration. We have shown Kaza_JETPL_2006 , that under the following conditions observed in our experiment: (a) the SPP wave on semi-infinite surface is well described by the decayed sinewave (b) the sinusoidal field distribution, produced by the straight edge of the metal mask, starts as sharp as within 150-200 nm from the edge (c) there is no significant reflections of SPP wave from the mask edges (the conditions in fact take place), the quantitative description of the SPP field can be dramatically simplified. Namely, can be obtained in complex values by 2-dimensional integration of Green’s function (see e.g. Zayats_GF_PR2005 )
| (7) |
where represents the external light over the surface point with its direction described by and , complex value expressed from the field components continuity conditions represent the field component above the point for the SPP wave created at the point . Once launched at the point , the SPP wave representing interaction of the point with all other surface points, automatically fulfils the wave equations if Green’s function is an eigenfunction of the equations mentioned. The less is the ”skin-layer depth” (light penetration depth defined by (2)), the better is agreement between experimentally observed data and simulation results in such a simplified model. For the description of exited polarization delivery from one point of the surface to another, cylindric functions Hankel_Code_Book , expressed in central coordinates, are more convenient than plane waves. Nevertheless, both kinds of functions are proven to be solutions of the wave equation under the same conditions and assumptions.
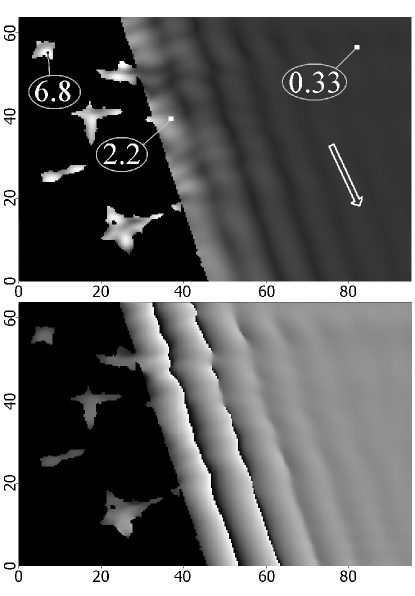
The results of numerical calculations are shown in Fig. 3. The shapes of the areas to be used for integration were taken from bitmaps of real surface images. The SPP wave pattern in every mask opening was calculated separately. Despite the simplicity of the model used, the calculations still show the following: (a) the amplitude over the mask edge and over the SiC at any small hole in the mask is higher than over the infinitely open surface, (b) the amplitude variations near the edge are stronger if the illumination light comes from the metal mask side and weaker for the opposite orientation of the sample, and also (c) even the configuration of the standing wave in a small hole has qualitative agreement with the observed scattering amplitude map for different directions of the light.
Comparing present results with the results of previous investigations of the similar samples, we can state the following. The modification of the tip polarizability due to the interaction with its dipole image in the surface is defined mainly by the surface region corresponding to the tip radius and tip-sample distance. The dramatic increase of the tip scattered near-field signal was mentioned Hilenbr_materContr_Nat_02 by comparison of the scattered field amplitude while scanning over SiC surface at the frequency close to SiC lattice resonance and the amplitude over non-resonant surface of the metal mask. The mapping of the sample dielectric function (which defines variations in , the tip effective polarizability) was also performed Ocelic_CheckrBrd_Nat_Mat_04 to observe a material contrast between two kinds of dielectric. In the current research, instead, the dielectric function was assumed to be constant for whole SiC surface being mapped, so that the sSNOM tip was considered as just a tool (of constant sensitivity factor) to scatter the surface field. Thus, the scattering amplitude was compared not for the metal and dielectric surface, but rather for the different areas of the same dielectric (SiC) media.
Thus, we can conclude that, in the presence of efficient lateral transfer of lattice polarization by SPP waves, the electromagnetic response of resonant dielectric surface can not be described just by the tailoring of local fields beneath and above the surface. Instead, it must be considered as collective effect, with integration over all surface points around. In the terms of Green’s-function formalism, explanation looks as: only those neighbors contribute to the local surface polarization by constructive way, which have no retardation. On the large open surface the destructive contribution of the relatively far neighbors is stronger because their amount is more, being proportional to the distance from them . Thus, excluding such far neighbors by covering the surface with a metal mask containing just small openings, leads to significant enhancement of the local amplitude.
Author thanks Dr. R.Hillenbrand and Dr. F.Keilmann for their everyday’s encouragement in the works reported and their very constructive criticism. The author is indebted to use DSP demodulation circuit programmed by N.Ocelic. The mechanical parts of the sSNOM head work always perfectly due to the professional skill of R.Gatz who fabricated it.
References
- (1) G. Borstel and H. J. Falge, in Electromagnetic Surface Modes, ed. by A. D. Boardman (Wiley, Chichester, 1982), 219.
- (2) R. Hillenbrand, Ultramicroscopy 100, 421 (2004).
- (3) T. Taubner, F. Keilmann, and R. Hillenbrand, Nano Lett. 4, 1669 (2004).
- (4) W. L. Barnes, A. Dereux, and T. W. Ebbesen, Nature (London), 424, 824 (2003).
- (5) M. S. Anderson, Appl. Phys. Lett. 83, 2964 (2003)
- (6) Nie S. M., Emery S. R. Science 275, 1102 (1997).
- (7) Kneipp, K. et al. Phys. Rev. Lett. 78, 1667(1997).
- (8) G. Mie, Ann. Phys. (Leipzig) 25, 377 (1908).
- (9) R.H.Lyddane, R.G.Sachs, E.Teller. Phys. Rev., 59, 673 (1941).
- (10) M.Born, K.Huang, Dynamical Theory of Crystal Lattices (Oxford University Press, New York, 1954), Sec. 7
- (11) T.H.K.Barron. Phys.Rev. 123, 1995 (1961).
- (12) R.Ruppin, R.Engman. Rep. Prog. Phys. 33, 149 (1970).
- (13) D.L.Mills, E.Burstein. Rep. Prog. Phys. 37, 817 (1974).
- (14) Y.J.Chabal, A.J.Sievers, Appl.Phys.Lett. 32, 90 (1978).
- (15) M.H.P. Moers et.al., J. Appl. Phys. 75, 1254 (1994).
- (16) F.Zenhausern, M.P.O′Boyle, and H.K. Wickramasinghe, Appl. Phys. Lett., 65(13), 1623 (1994).
- (17) G.Binnig, C.F.Quate, C.Gerber. Phys.Rev.Lett. 56, 930 (1986).
- (18) R.Hillenbrand, F.Keilmann, Phys.Rev.Lett., 85, 3029 (2000).
- (19) F. Zehnhausern, Y.Martin, K.Wickramasinghe. Science 269, 1083, (1995).
- (20) F. Keilmann and R. Hillenbrand. Phil. Trans. R. Soc. London A 362 787 (2004).
- (21) T.Taubner, R.Hillenbrand, F.Keilmann. J. of Microscopy, 210, 311 (2003).
- (22) N. Ocelic, A. Huber, R. Hillenbrand. Appl. Phys. Lett. 89 101124 (2006).
- (23) A. Huber et.al. Appl. Phys. Lett. 87 081103 (2005).
- (24) Physics of Group IV Elements and III-V Compounds, edited by K.-H. Hellwege and O. Madelung, Landolt-Börnstein, New Series, Group III, Vol.17, Pt. a, Springer, Berlin, 1982.
- (25) B. Adolph et.al. Phys.Rev.B, 55, 1422 (1997).
- (26) D. V. Kazantsev, JETP Letters, 83, 323 (2006).
- (27) A.V. Zayats, I.I. Smolyaninov, A.A. Maradudin. Physics Reports 408 131 (2005).
- (28) We used the code of Hankel function from: Numerical recipes in C: the art of scientific computing (ISBN 0-521-43108-5) 1988-1992 by Cambridge University Press.
- (29) R. Hillenbrand, T. Taubner, F. Keilmann. Nature, 418, 159 (2002).
- (30) N.Ocelic, R.Hillenbrand. Nature Materials 3, 606 (2004).