Complex motion of precipitation bands
Abstract
Formation and dynamics of an Al(OH)3 precipitation ring is studied by diffusing NaOH into a gel containing AlCl3. Limited feeding of the outer electrolyte (NaOH) is found to yield an intricate ring-dynamics which involves stopping and reversal of the direction of motion of the precipitation ring, and evolution into stationary multi-ring structures. A model of the ring-dynamics is developed by combining a phase separation scenario for the precipitation with the redissolution (complex formation) of the precipitate in the excess of the outer electrolyte.
pacs:
82.20.-w,02.50.-r, 82.40.CkI Introduction
Precipitation patterns formed in the wake of moving reaction fronts have been studied for a long time lie . Recent interest in these structures stems from possible relevance to engineering mesoscopic and microscopic patterns Giraldo2000 ; Lebedeva2004a ; Lebedeva2004b ; Fialkowski2005 ; Grzybowski2005 . In contrast to removing material to construct a structure (top-down processing), controlled precipitation is suggested as means to generate a prescribed bulk design (bottom-up processing). In order to understand how to guide and locate precipitation regions, it is instrumental to investigate cases where, in addition to precipitation in the reaction zone, redissolution in the wake of the moving front also takes place Zrinyi91 ; Das89 ; Das91 ; Sultan96 ; Das97 ; Sultan02 ; Lagzi03 ; Volford06 ; George2005 . The resulting virtual motion of a precipitation pulse (or more complicated pattern) is easily visualized and its dynamics can be studied in detail.
In a usual setup for observing moving precipitation pulses, the inner electrolyte is distributed homogeneously in a gel column and the outer electrolyte diffuses into this medium (typical examples of inner/outer electrolyte pairs are Hg2+/I-, Co2+/NH4OH, Cr3+/OH-). The precipitate (HgI2, Co(OH)2, Cr(OH)3) forms in the reaction zone which moves diffusively along the column. In the wake of this front, the excess of the outer electrolyte consumes the precipitate and forms a complex ([HgI, [Co(NH, [Cr(OH)). In cases when the gel, the reagents, and the complex are transparent, while the precipitate is not, the position of the precipitation pulse (band) is easily monitored.
Our aim here is to study the dynamics of precipitation pulses in radially symmetric, two-dimensional setup with limited feeding of the outer electrolyte. From experimental side, we present a quantitative description of the radial motion of precipitation pulses with emphasis on the stopping of the band and on the reversal of the radial motion with the ensuing multiplication of the precipitation bands. From theoretical side, we generalize the so called phase separation theory of Liesegang phenomena ModelB , and show that the novel aspects of the experiments (reversal of front motion and the multiplication of bands) can be described well but problems arise when such detail as the time-evolution of the width of the precipitation band is considered.
II Experiments
The evolution of the precipitation pulse is observed in the following reaction scheme Volford06 :
Agarose (Reanal) was dissolved in distilled water to produce 1% solution. It was continuously stirred and heated up to 90 oC. The clear solution was mixed with the given amount of AlCl3*6H20 (Reanal), and this solution was poured into a Petri dish to obtain a uniformly thick gel (3.2 mm). After polymerization, a circular hole of radius is cut out at the center of the gel, and the outer electrolyte of fixed concentration (M) was placed into this reservoir. No feeding of the outer electrolyte (usual boundary conditions in many experiments and simulations) was allowed. The parameters varied in the experiments were the concentration of the inner electrolyte () and the radius of the reservoir (). When changing , the volume of the outer electrolyte was changed proportionally to .
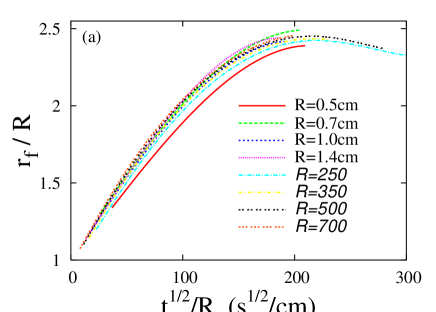
Shortly after the outer electrolyte is placed into the reservoir, a white precipitate can be observed at the gel-reservoir interface. Next, the thin precipitation ring detaches from the interface (due to redissolution of the precipitate in the wake of the outward moving reaction front). The precipitation band is well visible because both the aluminum chloride and its hydroxo complex are colorless in contrast to the white precipitate, Al(OH)3. At early stages, the increase of radius of the pulse is proportional to the square root of time , indicating that the front motion is driven by diffusion of the invading electrolyte. Then the front motion slows down (faster than in case of continuous feeding) and, finally, the front stops (Figure 1a). The total increase in the radius depends on the concentrations of the inner- and outer electrolytes, and on radius of the reservoir. The value of can be easily estimated from the mass conservation law.
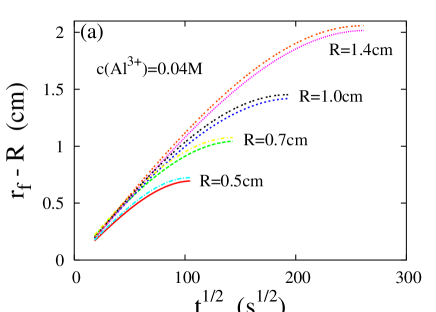
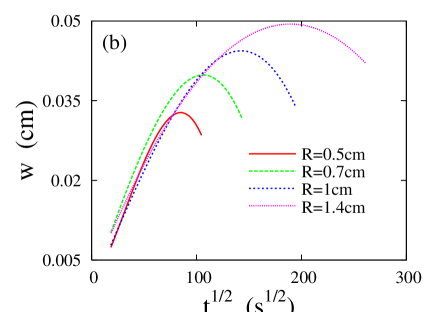
The width of the pulse shows a more complicated behavior (Figure 1b). It increases up to a maximum value and, as the front significantly slows, it starts to decrease. In this regime, the precipitation stops at the outer edge of the pattern, the reason being that the limited feeding cannot maintain the necessary concentration for the formation of the precipitate. Nevertheless, even the limited feeding is sufficient for the complex formation in the wake of the front, and decreases.
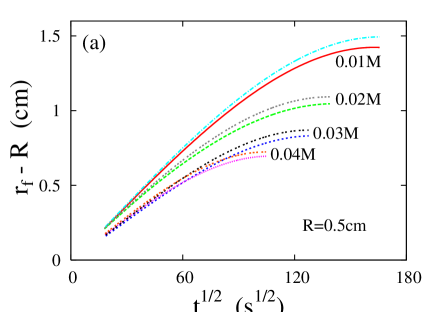
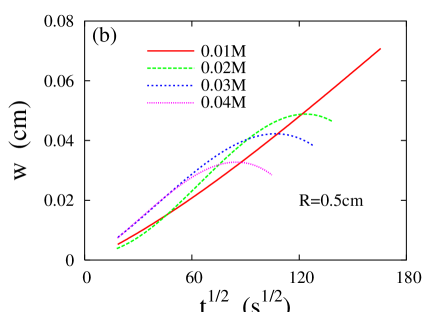
Similar sequence of events can be observed at fixed (fixed amount of the outer electrolyte) when varying the concentration of the inner electrolyte (Figure 2). The effect of concentration of the electrolytes on front velocity has been studied in previously Zrinyi91 ; Sultan02 , and it was found that the velocity of pattern formation is higher at lower concentration of the inner electrolyte. Here we find that lowering of concentration of the inner electrolyte mainly affects the temporal evolution of the width. Namely, for very low concentrations, behavior can be seen all the way to the time when the pulse stops. We do not have an explanation for this. The observation that the concentration of the precipitate visibly decreases at the outer edge of the front, however, suggests that a colloidal re-transformation of the precipitation ring compensates the complex formation which would otherwise decrease the width.

An interesting phenomenon can be observed after the precipitation pulse stops. As shown in Fig.3, a new well-separated ring emerges inside the stationary pulse. It appears that the precipitation front reverses its motion. Supporting the picture of the reversal of the front is that a third ring with even smaller radius forms after a while and, furthermore, the outer rings do not get dissolved. This means that the outer electrolyte is confined to regions with radius smaller than that of the stationary rings. It should be noted that reversal of reaction front motion (actually several switches in the direction of the motion) have been seen and discussed previously Taitelbaum1 ; Taitelbaum2 ; Taitelbaum3 . The emphasis of our work is on the motion of the precipitation pulse which is related to the dynamics of the reaction front but it is more complex due to the phase separation and redissolution effects.
III The model and the simulation results
In order to model the phenomena described in Sec.II, let us first note that the reactions take place in a gel. Thus, no convection is present, and the primary dynamics is a slow reaction-diffusion process. Denoting the reagents of the outer- and inner-electrolytes by OH- and Al3+, respectively, the first stage of the process, , yields a reaction product Al(OH)3. The next step is the formation of precipitate which will be modeled as phase separation of into low- and high-concentration regions of as described by the Cahn-Hilliard equation. A similar strategy has been successfully employed in the theory of Liesegang phenomena ModelB ; Kinis where the above two steps constitute the whole pattern formation process. The new element here is that the outer electrolyte forms a complex with the precipitate ( [Al(OH)). The complex formation is responsible for the redissolution of and, consequently, for the moving precipitation band. For simplicity, we shall assume that, once the complex is formed, it ceases to play any active role in the reactions. This assumption appears to be justified in the given experiment.
Denoting the concentrations of , , and by , , and , respectively, the above understanding (model) is described by the following equations
| (1) | |||||
Here , are the diffusion coefficient of and , respectively, and are the reaction rate constants, is the kinetic coefficient giving the timescale of the phase separation process. The phase separation is governed by a free energy functional with two minima in homogeneous states corresponding to the equilibrium high- () and low- () concentrations of (which are assumed to be the band- and interband-concentrations of ). The usual form of this functional is the Landau-Ginzburg free energy with a functional derivative of the following form
| (2) |
where , , and are phenomenological parameters chosen so that the minima of are at and , while governs the scale for the width of the interface between the regions of and . The values of these parameters are not known (note that since the values of and , and the width of the interface regions are not measured, the values of , , and are not fixed in the given experiment).
According to the experiments, the outer- (inner-) electrolytes of concentrations () are initially homogeneously distributed inside (outside) of a circle of radius . Thus, denoting the radial coordinate by , the initial conditions to equations (1-3) are as follows
| (3) | |||||
where is the step function. The radial symmetry is not broken during the evolution of the precipitation pattern and, consequently, we can limit the solution of equations (1-3) to radially symmetric concentration fields , , and . The reduction to a one-dimensional problem greatly simplifies the numerical solution of the equations and even a simple Euler scheme is sufficiently fast and stable to obtain the time evolution of the system.
The difficulty lies in the number of phenomenological parameters. Setting the concentration scale and the length-scale by and , respectively, using a timescale which yields , and making a further simplification by assuming , one still has five parameters (, , , , ). The values of these parameters are not known and they can change by several orders of magnitudes in various systems. Thus, one faces the problem of searching for agreement with the experiment in a five-dimensional parameter space. This is a highly nontrivial problem, and we began by restricting our search to qualitative solutions explaining the most interesting part of the experiment, namely the reversal of the motion of front and the generation of stationary bands in the wake of it.
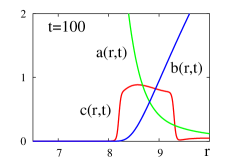
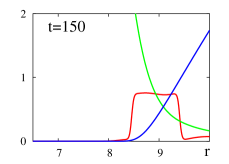
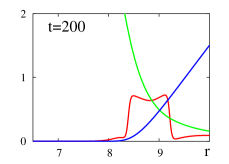
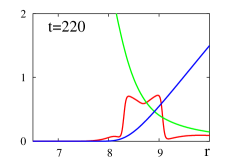
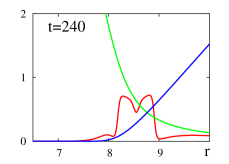
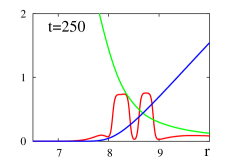
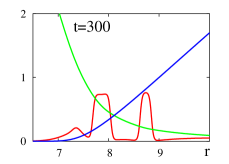
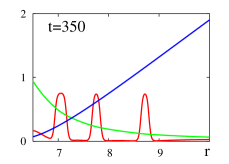
Fig.4 shows the details of dynamics of the reversal and the formation of multiple bands. As the outer electrolyte is depleted, the reaction front stops and, as a result, the outer edge of the precipitate ceases moving (). Then, due to dissolution, the outer edge starts to move backward () and the band becomes narrower. As the reaction front reverses its motion, the precipitation takes place behind the outer edge (). During this stage, a complicated interplay of reaction-precipitation-dissolution yields a double peak band structure. As the reaction front moves in further, the inner edge of the band starts to move in as well (). Now, the concentration of is still large enough behind the front to dissolve part of the band, and a band-splitting takes place (). As the front moves in further, the inner band follows it and the -s are so much depleted in the wake of the front that they are not able to dissolve the outer band (). From this point on, the process is similar to usual Liesegang band formation ModelB : the reaction product of the moving front phase separates in the wake of the front, and the bands formed in this way are stable since the dissolution is negligible due to the depletion of the -s (). The band formation stops once the concentration of the reaction product in the front decreases below a threshold set by the Cahn-Hilliard equation.
| (mm) | 5 | 7 | 10 | 14 |
|---|---|---|---|---|
Once qualitative agreement is found, a quantitative comparison with the experiments may also be attempted. E.g. the time-evolution of the radius and width of the pulse can be calculated and measured in detail. We did this in a regime where the concentrations of and are chosen such that the front just driven out, then stops, and no reverse motion takes place. Fig.5a shows a set of experimental and theoretical results for time evolution of the front position, scaled by the radius of the initial interface (). The scaling by is suggested by calculating the final position of the front [] by finding the radius of area where the -s are in sufficient number to consume all the -s. This calculation suggests that is constant, independent of R. As can be seen from Table 1, the relationship is indeed satisfied.
On Fig.5a, the radius of the pulse is plotted against and good collapse is found for both experimental and theoretical curves for various -s. This shows that although the front motion is not simply diffusive, the front dynamics has the scale-invariance of diffusive processes, and the theoretical model captures this aspect correctly. Note that the agreement between the experiment and theory is also excellent. The collapse is achieved for the experimental ratio of initial concentrations () by finding an appropriate set of reaction rates and Landau coefficients, and using a scale factor to relate the experimental and theoretical timescales (see caption to Fig.5).
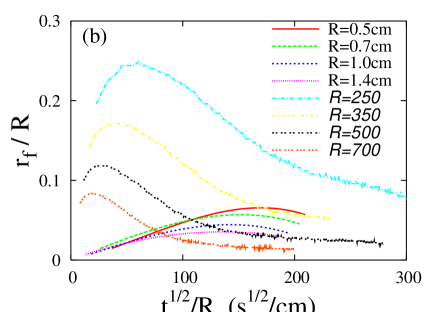
Problems arise in the quantitative description of the width of the precipitation zone. As can be seen on Fig.5b, the agreement between theory and experiment is at most qualitative. While both widths grow initially and then show a decreasing trend, there are important differences. The theoretical widths are significantly larger and, furthermore, they reach their maxima well before the band stops [, see Fig.5a]. This is in contrast to the experimental widths which increase almost to the end of the band motion. The narrower experimental widths may be explained by the uncertainties of what is measured in the experiment as compared to the theory. The shift of the maxima, however, is harder to explain. The underlying reason may be the simplicity of the Landau free energy where the and set a constant concentration of in the band. Visual observations, however, indicate that the structure of the band and thus the concentration in them is changing during the evolution. Consequently, and , and perhaps and as well, are functions of the local concentration of .
The -dependence of the free energy is an interesting problem and
the solution may also be relevant for building a more powerful
theory of Liesegang phenomena Liese-width1 ; Liese-width2 .
Indeed, the explanation of the so called width-law of Liesegang
phenomena is based on phase-separation scenario with an underlying
free energy. A consequence of this theory is the constancy of the
precipitate concentration in the bands which is not always seen in
experiments Zrinyi . A natural explanation is again in the
generalization of the free energy. At this point, however, one would
need more experimental input to build a more complicated model. This
is outside the scope of this letter.
IV Final remarks
We have investigated a precipitation process where limited feeding of the invading electrolyte, precipitation, and a complex-formation process combine to yield a precipitation pulse with nontrivial motion and with the possibility of evolution into a multi-band structure. An explanation for the various phenomena can be found through the reaction front dynamics governed by the direction of the higher transport flux of electrolytes. In contrast to classical setups where the high initial concentration of the outer electrolyte ensures its dominant flux into inner electrolyte, the limited feeding of the external electrolyte produces a reaction-front reversal. As a consequence, a Liesegang type band-formation is developed in direction of the source of the external electrolyte. Presumably, this type of reaction-front reversals underlie the explanation of several seemingly revert Liesegang structures in chemistry and geoscience. The experimental results have been described using a phase separation scenario for the precipitation formation and adding the process of redissolution through complex formation. The model captures all important features and, we believe, it may be the basis for understanding rather complex Liesegang type precipitation patterns.
V Acknowledgments
This research has been supported by the Hungarian Academy of Sciences (OTKA T043734 and D048673) and Öveges Research Fellowship of the National Office for Research and Technology.
References
- (1) R.E. Liesegang, Naturwiss. Wochenschr. 11 (1896) 353.
- (2) O. Giraldo, Nature 405 (2000) 38.
- (3) M.I. Lebedeva, D.G. Vlachos, M. Tsapatsis, Phys. Rev. Lett. 92 (2004) 088301.
- (4) M.I. Lebedeva, D.G. Vlachos, M. Tsapatsis, Ind. Eng. Chem. Res. 43 (2004) 3073.
- (5) M. Fialkowski, A. Bitner, B.A. Grzybowski, Phys. Rev. Lett. 94 (2005) 018303.
- (6) B.A. Grzybowski, K.J.M. Bishop, C.J. Campbell, M. Fialkowski, S.K. Smoukov, Soft Matter 1 (2005) 114.
- (7) M. Zrínyi, L. Gálfi, É Smidróczki, Z. Rácz, F. Horkay, J. Phys. Chem. 95 (1991) 1618.
- (8) I. Das, A. Pushkarna, N.R. Agrawal, J. Phys. Chem. 93 (1989) 7269.
- (9) I. Das, A. Pushkarna, A. Bhattacharjee, J. Phys. Chem. 95 (1991) 3866.
- (10) R. Sultan, S. Sadek, J. Phys. Chem. 100 (1996) 16912.
- (11) I. Das, P. Singh, N.R. Agrawal, R.P. Rastogi, J. Colloid Interf. Sci. 192 (1997) 420.
- (12) R.F. Sultan, Phys. Chem. Chem. Phys. 4 (2002) 1253.
- (13) I. Lagzi, J. Phys. Chem. B 107 (2003) 13750.
- (14) A. Volford, F. Izsák, M. Ripszám, I. Lagzi, J. Phys. Chem. B 110 (2006) 4535.
- (15) J. George, G. Varghese, J. Mat. Sci. 40 (2005) 5557.
- (16) H. Taitelbaum, Y-E.L. Koo, S. Havlin, R. Kopelman, G.H. Weiss, Phys. Rev. A 46 (1992) 2151.
- (17) Z. Koza and H. Taitelbaum, Phys. Rev. E 54 (1996) R1040.
- (18) H. Taitelbaum and Z. Koza, Phil. Mag. 77 (1998) 1389.
- (19) T. Antal, M. Droz, J. Magnin, Z. Rácz, Phys. Rev. Lett. 83 (1999) 2880.
- (20) T. Antal, M. Droz, J. Magnin, A. Pekalski, Z. Rácz, J. Chem. Phys. 114 (2001) 3770.
- (21) M. Droz, J. Magnin, M. Zrínyi, J. Chem. Phys. 110 (1999) 9618.
- (22) Z. Rácz, Physica A 274 (1999) 50.
- (23) M. Zrínyi, unpublished.