Surface-wave interferometry on single subwavelength slit-groove structures fabricated on gold films
Abstract
We apply the technique of far-field interferometry to measure the properties of surface waves generated by two-dimensional (2D) single subwavelength slit-groove structures on gold films. The effective surface index of refraction measured for the surface wave propagating over a distance of more than 12 m is determined to be , to within experimental uncertainty close to the expected bound surface plasmon-polariton (SPP) value for a Au/Air interface of . We compare these measurements to finite-difference-time-domain (FDTD) numerical simulations of the optical field transmission through these devices. We find excellent agreement between the measurements and the simulations for . The measurements also show that the surface wave propagation parameter exhibits transient behavior close to the slit, evolving smoothly from greater values asymptotically toward over the first 2-3 m of slit-groove distance . This behavior is confirmed by the FDTD simulations.
pacs:
42.25.Fx. 73.20.Mf. 78.67.-nI Introduction
Recent measurements GAV06b ; GAV06a have characterized surface waves arising from optical excitation of a series of subwavelength slit-groove structures fabricated on silver films. The amplitude, wavelength and phase of these surface waves have been measured over a slit-groove distance of a few microns. After an initial rapid amplitude decrease extending to m from the slit edge, the interference fringe persists over several microns with a near-constant amplitude and a contrast . The “near-zone” of rapidly changing surface wave character indicates initial transient phenomena, while the longer-range “far-zone” settling to constant amplitude and contrast is the signature of a guided mode surface plasmon polariton (SPP). The measured interference fringe wavelength nm resulted in the determination of an effective index of refraction , significantly higher than expected from conventional theory Raether , . The question naturally arose as to whether this result is simply a consequence of interference fringe sampling over an interval predominantly in a transient near-zone peculiar to silver films, or was related to the specific surface properties of the silver films deposited on fused silica LH06 , or may indicate a more generic phenomenon related to the transient properties of surface waves, generated by subwavelength slits, within 2-3 wavelengths of the edge of origin. Subsequent investigation of the physical-chemical properties of the silver films confirmed that they were free of surface contaminants, and FDTD simulations showed excellent agreement with the experimental results in silver films GAW06 ; GAW06a .
In order to explore these surface waves further we have carried out a series of experiments similar to those already reported but using evaporated gold films instead of silver. We performed only “output-side” experiments GAV06b because they yield a phase modulated interference fringe less susceptible to noise than the amplitude modulation signal of the “input-side” experiments GAV06a . In addition we have compared the measurements to detailed field amplitude and phase maps generated by FDTD numerical solutions XZM04 ; XZM05 to the Maxwell equations in the vicinity of the slit-groove structure. Both experiments and FDTD simulation show that the surface wave exhibits transient properties in wavelength and amplitude in the near-zone. This transient behavior can be interpreted in terms of surface modes all of which dissipate beyond the near-zone except for , the bound surface mode.
II Experimental Setup
The structures were fabricated with a focused ion beam (FIB) station as described previously in GAV06a . The experiments were performed on the same home-built goniometer setup used in the silver studies. For convenience, Figs. 1,2 of GAV06b are reproduced here to show the principle of the measurement and the schematic arrangement of the apparatus.
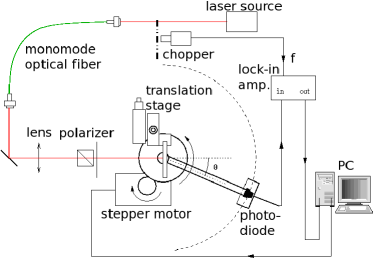
Output from a temperature stabilized diode laser source, is modulated at 850 Hz by a mechanical chopper, injected into a monomode optical fibre, focused and linearly polarized (TM polarization, H-field parallel to the slit long axis) before impinging perpendicularly on the matrix of structures mounted in a sample holder. The beam waist diameter and confocal parameter of the illuminating source are 300 m and 33 cm, respectively. The sample holder itself is fixed to a precision x-y translator, and individual slit-groove structures of the 2-D matrix are successively positioned at the laser beam waist. A photodiode detector is mounted at the end of a 200 mm rigid arm that rotates about the center of the sample holder. A stepper motor drives the arm at calibrated angular increments of 1.95 mrad per step, and the overall angular resolution of the goniometer is mrad. The photodetector output current passes to a lock-in amplifier referenced to the optical chopper wheel. Data are collected on a personal computer that also controls the goniometer drive.
III Results and Analysis
III.1 Measurements
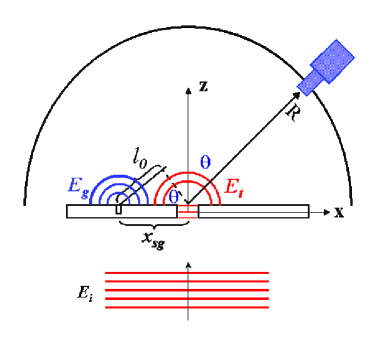
With the detector rotated perpendicular to the structure plane ( in Figs. 2, 2) the expression for the normalized detected intensity as a function of slit-groove distance is given by
| (1) |
where is related to the fringe contrast through
| (2) |
In the argument of the cosine term relates the propagation parameter of the surface wave to the effective surface wavelength, and the “intrinsic phase” is any phase contribution not directly due to the propagation path length . It may be associated with phase shifts at the slit or groove structures. The interferometry measurements were carried out on 4 separate substrates, each substrate containing about 50 structures in which the the slit-groove separation was systematically varied from 50 nm to more than 12 m in increments of 50 nm.
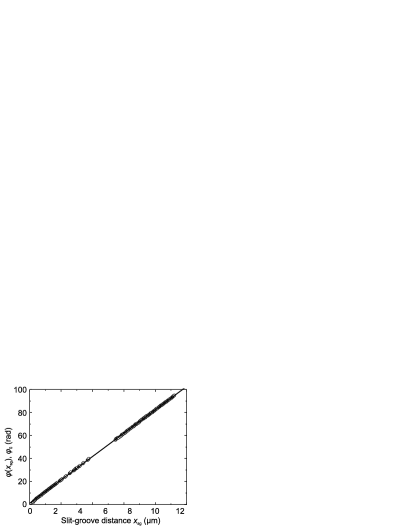
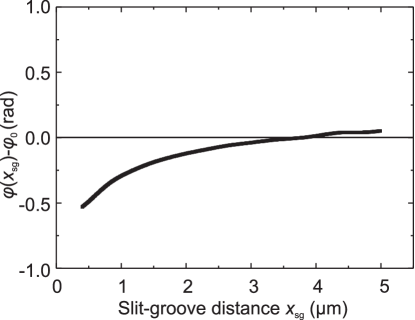
The left panel of Fig. 3 plots the measured interference fringe phase against the slit-groove distance . The fitted value for determines the effective surface index of refraction , and extrapolation to zero slit-groove distance determines the intrinsic phase . The fit from the left panel of Fig. 3 yields
| (3) |
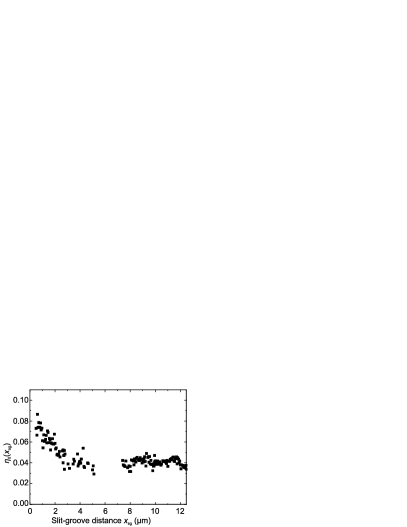
The right panel of Fig. 3 plots , the amplitude factor of the interference term in Eq. 1, as a function of slit-groove distance. From Eq. 2 this amplitude factor can be expressed in terms of the fringe visibility or contrast as
| (4) |

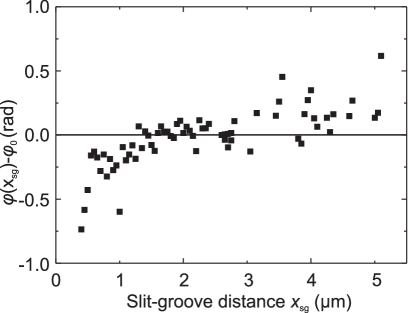
Although the fringe contrast shown in the right panel of Fig. 3 is about a factor of 5 below that measured for silver structures GAV06b , the same rapid fall-off in the near-zone, m, followed by a near-constant contrast beyond is observed. This contrast behavior is evidence of surface-wave transient phenomena in the near-zone. More evidence of this transient behavior is shown in left and right panels of Fig. 4 that plot vs. , where is the best-fit linear trace in the left panel of Fig. 3 over the range of slit-groove distances out to 12 m. A pronounced departure from the asymptotic value of is evident in the near-zone of slit groove distances, indicating that the fringe oscillation frequency is initially somewhat greater than the SPP value and smoothly decreases to it beyond the near-zone.
III.2 Numerical simulations
The time-dependent Maxwell equations are solved numerically using an FDTD non-conformal grid refinement method in Cartesian space coordinates. The methodology is described in greater detail in Refs ZMM04 ; XZM04 ; XZM05 .
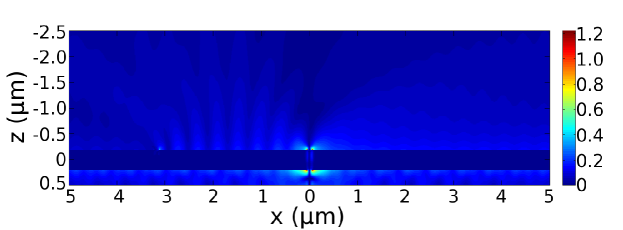
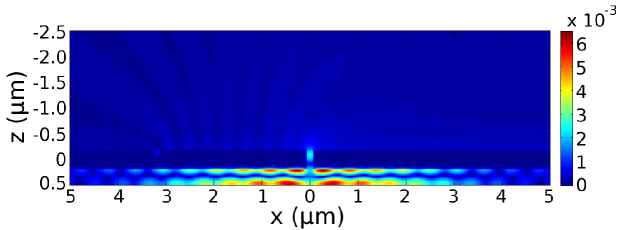
Figure 6 shows a field map of the z-component of the electric field amplitude, and Fig. 6 shows a field map of the y-component of the magnetic field amplitude. The map clearly shows the dipolar charge distribution concentrated at the corners of the slit on the input and output planes of the structure. These corner charge concentrations result from currents induced on the input side of the gold film by the magnetic field components shown in Fig. 6. The incident light propagates from below through the fused silica substrate onto the gold film and through the 100 nm wide, 400 nm thick slit. The incident light is TM polarized and the guided mode propagating along the direction within the slit sets up a standing wave resulting in a high , amplitudes at the output plane. The groove is at the output side of the gold film; and, in the simulations depicted, the distance between the center of the slit and the center of the groove is 3.18 m. The absolute value of the z-component of the electric field amplitude just above (or just below) the gold film is proportional to the surface charge density at the film surface. Note that on the output side surface, in the region between the groove and the slit, the surface wave excited at the left edge of the slit travels to the groove, is reflected from the groove’s right edge, then interferes with itself. The standing wave is clearly visible on and near the output side surface. Within the slit, on the vertical walls, is fairly strong as well. Here, however, is parallel to the metallic surface, and its presence within the skin depth of the slit walls does not signify the existence of surface charges; instead, the -field in this region is responsible for the surface currents that carry the charges back and forth between the entrance and exit facets of the slit. Figure 6 shows the magnitude of the magnetic field over the same region as Fig. 6. Interference fringes between the incident and reflected beams on fused silica substrate are clearly visible. Note also the interference fringes between the excited evanescent waves (mainly SPP) and the incident beam on the entrance facet of the gold film adjacent the substrate. Inside the slit, shows a dark band; this is caused by interference between the upward-moving guided mode within the slit and the reflected, downward-travelling mode.
In addition to the electric and magnetic field components at the surface, the light transmission efficiency in the direction through the slit as a function of slit-groove distance was calculated and is shown in Fig. 8. The transmission efficiency is defined as the ratio of the -component of the Poynting vector on the output side, integrated over , to the total energy flux incident on the slit .
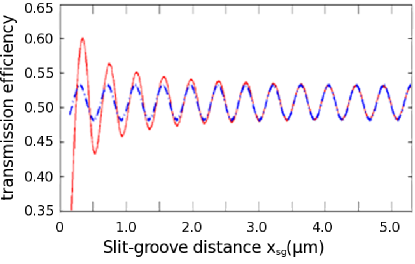
The red trace plots the transmission efficiency as a function of at the output plane. As expected the transmission efficiency exhibits pronounced oscillations with a rapid decrease in amplitude in the near-zone followed by a constant amplitude oscillation out to 6 m, the calculation limit. In the far-zone the blue trace fits the oscillations to a single cosine function, . These oscillations, as can be seen in Figs. 6 and 6, arise from the superposition of waves launched from the slit and back reflected at the groove. Because these waves are counterpropagating along , rather than copropagating along , the intensity fringe frequency is twice the fringe frequency of the far-field interferometry results expressed by Eq. 1. This standing wave at the output plane results in
| (5) |
Taking into account this factor of two in the argument of the term, the fringe oscillation in the asymptotic far-zone is in good agreement with measurement and the expected SPP. In the near-zone the oscillation exhibits a definite “chirp,” and Fig. 8 plots the deviation from the asymptotic value as function of . Comparing Fig. 8 to Fig. 4 we see that the FDTD results accord well with deviations in the interferometric fringes measured in the far- field.
IV Discussion
IV.1 Surface wave in the far-zone
The index of refraction for the bound surface-plasmon-polariton is given by the Raether formula Raether
| (6) |
where and are the real parts of the dielectric constants of metal and dielectric at the interface on which the surface wave propagates. Interpolation of reflectivity data for gold JC72 at 852 nm yields and from Eq. 6 the surface index of refraction for the surface plasmon polariton at the gold-air interface is . The measured surface index of refraction reported here, to within experimental uncertainty and in the far-zone, is in accord with the SPP prediction. The results from the FDTD calculations are also in agreement with the experimental results and the SPP predictions. It appears therefore that in the far-zone, for both silver/air and gold/air surfaces, far-field interferometry and FDTD calculations show that the surviving long-range surface wave is indeed the expected bound surface plasmon polariton. Table 1 summarizes the relevant parameters, far-field interferometric measurements, and finite-difference-time-dependent (FDTD) numerical simulations for gold and silver.
| Au, Ref. PresentExperimentalResults | nm | 1.018 | ||
|---|---|---|---|---|
| Au, Ref. PresentFDTDSimulations | nm | |||
| Ag, Ref. NearZoneResults1 | nm | |||
| Ag, Ref. NearZoneResults2 | nm | 1.015 | ||
| Ag, Ref. FarZoneSimulations | nm |
IV.2 Surface wave in the near-zone
In the near-zone both experiment and numerical simulation show that the surface wave deviates from pure SPP behavior. The effective propagation parameter , originating near the slit edge, appears greater than and evolves smoothly to the bound mode over the near-zone interval of a few microns. This behavior may be interpreted either in terms of initial excitation of a composite evanescent surface “wave packet” in -space at the slit edge LT04 , followed by subsequent decay of all surface modes except the bound mode or in terms of detailed field matching at the boundaries within the slit and near the slit edges XZM06 . These two points of view both invoke evanescent modes in order to satisfy boundary conditions in the vicinity of the slit edge, but standard wave-guide theory dictates that only the SPP mode is stable against phonon coupling to the bulk metal or to radiative decay. We can estimate the the surface distance over which the dissipation occurs by appealing to the standard Drude model of a metal that expresses the frequency dependence of the dielectric constant in terms of the bulk plasmon resonance and a damping constant .
| (7) |
In Eq. 7 is the permittivity of free space and is the dimensionless infinite frequency limit of the dielectric constant. The Drude model is based on a damped harmonic oscillator model of an electron plasma in which the electrons oscillate about positive ion centers with characteristic frequency , subject to a phenomenological damping rate , normally assumed to be due to electron-phonon coupling. Values for are typically s-1, and in fact for Au the value is s-1. For a wave propagating on the surface with group velocity ms-1 the expected decay length m, consistent with the measurements and FDTD simulations.
In summary the picture that emerges from far-field interferometry and FDTD simulation studies of these simple slit-groove structures on silver and gold films is that in the near-zone of slit-groove distances, on the order of a few wavelengths, the surface wave consists of a composite of several evanescent modes all of which dissipate within this near-zone. Only the bound, stable SPP mode survives into the far-zone, and in the studies reported here we have observed essentially constant SPP amplitude out to 12 m, a distance limited only by our fabricated structures. Earlier measurements GAV06a indicate that absorption and surface roughness scattering should permit propagation lengths as far as m.
Acknowledgements.
Support from the Ministère délégué à l’Enseignement supérieur et à la Recherche under the programme ACI-“Nanosciences-Nanotechnologies,” the Région Midi-Pyrénées [SFC/CR 02/22], and FASTNet [HPRN-CT-2002-00304] EU Research Training Network, is gratefully acknowledged. F.K. gratefullly acknowledges support from the Deutsche Telekom Stiftung. Facilities of the Caltech Kavli Nanoscience Institute are also gratefully acknowledged.References
- (1) G. Gay, O. Alloschery, B. Viaris de Lesegno, J. Weiner, and H. Lezec, “Surface Wave Generation and Propagation on Metallic Subwavelength Structures Measured by Far-Field Interferometry,” Phys. Rev. Lett. 96, 213901-1–4 (2006).
- (2) G. Gay, O. Alloschery, B. Viaris de Lesegno, C. O’Dwyer, J. Weiner and H. J. Lezec, “The optical response of nanostructured surfaces and the composite diffracted evanescent wave model,” Nature Phys. 2, 262-267 (2006).
- (3) H. Raether,Surface Plasmons on Smooth and Rough Surfaces and on Gratings, (Springer-Verlag, Berlin, 1988).
- (4) P. Lalanne and J. P. Hugonin, “Interaction between optical nano-objects at metallo-dielectric interfaces,” Nature Phys. 2, 551-556 (2006).
- (5) G. Gay, O. Alloschery, J. Weiner, H. J. Lezec, C. O’Dwyer, M. Sukharev, and T. Seideman, “Analysis of surface waves generated on subwavelength-structured silver films,” http://arXiv.org:physics/0608116 v2 (2006).
- (6) G. Gay, O. Alloschery, J. Weiner, H. J. Lezec, C. O’Dwyer, M. Sukharev, and T. Seideman, “The Response of Nanostructured Surfaces in the Near Field,” Nature Phys. 2, xxx (2006).
- (7) Y. Xie, A. Zakharian, J. Moloney, and M. Mansuripur, “Transmission of light through slit apertures in metallic films,” Opt. Express 12, 6106-6121 (2004).
- (8) Y. Xie, A. Zakharian, J. Moloney, and M. Mansuripur, “Transmission of light through a periodic array of slits in a thick metallic film,” Opt. Express 13, 4485-4491 (2005).
- (9) A. Zakharian, J. Moloney, and M. Mansuripur, “Transmission of light through small elliptical apertures,” Opt. Express 12, 2631-2648 (2004).
- (10) P. Johnson and R. Christy, “Optical Constants of the Noble Metals,” Phys. Rev. B 6, 4370-4379 (1972).
- (11) Present experimental results. Value of determined from data in the far-zone
- (12) Present FDTD simulations. Value of determined from FDTD simulations in the far-zone
- (13) Measurements from Ref. GAV06b predominantly in the transient near-zone.
- (14) Measurements from Ref. GAV06a predominantly in the transient near-zone.
- (15) Value of determined from FDTD simulations of Refs. GAW06 ; GAW06a in the far-zone.
- (16) H. J. Lezec and T. Thio, “Diffracted evanescent wave model for enhanced and suppressed optical transmission through subwavelength hole arrays,” Opt. Express 12, 3629-3651 (2004).
- (17) Y. Xie, A. R. Zakharian, J. V. Moloney, and M. Mansuripur, “Transmission of light through periodic arrays of sub-wavelength slits in metallic hosts,” Opt. Express 14, 6400-6413 (2004).