Highly dispersive photonic band-gap-edge optofluidic biosensors
Sanshui Xiao and Niels Asger Mortensen
MIC – Department of Micro and Nanotechnology, NanoDTU,
Technical
University of Denmark, DK-2800 Kongens Lyngby, Denmark
sanshui.xiao@mic.dtu.dk
Abstract
Highly dispersive photonic band-gap-edge optofluidic biosensors are studied theoretically. We demonstrate that these structures are strongly sensitive to the refractive index of the liquid, which is used to tune dispersion of the photonic crystal. The upper frequency band-gap edge shifts about 1.8 nm for , which is quite sensitive. Results from transmission spectra agree well with those obtained from the band structure theory.
1 Introduction
Photonic crystals (PhCs) are attractive optical materials for controlling and manipulating the flow of light [1, 2, 3]. One well-know property is the existence of photonic band gaps, i.e., regions of frequencies where electromagnetic wave propagation is prohibited. Another equally important aspect of a PhC is the existence of an unconventional ultra-strong dispersion. Such an ultra-strong dispersion was firstly reported by Lin et al. and demonstrated experimentally in the millimeter-wave spectrum [4]. Kosaka et al. subsequently demonstrated the superprism effect in a highly dispersive photonic microstructure [5]. These unusual properties provide an exciting possibility for obtaining microphotonic and nanophotonic devices that can focus, disperse, switch, and steer light.
Optofluidics, the marriage of nano-photonics and micro-fluidics, refers to a class of optical systems that integrate optical and fluidic devices [6]. Due to unique properties of fluids, such integration provides a new way for dynamic manipulation of optical properties and shows many potential applications [7, 8, 9, 10, 11, 12, 13, 14]. In particular, PhCs are interesting for optofluidics since they naturally have voids where fluids can be injected. Optical properties of the PhC can be easily reconfigured by selectively filling specific voids with liquid. Chow et al. demonstrated an ultra compact biosensor employing a two-dimensional (2D) photonic crystal microcavity [15]. Recently, we proposed simple biosensor structures based on highly dispersive PhC waveguides [16]. In this paper we will propose biosensor structures based on complete PhCs and the strong dispersion occuring near the Brillouin zone. In particular, the bandgap edges of the PhCs are strongly sensitive to the refractive index of the liquid which is used to tune the dispersion of the PhC. The suggested structures show a potential for biochemical sensing applications.
2 Biosensor Structures and Results
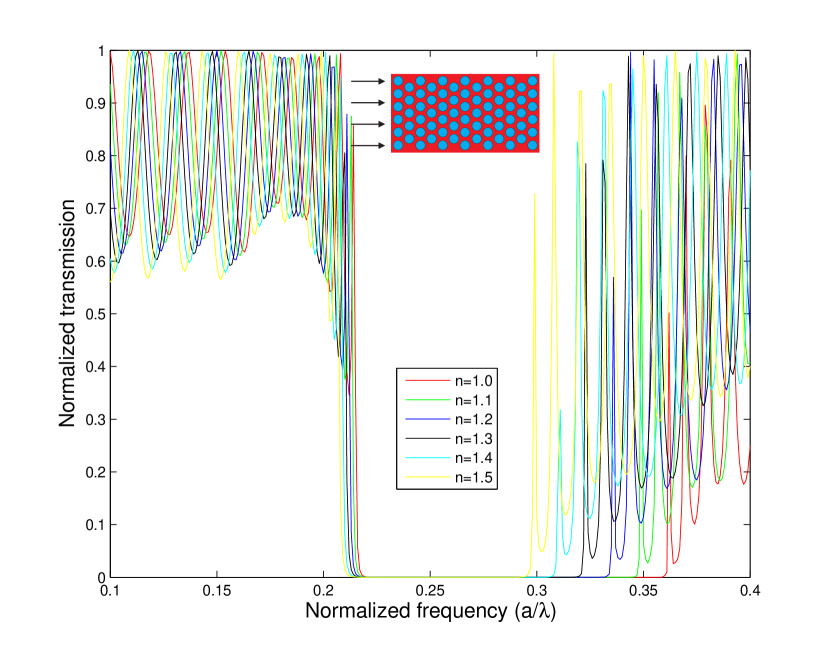
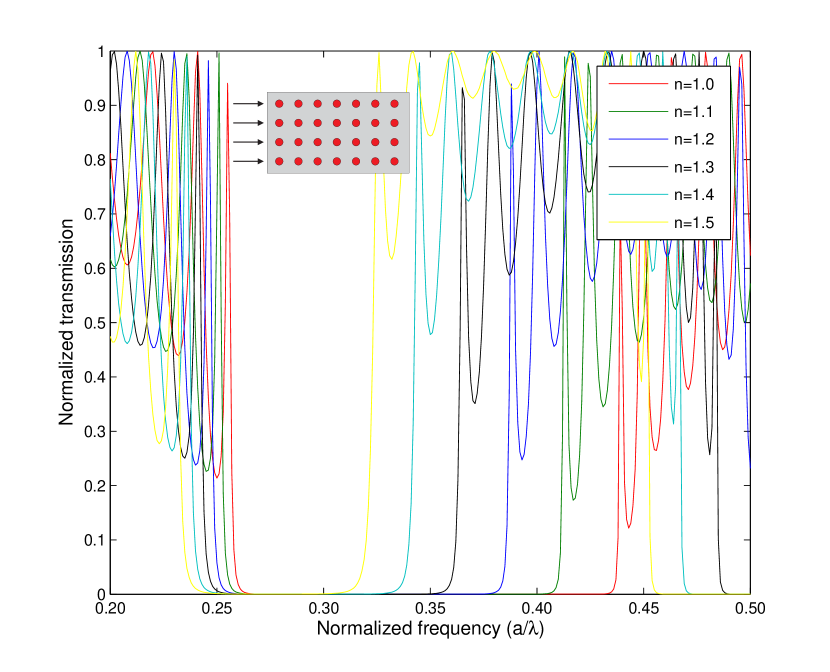
Let us first consider a 2D triangular PhC with air holes extending through a high index dielectric material, shown in the inset of Fig. 1. The holes have a radius of , where is the lattice constant. Here, we will focus our study on transmission spectra of the PhC with air holes being filled with different liquids. It was shown in our previous work that both the surface termination and surface direction of the PhC are critical for high transmission (i.e., coupling) at an interface between air and the PhC [17, 18]. Consider the TE-polarized (magnetic field parallel to the air holes) light normally incident into the PhC. To enhance the coupling at the interface, we choose to couple light to the PhC along the direction, i.e., the surface of the PhC slab is along direction. The symmetric PhC slab is composed of 11 layers along the direction and the distance (surface termination) between right boundary and the centers of the first right holes is . Transmission spectra for the PhC are obtained using the 2D finite-difference time-domain (FDTD) method [19]. For this case, we use the periodic condition in direction and perfectly matched layers in the direction [20] as the numerical boundary treatment. Figure 1 shows transmission spectra for the PhC with air holes being filled by different liquids with the refractive index increasing from to in steps of . One can see clearly that there exist band gaps for the PhCs. Transmissions outside the band gaps are quite large and close to unity for some frequencies. Peaks in the transmissions arise from the Fabry–Perot oscillations from the two boundaries and the shifts of peaks are due to the change of the effective index of the PhC when filling air holes with different liquids.
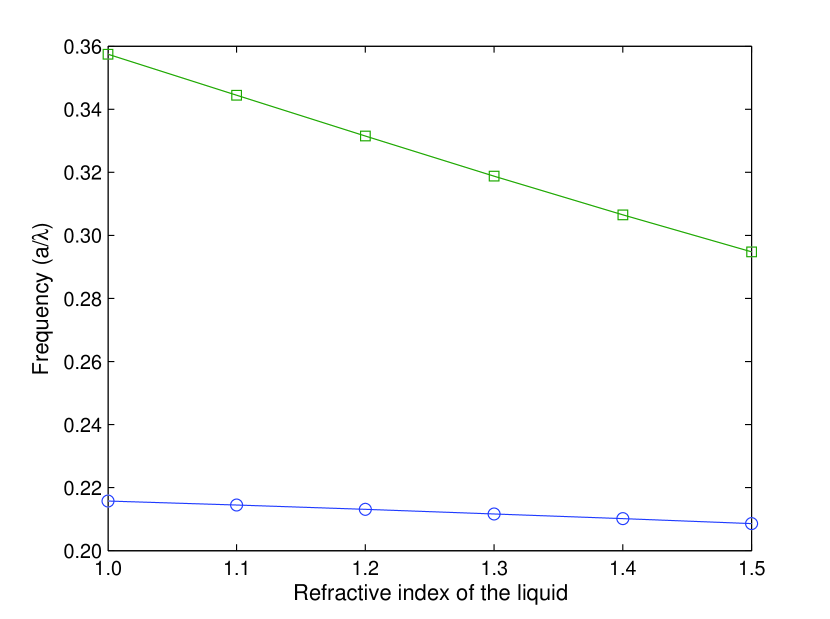
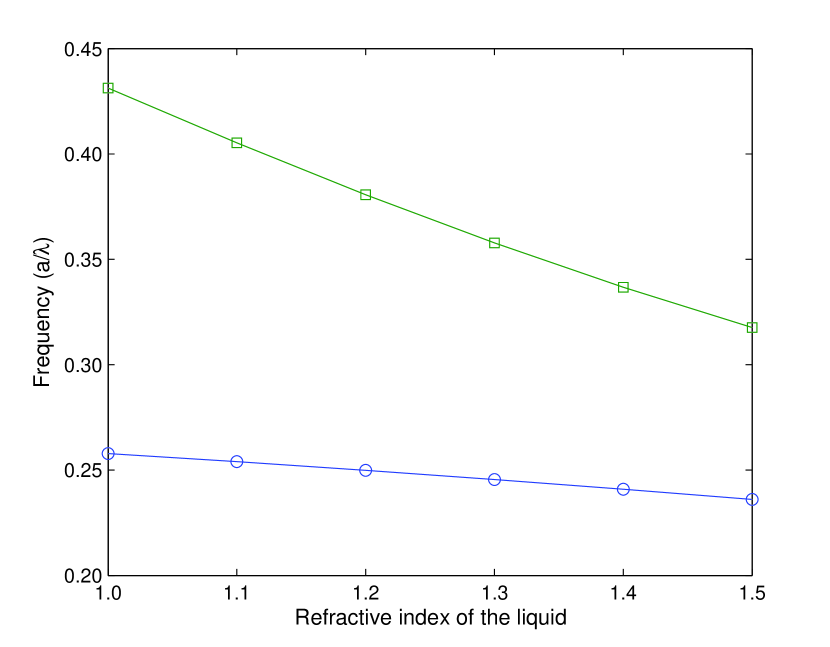
For the present application we are not interested in the details of the Fabry–Perot pattern in Fig. 1, but rather the spectral position of the band-gap edge which is a highly sensitive measure for changes in the refractive index of the liquid. To see it more clearly, the change of the band-gap edge as a function of the refractive index of the liquid is shown in Fig. 2. As seen, the low-frequency mode-gap edges slightly change with the refractive index of the liquid. However, the high-frequency mode-gap edge is strongly dependent on the refractive index of the liquid, as shown by squares in Fig. 2. As an example, the high-frequency band-gap edge shifts when the air holes (with index ) are filled by a liquid of index . For comparison, it is only for the low-frequency band-gap shift. Now, consider a commercial silicone fluid with a calibrated refractive-index accuracy of , as mentioned in Ref. [15], where the refractive index of the liquid varies from to in increments of . For the working wavelength around (here we choose ), the high-frequency band-gap edge shifts up to 1.17 nm for , while 0.33 nm for the low-frequency band-gap edge. For comparison, we note that the shift in resonant wavelength for the high-quality-factor PhC cavity is about nm for [15]. The above results demonstrate that even such a simple PhC has potential applications as a sensitive biosensor.
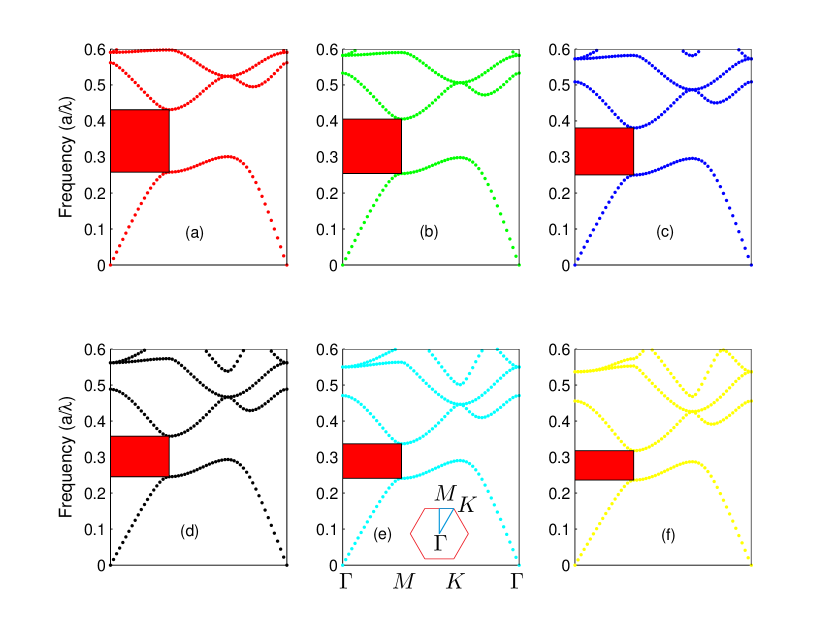
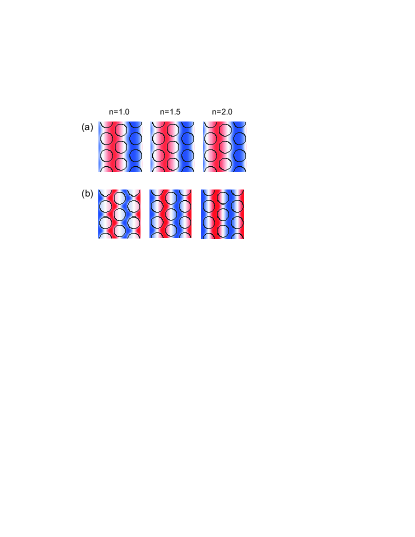
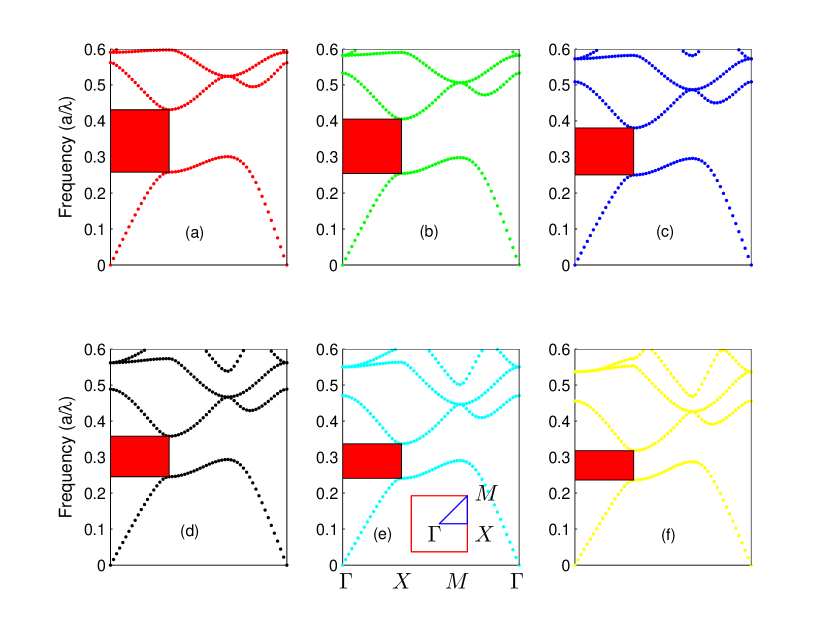
To further elucidate the physics behind the strong sensitivity, we next support the picture by dispersion calculations for the PhC. For this purpose we use a Block-iterative frequency-domain method [21]. The dispersion of the PhC, in absence or presence of a fluid, is shown in Fig. 3. Figure 3 (a)-(f) summarize the dispersions for the PhC, where the air holes are filled by a liquid with a varying refractive index. One can clearly see that these PhCs have photonic band gaps for the TE polarization, which are related to the band gaps in Fig. 1, though the band-gap regions appear slightly different with those obtained from the transmission spectra. Note that the band gaps in Fig. 1 are larger than those in Fig. 3. This is because the band gaps in Fig. 3 are for all incident directions while the band gaps in Fig. 1 are only for propagation along the normal direction. From Figs. 1 and 3, we also observe that the position of the gap in the transmission spectra, which are obtained for plane electromagnetic waves incident normally on the PhC, agree very well with the position of the gaps in the frequency band structure of the corresponding infinite crystal along the direction (denoted by red regions). When increasing the refractive index of the liquid [going from panel (a) toward panel (f)], the high-frequency band-gap edge is significantly downward shifted, while the low-frequency band-gap edge slightly decreases. We emphasize that all results obtained from band structures are consistent with those from the transmission spectra. The sensitivity of this structure is mainly attributed to the strong dispersion of the PhC mode. Figures 4(a) and 4(b) show the first and second PhC Bloch modes at the band-gap edge ( point, ), where air holes in the PhC are filled by the liquid with a refractive index of , ,and , respectively. As seen, the low-frequency band-edge Bloch mode hardly changes with varying refractive index of the liquid. However, for the high-frequency band-edge mode, the ratio of the energy in holes becomes lager as the refractive index of the liquid increases, i.e., this mode distribution is strongly dependent on the refractive index of the liquid, which is in agreement with the results in Figs. 1-3. A somewhat similar structure has been realized experimentally by Okamoto et al. [22], but in this paper we have studied the shift for the band-gap edges in details an offered a physical explanation for the shifts. Besides, compared to the device in Ref. [22], our proposed device offers a better resolution.
Let us next consider a square PhC with dielectric rods in air, as shown in the inset of Fig. 5. The permittivity of the rods is , and the radius of the rods is r=0.2a. Transmission spectra are shown in Fig. 5, where the background of the PhC is filled by different liquids. The band-gap edge as a function of the refractive index of the liquid is shown in Fig. 6. Similar to the result shown in Fig. 2, the low-frequency band-gap edge hardly changes as the refractive index of the liquid increases, while the high-frequency band-gap edge is strongly dependent on the liquid. Compared with the result for the high-frequency band-gap edge shown in Fig. 2, the results in Fig. 6 illustrate a higher sensitivity. The high-frequency band-gap edge shifts when the air holes are filled by a liquid of index . For comparison we have for the structure shown in the inset of Fig. 1.
Band structures are shown in Fig. 7, where red regions represent the band gap for direction. From Fig. 5 and Fig. 7, we find that the position of the gap in the transmission spectra agree very well with the position of the gaps for the PhC along the direction. When increasing the refractive index of the liquid [going from panel (a) toward panel (f)], the high-frequency band-gap edge is significantly downward shifted, while the low-frequency band-gap edge slightly decreases. Again we consider a commercial silicone fluid with a calibrated refractive-index accuracy of . For the working wavelength around (), the mode-gap edge shifts up to 1.60 nm for . The proposed biosensor relies strongly on the dispersion of the PhC band-edge mode and the presence of a band gap. To further improve the sensitivity, we optimize the PhC structure by varying the radius of the rods. By a careful design of the structure shown in the inset of Fig. 5, we have been able to improve the design further. For the working wavelength around (), the band-gap edge shifts about 1.8 nm for , when is tuned to . Compared to the biosensor we proposed before [16], this structure not only shows much better sensitivity but it also seems relatively easy to realize experimentally, since the design involves no cavities or waveguide structures. Finally, this device, with a size of , is sufficiently compact for most applications.
3 Conclusions
To conclude, we have theoretically studied optofluidic biosensors based on highly dispersive 2D photonic crystal. Our study shows that these structures are strongly sensitive to the refractive index of the liquid, which is used to tune dispersion of photonic crystal. For the working wavelength around , we predict shifts in the band-gap edge up to 1.8 nm for . Although our study is based on 2D photonic crystals, it can be extended to the case of a 2D photonic crystal slab. For a 2D photonic crystal slab, the field will attenuate due to out-of-plane loss, but the shift of the high-frequency mode-gap edge at X/M point (when tuning by liquid) is unaffected by the out-of-plane radiation. The high sensitivity makes such devices interesting for biochemical sensing applications.
Acknowledgments
This work is financially supported by the Danish Council for Strategic Research through the Strategic Program for Young Researchers (grant no: 2117-05-0037).
REFERENCES
- [1] S. John, “Strong localization of photons in certain disordered dielectric superlattices”, Phys. Rev. Lett. 58 2486 – 2489 (1987).
- [2] E. Yablonovitch, “Inhibited spontaneous emission in solid state physics and electronics”, Phys. Rev. Lett. 58 2059–2062 (1987).
- [3] J. D. Joannopoulos, R. D. Meade, and J. N. Winn, Photonic crystals: molding the flow of light (Princeton University Press, Princeton, 1995).
- [4] S. Y. Lin, V. M. Hietala, L. Wang, and E. D. Jones, “Highly dispersive photonic band-gap prism”, Opt Lett 21 1771–1773 (1996).
- [5] H. Kosaka, T. Kawashima, A. Tomita, M. Notomi, T. Tamamura, T. Sato, and S. Kawakami, “Superprism phenomena in photonic crystals”, Phys. Rev. B 58 R10096–R10099 (1998).
- [6] D. Psaltis, S. R. Quake, and C. H. Yang, “Developing optofluidic technology through the fusion of microfluidics and optics”, Nature 442 381 – 386 (2006).
- [7] P. Domachuk, H. C. Nguyen, B. J. Eggleton, M. Straub, and M. Gu, “Microfluidic tunable photonic band-gap device”, Appl. Phys. Lett. 84 1838 – 1840 (2004).
- [8] D. Erickson, T. Rockwood, T. Emery, A. Scherer, and D. Psaltis, “Nanofluidic tuning of photonic crystal circuits”, Opt. Lett. 31 59 – 61 (2006).
- [9] J. C. Galas, J. Torres, M. Belotti, Q. Kou, and Y. Chen, “Microfluidic tunable dye laser with integrated mixer and ring resonator”, Appl. Phys. Lett. 86 264101 (2005).
- [10] C. Grillet, P. Domachuk, V. Ta’eed, E. Magi, J. A. Bolger, B. J. Eggleton, L. E. Rodd, and J. Cooper-White, “Compact tunable microfluidic interferometer”, Opt. Express 12 5440 – 5447 (2004).
- [11] H. Kurt and D. S. Citrin, “Coupled-resonator optical waveguides for biochemical sensing of nanoliter volumes of analyte in the terahertz region”, Appl. Phys. Lett. 87 241119 (2005).
- [12] M. Gersborg-Hansen, S. Balslev, N. A. Mortensen, and A. Kristensen, “A coupled cavity micro-fluidic dye ring laser”, Microelectron. Eng. 78-79 185 – 189 (2005).
- [13] Z. Y. Li, Z. Y. Zhang, T. Emery, A. Scherer, and D. Psaltis, “Single mode optofluidic distributed feedback dye laser”, Opt. Express 14 696 – 701 (2006).
- [14] M. Gersborg-Hansen and A. Kristensen, “Optofluidic third order distributed feedback dye laser”, Appl. Phys. Lett. 89 103518 (2006).
- [15] E. Chow, A. Grot, L. W. Mirkarimi, M. Sigalas, and G. Girolami, “Ultracompact biochemical sensor built with two-dimensional photonic crystal microcavity”, Opt. Lett. 29 1093 – 1095 (2004).
- [16] S. Xiao and N. A. Mortensen, “Highly sensitive optofluidic biosensors based on dispersive photonic crystal waveguides”, preprint.
- [17] S. Xiao, M. Qiu, Z. Ruan, and S. He, “Influence of the surface termination to the point imaging by a photonic crystal slab with negative refraction”, Appl. Phys. Lett. 85 4269–4271 (2004).
- [18] Z. Ruan, M. Qiu, S. Xiao, S. He, and L. Thylen, “Coupling between plane waves and Bloch waves in photonic crystal with negative refraction”, Phys. Rev. B 71 045111 (2005).
- [19] A. Taflove, Computational Electrodynamics: The Finite-Difference Time-Domain Method, 2 edn. (Artech House INC, Norwood, 2000).
- [20] J. P. Berenger, “A perfectly matched layer for the absorption of electromagnetic waves”, J. Comput. Phys. 114 185–200 (1994).
- [21] S. G. Johnson and J. D. Joannopoulos, “Block-iterative frequency-domain methods for Maxwell’s equations in a planewave basis”, Opt. Express 8 173 – 190 (2001).
- [22] K. Okamoto, M. Sugita, Y. Nagotomo, J. Yamamichi, T. Yamazaki, and M. Uchiba, “Photonic crystal sensor with micro flow channels”, International Symposium on Photonic and Electromagnetic Crystal Structures (PECS-VI), June 19-24, Crete, Greece, 2005.