Optical fiber taper coupling and high-resolution wavelength tuning of microdisk resonators at cryogenic temperatures
Abstract
A system for studying microcavity resonators at cryogenic temperatures ( 10 K) through evanescent coupling via optical fiber taper waveguides is reported, and efficient fiber coupling to AlGaAs microdisk cavities with embedded quantum dots is demonstrated. As an immediate application of this tool, we study high-resolution tuning of microdisk cavities through nitrogen gas adsorption, as first discussed by Mosor, et al Mosor et al. (2005). By proper regulation of the nitrogen gas flow and delivery of the gas to the sample surface, continuous tuning can be achieved with modest gas flows, and overall wavelength shifts as large as 4 nm are achieved.
pacs:
42.70.Qs, 42.55.Sa, 42.60.Da, 42.55.PxSolid-state systems involving a semiconductor microcavity coupled to a semiconductor quantum dot (QD) Michler (2003) offer a promising implementation of cavity quantum electrodynamics (cQED) Kimble (1998) for quantum information processing and computing applications. In addition to demonstrations of vacuum Rabi splitting in the emission spectrum of a QD-microcavity system Reithmaier et al. (2004); Yoshie et al. (2004); Peter et al. (2005), the quality factor () of wavelength-scale III-V semiconductor microcavities has recently exceeded 105 Srinivasan et al. (2005a); Herrmann et al. (2006), paving the way for cQED experiments in which the coherent QD-photon coupling rate can greatly exceed the system’s dissipative rates. Also important is the development of an efficient interface through which the microscopic cavity field can be accessed from macroscopic optics. Silica optical fiber tapers, initially used as effective input-output couplers for silica microcavities Knight et al. (1997); Cai et al. (2000), have recently been used to couple to high refractive index microcavities Srinivasan et al. (2004), including AlGaAs microdisk cavities with embedded QDs Srinivasan et al. (2005a).
Here, we report on the development of a system that extends our previous work, done at room temperature and pressure, to the high vacuum ( Torr), cryogenic ( K) environments in which QD-based cQED experiments are done Reithmaier et al. (2004); Yoshie et al. (2004); Peter et al. (2005). This system is used to interrogate wavelength-scale GaAs/AlGaAs microdisk cavities containing self-assembled InAs QDs, with information such as the cavity transmission and QD emission spectrum obtained. In the second part of the paper, we build on the work of Refs. Mosor et al. (2005); Strauf et al. (2006), using nitrogen (N2) gas adsorption to tune the resonant wavelength of microcavities in a cryogenic environment. By proper regulation of the N2 flow and delivery of the gas near the sample surface, potential difficulties discussed in Ref. Mosor et al. (2005) are overcome, and reproducible, high-resolution tuning is achieved. Furthermore, the fiber taper coupling allows for detailed investigation of the N2 adsorption process.
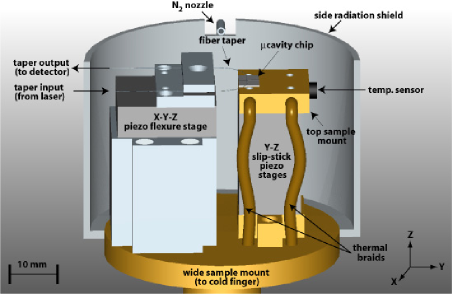
The fiber tapers used are single mode optical fibers that have been heated and stretched so that their central region has a minimum diameter of m. Potential difficulties in extending fiber taper coupling to a high vacuum, cryogenic environment include the mechanical stability of the fiber taper assembly, the lack of viscous air-damping of fiber taper vibrations, and the mechanical and optical stability of the fiber taper itself under repeated temperature cycling. Figure 1 depicts the setup we have developed, where the sample and fiber taper reside inside a modified Janis ST-500 continuous flow, liquid He cryostat. A teflon-based compression fitting Abraham and Cornell (1998) is used to feed the two optical fiber pigtails of the fiber taper from the interior vacuum to the exterior of the cryostat. The fiber taper is held in a “u”-shaped configuration to provide self-tensioning of the taper. Coarse alignment of the taper to the microcavity is achieved by positioning the microcavity sample using slip-stick Y-Z piezo positioners with a displacement range of several millimeters. Fine adjustment in the taper position is provided by an X-Y-Z piezo-electric flexure stage with a maximum displacement of several microns at K. A thermally conductive pathway between the sample and the cold finger is provided by copper braids that connect the top sample mount to the cold finger. This ensures that the sample can get to the requisite low temperature ( K), which is measured by a silicon diode that is affixed to the top sample mount.
The devices we study are small diameter (=2-4.5 m) GaAs/AlGaAs microdisks that contain a single layer of InAs QDs (room temperature ground state emission at nm), as discussed elsewhere Srinivasan et al. (2005a). The cryostat is cooled to a sample temperature of K, and during this process, no additional loss in the optical fiber taper transmission is observed (typical total insertion loss is 10-50% depending upon the taper tension). The taper is positioned in the near-field of the microdisk under study using the piezo stage configuration described above. An adjustable air-gap may be maintained between taper and disk or the taper may be placed into direct contact with the disk, depending upon the level of cavity loading desired (anywhere from under- to over-coupled is possible). Accuracy in the taper-disk gap is limited only by vibration-induced fluctuations in the taper position (tens of nm in our current set-up). In general, we have found that the taper can remain in a fixed coupling position (at room or cryogenic temperatures) for times as long as several hours. The fiber taper was also unaffected by repeated temperature cycling. As described in detail in Ref. Srinivasan et al. (2005b), the taper can be used to enhance the collection efficiency of light emitted from microdisk whispering gallery modes (WGMs) by nearly two orders of magnitude over normal-incidence free-space collection. Figure 2 compares fiber taper and free-space collection of the low temperature (T K) emission from a m microdisk that is optically pumped with 100 W of incident power from an 830 nm laser diode. The collected power and number of cavity modes observed in the taper-collected spectrum greatly exceeds that obtained by free-space collection, with emission into WGMs from the ground (GS) and excited state (ES) manifolds of the QDs clearly visible.
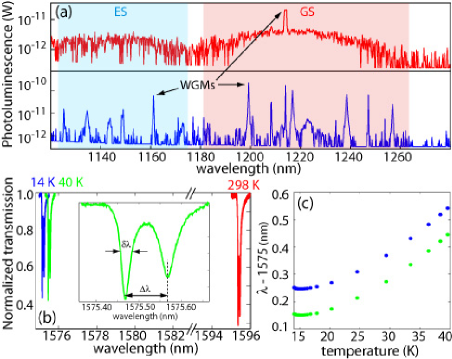
More than just an efficient collection optic, the fiber taper may also be used to optically probe and excite the cavity-QD system in a highly efficient manner. Here we use the fiber taper to monitor the transmission properties of the cavity modes of the microdisk as a function of temperature, and as described below, during cavity mode tuning experiments involving N2 gas adsorption. To this end, a scanning tunable laser (linewidth MHz) is connected to the fiber taper input and the wavelength-dependent taper output transmission is monitored with a photodetector. The polarization state of the fiber taper mode is achieved through a polarization controller inserted between the laser and taper input. Figure 2(b) shows the transmission spectra of a cavity mode in a m disk in the 1500 nm band111From finite-element-method simulations, this mode is identified as a TE (electric field components predominantly in-plane), , WGM, where and denote the radial and azimuthal mode number, respectively.. The cavity mode wavelength is seen to shift approximately nm as the temperature is reduced from K to K as a result of the decrease in the AlGaAs disk refractive index. As noted in our previous work (Ref. Srinivasan et al. (2005a) and references therein), the high- modes often appear as a doublet (inset of Fig. 2(b)) due to surface roughness on the microdisk which couples the initially degenerate WGMs into frequency-split standing wave modes.
As discussed in many other works, the small tuning range (0.3 nm for T- K in Fig. 2(c)) afforded by thermal tuning is a significant limitation in cQED experiments due to the imprecise spectral positioning of QD exciton peaks and cavity modes during growth and fabrication. To overcome this difficulty, Mosor, et al., utilized noble gas adsorption on the sample surface to achieve post-fabrication shifts in a photonic crystal cavity of up to 5 nmMosor et al. (2005). Here, we apply this method to tune the resonances of our microdisk cavities while using the fiber taper probe to monitor their behavior. Reference Mosor et al. (2005) achieves wavelength tuning in discrete steps by filling a secondary chamber with gas (Xe or N2) until a desired pressure is reached, releasing that volume into the cryostat, and then repeating. The authors found that the fill pressure must lie within a vary narrow range, below which no tuning occurs and above which excessively fast tuning occurs. To improve upon the tuning resolution and repeatability, we have made two key modifications. Rather than introduce the gas through the cryostat vacuum line, we inject it through a 1/16” tube (inner diameter mm) that is routed into an opening in the top of the side radiation shield (Fig. 1), so that gas can be locally delivered with line-of-sight to the sample. Next, instead of introducing the gas into the cryostat through repeated cycles, we fill an external chamber (V=0.1 L) until a fixed pressure is reached (10 torr) and then release it into the cryostat using a metering valve to control the flow rate. We monitor the cavity mode transmission spectrum and use a shut-off valve to stop the gas flow when a desired wavelength shift is achieved (the shut-off and metering valves are positioned as close as possible to the cryostat to minimize dead volume between themselves and the end of the injection nozzle).
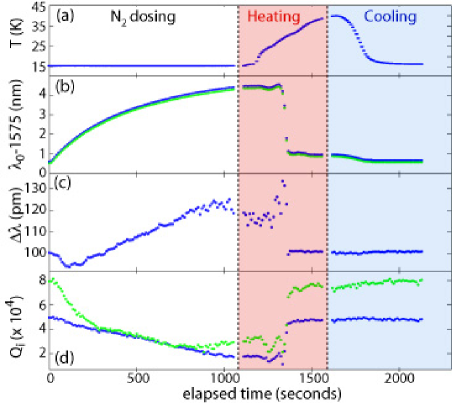
Tuning data obtained using high purity () N2 gas is shown in Fig. 3 for the microdisk mode studied in Fig. 2(b-c), with the taper in contact with the disk edge. Transmission spectra of the taper-coupled microdisk were recorded every 10 seconds over the entire tuning cycle, which included an initial N2 dosing period, a subsequent N2 desorption phase accomplished by heating the sample with a resistive heater, and a final cooldown period. The cavity transmission spectra were fit using a standard doublet modelBorselli et al. (2005), from which we obtain the spectral position of the resonant modes (), the doublet mode splitting (), and the intrinsic cavity -factor (). Figure 3(b) shows smooth, continuous tuning is achieved, with a resonance wavelength shift of nm occurring after 1060 s of N2 dosing. During the heating phase the N2 shut-off valve is closed, and the wavelength dramatically drops at T K as N2 begins to rapidly desorb from the disk surfaceSchlichting and Menzel (1993). The temperature is further raised to K to ensure complete N2 removal. Finally, the sample is cooled back down to the starting temperature, at which point , , and have returned to their original values.
The tuning cycle of Fig. 3 was found to be repeatable from run-to-run, and could be interrupted during the N2 dosing phase to position the cavity mode resonance wavelength with an accuracy of better than pm. Once positioned, for temperatures below TK (where N2 desorption is negligible over a timescale of hoursSchlichting and Menzel (1993)) we found the cavity mode wavelength to be highly stable. One non-ideal side effect of the N2 tuning, evident in Fig. 3(d), is the degradation in the -factor with increasing N2 adsorption (-degradation factors of 2-3 for nm of tuning were typical for modes of ). Several features in the data of Fig. 3 indicate that the optical loss is due to sub-wavelength optical scattering from the adsorbed N2 film. The clearest indicator is the rapid rise in doublet splitting with wavelength tuning (Fig. 3(c)), a result of increased surface scatteringBorselli et al. (2006). Visual inspection of microdisks after large tuning excursions also showed clouding of the top surface. Both observations point to an incomplete wetting of N2 on AlGaAs, and the growth of a rough bulk overlayer consisting of N2 crystallitesVolkmann and Knorr (1991).
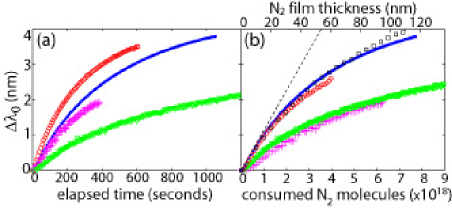
Fig. 4(a) shows the wavelength shift versus elapsed time, under varying flow conditions, and for cavity modes of two different microdisks ( m). A simple perturbative analysis relates the cavity mode tuning to the mode’s overlap with the disk surface through the equation , where is the film thickness, is the film refractive index (Pilla et al. (1999)), and is the (linear) modal energy density at the air-disk interface. Such an analysis yields an N2 film thickness of nm for the measured mode tunings of nm. For films of this thickness the perturbative analysis breaks down and one must resort to more exact numerical methods. Finite-element method (FEM) simulations of the mode tuning versus N2 film thickness were performed for the TE1,20 mode of the m microdisk, and are plotted in Fig. 4(b) for N2 coverage of the top and side of the disk (assuming line-of-sight deposition). The measured data are also plotted in Fig. 4(b) versus consumed N2 (estimated from the initial and final chamber pressures, and assuming an exponential decrease in the pressure with time). The simulated N2 thickness is related to the measured N2 consumption with a fixed scaling factor (the sticking coefficient of rare gases to their solids is known to be near-unitySchlichting et al. (1992), i.e., constant), determined by a least-squares fit to the measured data. From these plots the measured tuning is seen to be independent of flow rate for each of the cavity modes, and the saturation in the tuning rate with increasing layer thickness is well captured by the FEM simulation.
In summary, we have demonstrated that optical fiber tapers can provide an efficient interface for transferring light to and from standard laboratory fiber optics into a micron-scale cavity housed in a high-vacuum, cryogenic environment. In addition, we have shown that rare gas adsorption can be used to produce high resolution, continuous tuning of microdisk WGM wavelengths. These two tools are of significant utility to future cQED experiments involving interactions of single QDs with fiber-coupled microdisk cavities Srinivasan and Painter (2006).
The authors thank A. Stintz and S. Krishna of the University of New Mexico for materials growth, and R. Heron of the Janis Research Company for assistance in the cryostat design.
References
- Mosor et al. (2005) S. Mosor, J. Hendrickson, B. C. Richards, J. Sweet, G. Khitrova, H. Gibbs, T. Yoshie, A. Scherer, O. B. Shchekin, and D. G. Deppe, Appl. Phys. Lett. 87, 141105 (2005).
- Michler (2003) P. Michler, ed., Single Quantum Dots (Springer Verlag, 2003).
- Kimble (1998) H. J. Kimble, Physica Scripta T76, 127 (1998).
- Reithmaier et al. (2004) J. P. Reithmaier, G. Sek, A. Loffer, C. Hoffman, S. Kuhn, S. Reitzenstein, L. V. Keldysh, V. D. Kulakovskii, T. L. Reinecke, and A. Forchel, Nature 432, 197 (2004).
- Yoshie et al. (2004) T. Yoshie, A. Scherer, J. Hendrickson, G. Khitrova, H. Gibbs, G. Rupper, C. Ell, Q. Schenkin, and D. Deppe, Nature 432, 200 (2004).
- Peter et al. (2005) E. Peter, P. Senellart, D. Martrou, A. Lematre, J. Hours, J. M. Gérard, and J. Bloch, Phys. Rev. Lett. 95 (2005).
- Srinivasan et al. (2005a) K. Srinivasan, M. Borselli, T. J. Johnson, P. E. Barclay, O. Painter, A. Stintz, and S. Krishna, Appl. Phys. Lett. 86, 151106 (2005a).
- Herrmann et al. (2006) R. Herrmann, T. Sunner, T. Hein, A. Loffler, M. Kamp, and A. Forchel, Opt. Lett. 31, 1229 (2006).
- Knight et al. (1997) J. C. Knight, G. Cheung, F. Jacques, and T. A. Birks, Opt. Lett. 22, 1129 (1997).
- Cai et al. (2000) M. Cai, O. Painter, and K. J. Vahala, Phys. Rev. Lett. 85, 74 (2000).
- Srinivasan et al. (2004) K. Srinivasan, P. E. Barclay, M. Borselli, and O. Painter, Phys. Rev. B 70, 081306R (2004).
- Strauf et al. (2006) S. Strauf, M. T. Rakher, I. Carmeli, K. Hennessy, C. Meier, A. Badolato, M. J. A. DeDood, P. M. Petroff, E. L. Hu, E. G. Gwinn, et al., Appl. Phys. Lett. 88, 043116 (2006).
- Abraham and Cornell (1998) E. R. Abraham and E. A. Cornell, Applied Optics 37, 1762 (1998).
- Srinivasan et al. (2005b) K. Srinivasan, A. Stintz, S. Krishna, and O. Painter, Phys. Rev. B 72, 205318 (2005b).
- Borselli et al. (2005) M. Borselli, T. J. Johnson, and O. Painter, Opt. Express 13, 1515 (2005).
- Schlichting and Menzel (1993) H. Schlichting and D. Menzel, Rev. Sci. Instrum. 64, 2013 (1993).
- Borselli et al. (2006) M. Borselli, T. J. Johnson, and O. Painter, Appl. Phys. Lett. 88, 13114 (2006).
- Volkmann and Knorr (1991) U. G. Volkmann and K. Knorr, Phys. Rev. Lett. 66, 473 (1991).
- Pilla et al. (1999) S. Pilla, J. A. Hamida, K. A. Muttalib, and N. S. Sullivan, Phys. Lett. A 256, 75 (1999).
- Schlichting et al. (1992) H. Schlichting, D. Menzel, T. Brunner, and W. Brenig, J. Chem. Phys. 97, 4453 (1992).
- Srinivasan and Painter (2006) K. Srinivasan and O. Painter, quant-ph/0606142 (2006).