Change-point detection in the historical hurricane number time-series: why can’t we detect change-points at US landfall?
Abstract
The time series of the number of hurricanes per year in the Atlantic basin shows a clear change of level between 1994 and 1995. The time series of the number of hurricanes that make landfall in the US, however, does not show the same obvious change of level. Prima-facie this seems rather surprising, given that the landfalling hurricanes are a subset of the basin hurricanes. We investigate whether it really should be considered surprising or whether there is a simple statistical explanation for the disappearance of this change-point at landfall.
1 Introduction
Recent increases in both the number of hurricanes in the Atlantic and the number of hurricanes making landfall on the US coastline motivate a desire to try and understand whether the frequency distribution of hurricane occurrence varies in time, and in particular whether it has changed recently. These questions have been addressed by a number of previous authors and in general there is agreement that the distribution of the number of hurricanes per year in the Atlantic basin is not stationary, but has shown changes throughout the last 100 years, including recent changes (see, for example, Elsner et al. (2000), Elsner et al. (2003), Goldenberg et al. (2001)). There is no clear agreement about what exactly is causing these changes, but most authors seems to believe that they are driven by a combination of climate change and internal climate variability.
One of the statistical methods that has been used to understand the historical behaviour of hurricane numbers in the Atlantic basin is change-point analysis, in which one tries to identify points in time at which the mean of the time-series changed. Such a change-point analysis of hurricane numbers was performed by Elsner et al. (2000) and Elsner et al. (2003), who analysed category 3-5 hurricane numbers in the Atlantic basin and found change-points in the years 1942/1943, 1964/1965 and 1994/1995. Jewson and Penzer (2006a) did a further analysis of both category 1-5 and category 3-5 hurricane numbers in the basin (using a very different statistical method from the methods used in Elsner et al. (2000) or Elsner et al. (2003)) and found change-points in the years 1931/1932, 1947/1948, 1969/1970 and 1994/1995 for category 1-5 storms and the years 1914/1915, 1947/1948, 1964/1965 and 1994/1995 for category 3-5 storms. Comparing the results from these different studies we see that the 1994/1995 change is the most robust, since it appears in all the studies. It is also the most important since it is the most recent, and hence the most relevant to understanding the current and future levels of hurricane activity. One should be a little cautious about interpreting the earlier change-points as necessarily telling us something about physical reality, since the earlier data is possibly somewhat inaccurate.
Jewson and Penzer (2006b) repeated their change-point analysis for the number of hurricanes at US landfall. The results were strikingly different from the basin change-point results: they couldn’t identify a single significant change-point in either the series of category 1-5 storms or the series of category 3-5 storms. These results agreed with the earlier work of Elsner et al. (2003) who also couldn’t identify change-points in the landfalling series. Prima facie, these results seem rather surprising. The landfalling storms, are, after all, a subset of the total number of storms, and might naively be expected to inherit the properties of the basin time series. Why, then, do the change-points disappear, and why, in particular, does the 1994/1995 change-point disappear? One can imagine two possible answers to this question: (a) that the process by which basin storms become landfalling storms is complex, and varies in time in such a way that the landfalling series does not inherit properties of the basin series, or (b) that the process by which basin storms become landfalling storms is simple, and dominated by the geometry of typical hurricane tracks and the shape of the US coastline, and the landfalling series does in principle inherit the properties of the basin series, but that in practice these properties are obscured by noise in the landfalling series. Reality may be a combination of these two limiting-case explanations.
One first test, which sheds some light on these two hypotheses, is to assess whether hypothesis (b) is a plausible one or not, and that is the goal of this article. We will do this by considering only the 1994/1995 change-point. We look at how easy it is to detect this change-point in both the basin and the landfall data, and then we look at how easy one would expect it to be to detect the change-point in both the basin and the landfall data, given that there is a change-point in the basin data, and given a simple relationship between basin and landfall. By doing so we are investigating whether the ‘disappearance’ of the change-point at landfall in the real data could be just a simple statistical effect.
2 Results
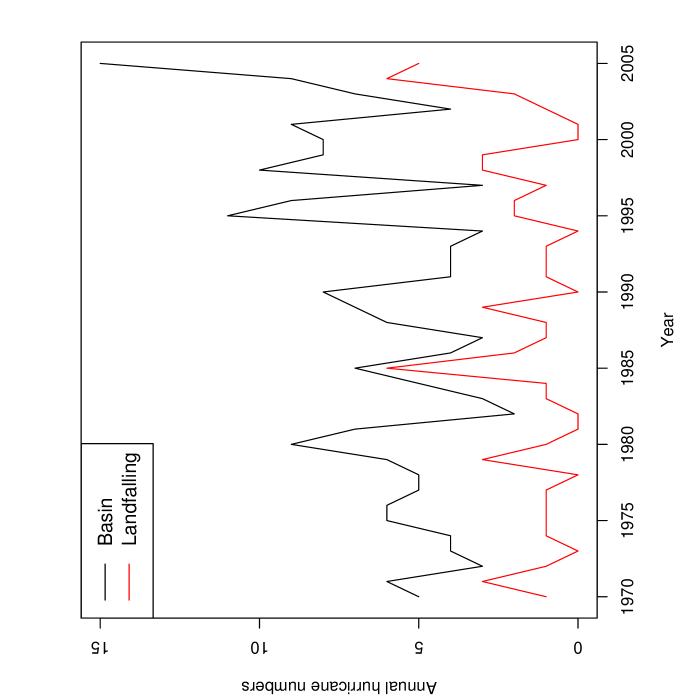
For the observed basin hurricane numbers, derived from HURDAT (Jarvinen et al., 1984) and shown in figure 1 (black line), we first test whether there is a significant difference in the mean number of hurricanes between the periods 1970-1994 and 1995-2005. These periods are defined by the last two change-points detected by Jewson and Penzer (2006a) in the total hurricane number time-series. We use a statistical test that compares the differences in the means of poisson distributions for finite samples (see the appendix for more details: this test, known as a ‘C-test’, is a poisson distribution version of the well-known t-test that can be used to detect differences in the means of data from a normal distribution). We would expect to find a significant difference, since the 1994-1995 change-point was identified using a statistical method based on the same data (in other words, this is not really a well-posed test since we are using the data twice: once to create the hypothesis, and once to test it.) We obtain a p-value for this difference of 0.000258, which is indeed highly significant. However, when we repeat the same test for landfalling hurricane numbers (also shown in figure 1, grey line), we only obtain a p-value of 0.0364 (and this is now a well-posed test). We would thus reject at the 0.01 level the hypothesis that the rates before and after the change-point are different for landfalling hurricanes, but we would accept it for basin hurricanes.
We now address the question of why we might be seeing this difference in significance levels between the basin and landfall data using simulations.
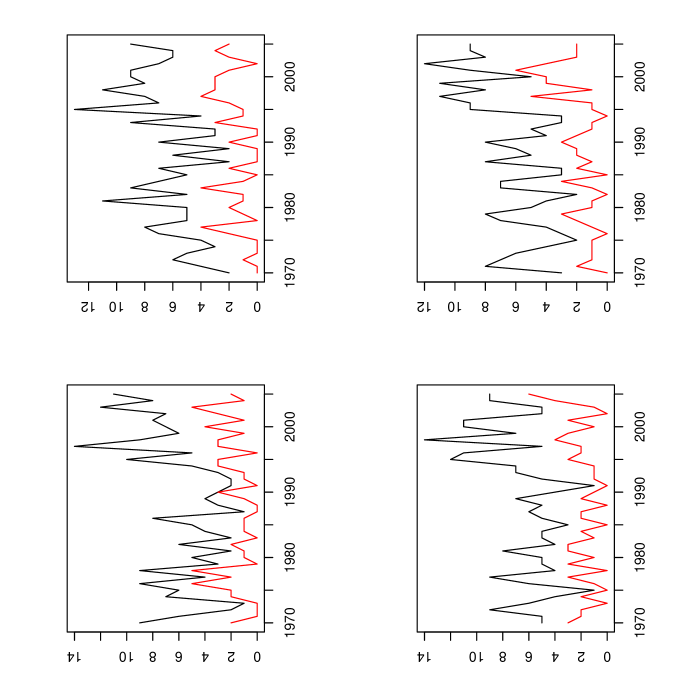
First, we generate 10,000 realisations of surrogate data for the number of basin hurricanes for the period 1970 to 2005 by simulating from independent poisson distributions. We incorporate an artificial change-point into this data between 1994 and 1995, by setting the mean from 1970-1994 at 5.04 (which is the historical mean number of basin hurricanes for this period) and the mean from 1995-2005 at 8.45 (likewise). 4 of these 10,000 realisations are shown in figure 2 (black lines). We then test whether we can detect the change-point by analysing each 36-year surrogate series individually. At the p=0.01 level we find that we detect the change-point in 8,427 of our 10,000 cases (i.e. 84% of the time). In the rest of the cases the change-point is obscured by the noise and we can’t detect it even though we know it’s there because we put it there ourselves.
Second, we derive 10,000 realisations of surrogate data for the number of landfalling hurricanes for the same period. We derive the landfalling numbers from the simulated basin data by applying probabilities that each basin simulated hurricane will make landfall. The probabilities we use are estimated separately from the observations for the two periods prior to and post 1994/1995, and are and . Combining the mean hurricane numbers for the basin with the probabilities of making landfall, we see that the mean numbers of landfalling hurricanes on either side of the change-point (in reality and in our simulations) are 1.24 and 2.27. The fact that there is a slightly higher probability of making landfall in the second period will increase the average number of landfalling hurricanes in the second period, relative to a situation in which we had used a single probability estimated on data from 1970-2005. This will make it easier to detect the landfalling change-point. 4 of the 10,000 realisations of landfalling hurricane numbers are shown in figure 2 (grey lines), alongside the corresponding basin simulation. Once again we test each of our 10,000 realisations to see if we can detect the change-point. However, in this case we only detect the change-point in 3660 of our 10,000 tests (i.e. 37%) of the time. In the rest of the cases we are again in the situation where we can’t detect it even though we know it’s there.
In other words, even though there is a large change-point built-in to the surrogate landfall data (corresponding to an increase of 83% in the mean) it is hidden by noise in most of our realisations.
Finally, we compare the distribution of p-values derived from the statistical tests on the simulations with the p-values from the statistical tests on the historical data. The basin p-value for the real data is at the 49th percentile of the simulated distribution of basin p-values, and the landfall p-value for the real data is at the 46th percentile of the simulated distribution of the landfalling p-values. We conclude that both the historical p-values are entirely consistent with the simulations.
3 Conclusions
We have asked the question: why is it possible to detect change-points in the time series of the number of hurricanes in the Atlantic basin, but not possible to detect change-points in the time series of the number of hurricanes at US landfall? To simplify matters we have considered only the most recent change-point, which occurred between the years 1994 and 1995. Using Monte-Carlo simulations we have shown that although one would expect to be able to detect a change-point of the same magnitude as the observed 1994/1995 change-point most of the time in the basin data, one would not expect to be able to detect the impact of this change-point in the landfall data, for the simple statistical reason that the change disappears in the noise. We thus conclude that, although there may be other things going on that also conspire to hide the change-points in the landfalling time-series, one doesn’t need to invoke anything other than simple statistics to explain the apparent lack of change-points in this series. Or, to put it another way, one cannot conclude from the lack of detectable change-points in the landfall series that this series isn’t changing. Quite significant changes could have occurred, and yet still not be detectable, because of the low number of hurricanes making landfall, and the implied signal to noise ratio. Figure 3 illustrates this by showing the probability of detecting the 1994/1995 change-point in the landfalling series, versus the level of hurricane activity from 1995-2005. To reach a 50% chance of detecting a change-point in the landfalling data, the annual landfalling hurricane rate after 1995 would have had to have been over 2.5 hurricanes per year (over a 100% increase relative to 1970-1994). To reach a 90% chance of detecting a change-point the average landfalling hurricane rate after 1995 would have to have been at around 3.5 hurricanes per year (nearly a 200% increase).
Overall the disappearance of change-points at landfall occurs because when we reduce the number of hurricanes by a factor of 4 (as we do going from basin to landfall) the size of any change-points reduces by a factor of 4, but the standard deviation of the poisson distribution only reduces by a factor of 2 (this is a property of the poisson distribution). The signal-to-noise ratio thus decreases by a factor of 2, making change-points twice as hard to detect in the landfalling data as they are in the basin data.
4 Appendix
We now describe the details of our statistical test, which is due to Przyborowski and Wilenski (1940).
The number of basin hurricanes in year t, NB,t, is assumed to follow a poisson distribution with rate . Conditional on a given number of basin hurricanes NB,t = nB,t we then model the number making landfall NL,t as following a binomial distribution with probability p, so that
It is then easy to show that the number at landfall is then also given by a poisson distribution with rate p.
We assume that there is a change in the value of in 1994/1995 and that it takes one constant value between 1970 and 1994, and then another constant value between 1995 and 2005.
We estimate by the sample mean , and we estimate the conversion rate pi of basin to landfalling hurricanes in period i to be the proportion N/N where N and N are the numbers of landfalling and basin hurricanes in period i.
4.1 Hypothesis Tests
We consider the two variables
| (1) |
which are the total numbers of basin and landfalling hurricanes in period i. These variables are themselves also poisson variables with
| (2) |
We wish to test the hypothesis
| (3) |
The conditional test (C-test) (due to Przyborowski and Wilenski (1940)) is based on the fact that the conditional distribution of given is binomial
with probability
We reject at the level if
| (4) |
Here we wish to test for the ratio , so .
We test the numbers of landfalling hurricanes in the same way.
References
- Elsner et al. (2000) J Elsner, T Jagger, and X Niu. Changes in the rates of North Atlantic major hurricane activity during the 20th Century. Geophysical Research Letters, 27:1743–1746, 2000.
- Elsner et al. (2003) J Elsner, X Niu, and T Jagger. Detecting Shifts in hurricane rates using a Markov Chain Monte Carlo appproach. Journal of Climate, 17:2652–2666, 2003.
- Goldenberg et al. (2001) S Goldenberg, C Landsea, A Mestas-Nunez, and W Gray. The recent increase in Atlantic hurricane activity: causes and implications. Science, 293:474–479, 2001.
- Jarvinen et al. (1984) B Jarvinen, C Neumann, and M Davis. A tropical cyclone data tape for the North Atlantic Basin, 1886-1983: Contents, limitations, and uses. Technical report, NOAA Technical Memorandum NWS NHC 22, 1984.
- Jewson and Penzer (2006a) S Jewson and J Penzer. An objective change point analysis of historical Atlantic hurricane numbers. arXiv:physics/0611071, 2006a. RMS Internal Report E02a.
- Jewson and Penzer (2006b) S Jewson and J Penzer. An objective change point analysis of landfalling historical Atlantic hurricane numbers. arXiv:physics/0611086, 2006b. RMS Internal Report E02b.
- Przyborowski and Wilenski (1940) J Przyborowski and H Wilenski. Homogeneity of results in testing samples from poisson series. Biometrika, 31:313–323, 1940.