87Sr lattice clock with inaccuracy below 10-15
Abstract
Aided by ultra-high resolution spectroscopy, the overall systematic uncertainty of the - clock resonance for lattice-confined 87Sr has been characterized to . This uncertainty is at a level similar to the Cs-fountain primary standard, while the potential stability for the lattice clocks exceeds that of Cs. The absolute frequency of the clock transition has been measured to be 429,228,004,229,874.0(1.1) Hz, where the fractional uncertainty represents the most accurate measurement of a neutral-atom-based optical transition frequency to date.
pacs:
42.62.Eh; 32.80.-t; 32.80.Qk; 42.62.FiThe significant advances in femtosecond comb technology Diddams1 ; Udem ; Ye1 in the past decade have sparked immense interest in atomic clocks based on optical transitions Diddams2 . These transitions have large line quality factors () Boyd1 ; Bergquist1 , which will provide orders of magnitude improvement in clock stability over state-of-the-art microwave clocks. An optical clock based on a single trapped Hg+ ion has recently surpassed Cs fountain clocks SyrteCs ; NISTCs in terms of accuracy, with clock systematics reduced to Bergquist2 . Other high accuracy ion standards include Sr+ NPLScience ; NRC and Yb+ PTBYb . The high line allows a stability comparable to the best achieved thus far with Cs, despite the fact that the single-ion signal-to-noise ratio () is drastically reduced compared to microwave systems which typically employ atoms. Optical lattice clocks show promise for reaching a level of accuracy comparable to the ion systems, with significantly improved stability due to the large number of atoms involved in the measurement. This stability gain has spurred an intensive investigation of lattice clocks based on spin-forbidden transitions in alkaline-earth atoms, specifically in Sr Boyd1 ; Katori1 ; KatoriNature ; Ludlow1 ; LeTargat1 and Yb Fortson1 ; NistYb , where the trapping potential is designed to allow accurate measurements effectively free of both ac Stark shifts Katori1 ; Katori2 ; Anders1 and motional effects which can hamper optical clocks based on atoms in free space SterrNew ; OatesNew ; Ido1 .
While the clock-stability benefits provided by the optical lattice method are now clear NistYb ; Boyd1 , reaching the accuracy level of the microwave standards remains a paramount issue in the field. Recently, great strides towards this goal have been taken, as a troublesome 4 disagreement between the first two high accuracy experiments using 87Sr KatoriNature ; Ludlow1 has been resolved by a third independent investigation LeTargat1 , and a revised report by the authors of Ref. KatoriNature published shortly thereafter KatoriJSP . Agreement between the three groups speaks strongly for the lattice clock as a future candidate for redefinition of the SI second; however, to be competitive with the current Cs fountain clocks the overall systematics must be reduced well below the level.
In this Letter, we report a detailed study of the systematic uncertainty associated with the 87Sr - clock transition frequency at the level of . This measurement, aided mainly by the record level line achieved recently Boyd1 , shows that the Sr lattice clock can reach an accuracy level competitive with Cs fountains, while the potential stability for the system is far greater. An absolute frequency measurement of the transition is also reported with an uncertainty of , limited by a Cs-calibrated NIST H-maser reference.
Full details of the cooling and trapping system used in this work are discussed elsewhere Loftus1 ; Ludlow1 . In brief, 87Sr atoms are captured from a thermal beam into a magneto-optical trap (MOT) based on the - cycling transition. Second stage cooling, using a dual frequency - MOT Mukaiyama1 , is performed concurrently with the loading of a vertical one-dimensional lattice, yielding 2 atoms at a temperature of 1.5 K. The lattice is operated at the Stark cancelation wavelength Anders1 with an intensity = 5 kW/cm2 (83 of which forms the standing wave due to window losses), resulting in measured longitudinal and radial trap frequencies of 40 kHz and 125 Hz respectively. The atoms are distributed over 80 lattice sites with a density = cm-3. The spectroscopy sequence for the 1 mHz - clock transition begins with a Rabi pulse from a highly stabilized diode laser Ludlow2 that is co-propagated and co-polarized with the lattice laser. With some atoms shelved in the state, the remaining population is removed from the lattice by exciting the - transition. The atoms are then driven back to the ground state, by pumping through intermediate states, and the population is measured by again driving the - transition and detecting scattered photons. This process is repeated each time atoms are loaded into the lattice, as the laser frequency is tuned. The time window for the Rabi pulse is varied within 40-480 ms depending on the desired Fourier width (22-1.8 Hz).
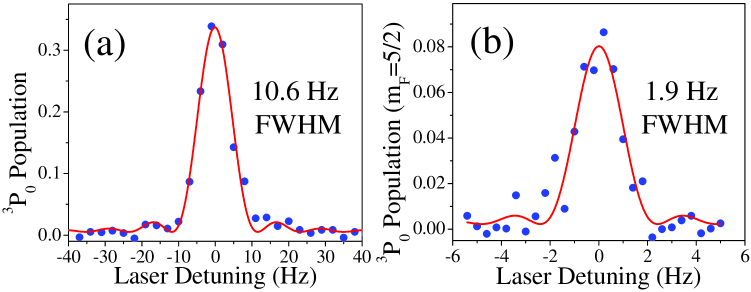
The (=9/2) - (=9/2) transition, facilitated by nuclear-spin induced state mixing Kluge1 , suffers from a differential Landé -factor between the clock states, with the sensitivity being 60 larger than that of the ground state. The resultant Zeeman shift of -109 Hz/(G ) Boyd1 (1 G = T) can be a limitation in terms of the achievable accuracy and line in the presence of magnetic fields. Figure 1(a) shows a spectrum for a 80 ms probe time, representing the parameters typically used in the work reported here, yielding a FWHM (full width at half maximum) linewidth of 10.6(3) Hz. The spectrum shown here supports a clock instability of less than at 1 s. For atom-shot-noise limited spectra of the same width, and reasonable improvements to the duty cycle, the number could be reduced by more than an order of magnitude. The narrowest resonances have so far been achieved when a resolved nuclear sublevel is used for spectroscopy as shown in Fig. 1(b). Here, linewidth limitations from magnetic fields or state-dependent Stark shifts are eliminated, and widths below 2 Hz are repeatably observed.
As a general approach for evaluating systematics, an interleaved scheme is used where the parameter of interest is cycled through different values, synchronized with each frequency step of the probe laser across the resonance. The interleaved data is then separated into resonance profiles for each parameter value, allowing the center frequency (relative to the laser cavity), and more importantly the slope of the frequency shift, to be measured for a variety of system parameters in a short time. This method allows us to measure shifts against the probe laser, which has a stability superior to our available microwave reference Ludlow2 .
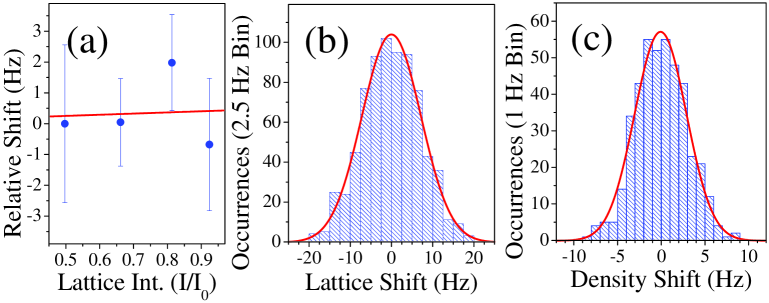
Of the many effects to be characterized for an optical lattice clock, the effect of the lattice laser itself remains a focal point. The differential light shifts of the clock states due to the scalar, vector, and tensor polarizabilities all vary linearly with trap intensity and can be strongly suppressed with an appropriate choice of lattice wavelength Katori2 ; Fortson1 . Higher-order Stark shifts, due to the hyperpolarizability of the clock states, are negligibly small ()Anders1 at our operating intensity and wavelength. Hence, a linear extrapolation to the zero-intensity clock frequency is sufficient to characterize the total Stark shift from all contributors mentioned above. An example of this is shown in Fig. 2(a) where four different values of the lattice intensity are interleaved during a trace taking less than one minute. Using 2, 4, or 8 lattice intensity values, 776 interleaved measurements revealed that for a wavelength = 813.4280(5) nm, the Stark shift is -108(257) mHz/. A summary of the lattice Stark shift measurements is shown in Fig 2(b) as a histogram, along with a gaussian fit of the data.
The effect of atomic density on the transition frequency is explored in a similar fashion as densities ranging within (0.2-1) are interleaved (by varying the number of atoms in the MOT). A histogram of 422 measurements of the density effect is shown in Fig. 2(c), resulting in a shift coefficient of 3(140) mHz/. Notably the upper limit of the density-related fractional frequency shift of cm-3 is times smaller than for Cs NISTCs ; SyrteCs .
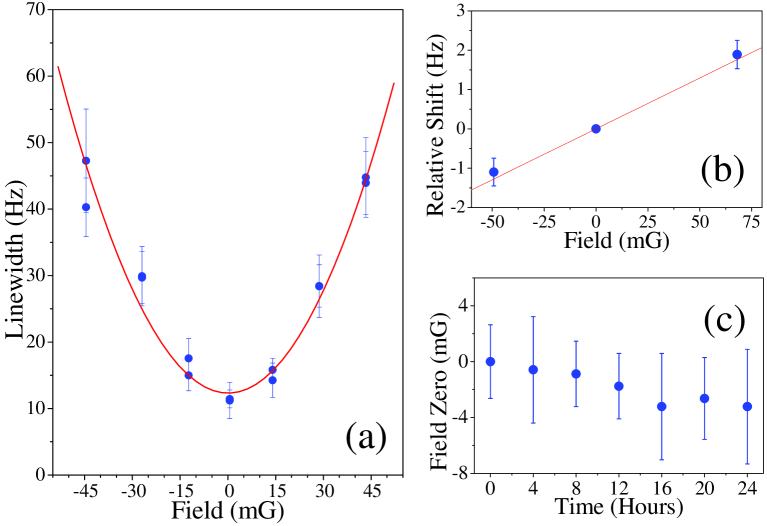
The ten nuclear-spin sublevels of the clock transition result in systematic effects related to magnetic and optical fields. For example, the asymmetric distribution of population among the sublevels can be a central systematic issue when using unpolarized atomic samples, as any -dependent magnetic or optical interaction can cause a frequency shift, even if the sub-levels are shifted symmetrically about the center. The differential -factor of the clock states provides the most significant effect as it leads to a sensitivity to magnetic fields of nearly 500 Hz/G for the stretched states. Three orthogonal sets of Helmholtz coils are used to characterize frequency shifts caused by the Zeeman sensitivity of the nuclear-spin sublevels. Figure 3 summarizes the characterization of magnetic field effects along one of these three axes. For each direction, the transition linewidth is used to find the field minimum as shown in Fig. 3(a). The narrow 10 Hz resonances allow the field zero to be constrained within 10 mG for each axis. Frequency shift sensitivity is explored using the interleaved scheme with the results for the featured axis shown in Fig. 3(b). Here the average values for 112 measurements are shown, yielding a slope of 26(4) Hz/G. Similar measurements were performed for the other two axes yielding 22(7) Hz/G and 12(3) Hz/G. The fields for the three axes are zeroed below 5, 5, and 10 mG respectively, resulting in a total Zeeman uncertainty of . This gives insight into the minimal effect of the vector light shift which causes symmetric -dependent shifts proportional to the degree of lattice ellipticity and trapping intensity Fortson1 ; Katori2 . The resultant splitting for the stretched states is estimated as less than 8 (Hz/rad)/. To combat this effect, a high extinction polarizer () is used for the lattice and probe beam, and while the vacuum chamber windows likely reduce the purity of the linear polarization, rotations of even a few degrees are equivalent to a sub mG residual field, attesting to the insignificance of this effect compared to the differential -factor.
Systematics related to the probe laser were considered in two respects. First, the probe can cause Stark shifts of the clock states by coupling to external levels. Second, asymmetric motional sidebands could cause line pulling. This effect is minimal as the sidebands are well resolved (even the radial sidebands are detuned by more than ten times the transition width) and are only observed for large probe intensities. These effects were checked experimentally by varying the probe power by more than an order of magnitude during 77 measurements. To eliminate Stark shifts from other sources, all lasers used for cooling, trapping, and detection are switched with both acousto-optic modulators and mechanical shutters. Shifts from black body radiation (BBR) are also considered DerevBBR , including the effect of a nearby heated vacuum window.
Table I summarizes the dominant systematic uncertainties for spectroscopy of the clock transition, reported in terms of fractional frequency. A total uncertainty of is achieved, representing the first experimental verification that the lattice technique can reach inaccuracies below the level, comparable with Cs fountains. The largest uncertainties are limited by technical issues such as a small dynamic range on the lattice intensity and sensitivity to stray magnetic fields. Future work using isolated spin states should allow orders of magnitude reduction in the nuclear-spin related shifts, while significant reductions in the lattice shift uncertainty can be achieved using a larger range of intensities. Spin-polarizing the atoms can also minimize collision shifts via Fermi suppression. However, unless the spin polarization is pure and all atoms are in a single motional state of the trap (possible but not yet achieved in a lattice clock), the collision shift must still be evaluated experimentally.
| Contributor | Correction () | Uncertainty () |
|---|---|---|
| AC Stark (Lattice) | ||
| AC Stark (Probe) | ||
| AC Stark (BBR) | ||
| Zeeman Effect | ||
| Density Shift | ||
| Total |
To measure the absolute frequency of the - transition, a Cs-fountain-calibrated H-maser is used to stabilize a radio frequency synthesizer located at NIST. The synthesizer modulates the amplitude of a 1320 nm laser, which is transferred to JILA via a 4 km fiber link ye03 ; Foreman06 . The modulation frequency of 950 MHz is compared to the repetition rate of a femtosecond frequency comb locked to the spectroscopy laser. The maser and transfer system provide a 1 s instability of , and for the work reported here, the maser is calibrated to . Passive transfer using the fiber link has been found to introduce frequency offsets as large as , specifically related to periodic stretching and compressing of the fiber length owing to daily temperature variations. To eliminate this effect, the fiber length is stabilized using a fiber stretcher controlled by comparison of the local microwave phase at NIST with that of modulated light reflected back from JILA. While in-loop measurements show the frequency transfer is stabilized to a few parts in , we assign a conservative uncertainty of to account for other potential errors FrenchFiber . The reference synthesizer for the transfer can also cause frequency errors Diddams3 as drifts in the synthesizer’s temperature result in fractional shifts at the level of (K/Hour)-1. For the measurements reported here, the synthesizer is placed in a temperature stabilized enclosure and the temperature inside and outside the enclosure is monitored, resulting in a correction of .
| Contributor | Correction () | Uncertainty () |
|---|---|---|
| Sr Syst. (Table I) | ||
| Maser Calibration | ||
| Synth. Temp. Drift | ||
| Fiber Transfer | ||
| Gravitational shift | ||
| Freq. Meas. Syst. | ||
| Freq. Meas. Stat. | ||
| Total | ||
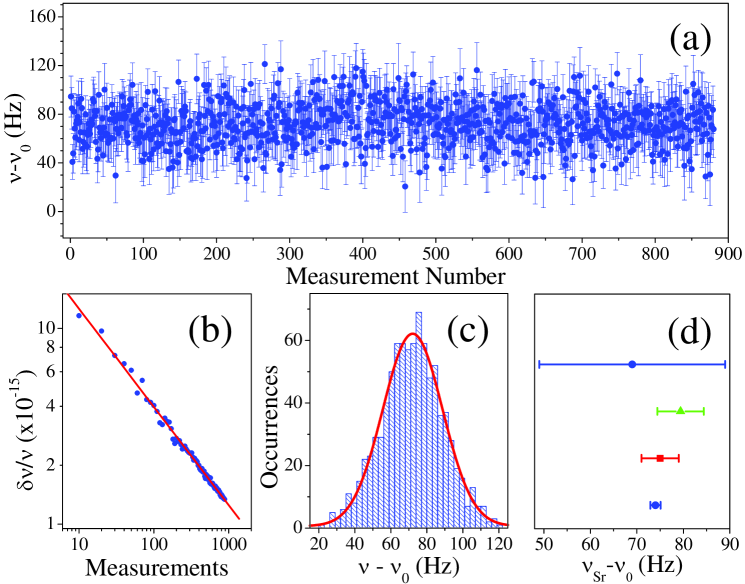
A summary of 880 absolute frequency measurements spanning a full 24 hour period is shown in Fig. 4(a). Each point corresponds to a 30 second measurement of an 11 Hz spectrum with a frequency uncertainty of 20 Hz, consistent with the Allan deviation of the H-Maser. The data averages down with gaussian statistics, as shown in Fig. 4(b) and in the histogram of Fig. 4(c). During the measurement, the Sr chamber temperature was continuously monitored, and the magnetic field was repeatedly calibrated (Fig. 3(c)) both by monitoring transition linewidths and by employing the zeroing technique in Fig. 3(a). Table II summarizes the relevant corrections and uncertainties associated with the absolute frequency measurement. The only significant corrections not determined by direct frequency measurements here are the BBR shift and the gravitational shift arising from the difference in elevation of the NIST Cs fountain and the JILA Sr lattice. The frequency of the - transition is 429,228,004,229,874.0(1.1) Hz, with the uncertainty mainly limited by the maser calibration. Figure 4(d) shows that this value agrees well with recent reports from the SYRTE LeTargat1 and Tokyo KatoriJSP groups as well as with our original value Ludlow1 . The final absolute frequency uncertainty of 2.5 corresponds to the most accurate optical frequency measurement for neutral atoms to date, and falls short of only the recent Hg+ ion result Bergquist2 as the most accurate optical measurement in any system.
We gratefully acknowledge technical contributions by S. Diddams and T. Parker on maser transfer. We also thank D. Hudson and M. Ting for help with the fiber link. This work was supported by ONR, NIST, and NSF.
Current address for T. Ido: NICT, Tokyo, Japan.
References
- (1) S. A. Diddams et al., Phys. Rev. Lett. 84, 005102 (2000).
- (2) Th. Udem et al., Nature 416, 233 (2002).
- (3) See for example: Femtosecond Optical Frequency Comb: Principle, Operation and Applications J. Ye and S. T. Cundiff ed., Springer, (2004).
- (4) S. A. Diddams et al., Science 306, 1318 (2004).
- (5) M. M. Boyd et al., Science in press (2006).
- (6) R. J. Rafac et al., Phys. Rev. Lett. 85, 2462 (2000).
- (7) S. Bize et al., J. Phys. B 38, S449 (2005).
- (8) T. P. Heavner et al., Metrologia 42, 411 (2005).
- (9) W. H. Oskay et al., Phys. Rev. Lett. 97, 020801 (2006).
- (10) H. S. Margolis et al., Science 306, 1355 (2004).
- (11) P. Dubé et al., Phys. Rev. Lett. 95, 033001 (2005).
- (12) T. Schneider et al., Phys. Rev. Lett. 94, 230801 (2005).
- (13) H. Katori et al., Phys. Rev. Lett. 91, 173005 (2003).
- (14) M. Takamoto et al., Nature 435, 321 (2005).
- (15) A. D. Ludlow et al., Phys. Rev. Lett. 96, 033003 (2006).
- (16) R. Le Targat et al., Phys. Rev. Lett. 97, 130801 (2006).
- (17) S. G. Porsev et al., Phys. Rev. A 69, 021403(R) (2004).
- (18) Z. W. Barber et al., Phys. Rev. Lett. 96, 083002 (2006).
- (19) V. Ovsiannikov et al., Quantum Electron. 36, 3 (2006).
- (20) A. Brusch et al., Phys. Rev. Lett. 96, 103003 (2006).
- (21) C. Degenhardt et al., Phys. Rev. A 72, 062111 (2005).
- (22) G. Wilpers et al., Appl. Phys. B 85, 31 (2006).
- (23) T. Ido et al., Phys. Rev. Lett. 94, 153001 (2005).
- (24) M. Takamoto et al., J. Phys. Soc. Japan 75, 10 (2006).
- (25) T. H. Loftus et al., Phys. Rev. A 70, 063413 (2004).
- (26) T. Mukaiyama et al., Phys. Rev. Lett. 90, 113002 (2003).
- (27) A. D. Ludlow et al., arxiv-physics/0610274 (2006).
- (28) H. J. Kluge and H. Sauter, Z. Physik 270, 295 (1974).
- (29) S. G. Porsev and A. Derevianko, Phys. Rev. A 74, 020502 (2006).
- (30) J. Ye et al., J. Opt. Soc. Am. B 20, 1459 (2003).
- (31) S. M. Foreman et al., Rev. Sci. Instr., in press (2006).
- (32) F. Narbonneau et al., Rev. Sci. Instr. 77, 064701 (2006).
- (33) J. E. Stalnaker et al., in Proceedings of the Int. Freq. Cont. Symp. Miami, USA, June 5-7 (2006).