Self consistent determination of plasmonic resonances in ternary nanocomposites
Abstract
We have developed a self consistent technique to predict the behavior of plasmon resonances in multi-component systems as a function of wavelength. This approach, based on the tight lower bounds of the Bergman-Milton formulation, is able to predict experimental optical data, including the positions, shifts and shapes of plasmonic peaks in ternary nanocomposites without using any fitting parameters. Our approach is based on viewing the mixing of 3 components as the mixing of 2 binary mixtures, each in the same host. We obtained excellent predictions of the experimental optical behavior for mixtures of Ag:Cu:SiO and alloys of Au-Cu:SiO and Ag-Au:HO, suggesting that the essential physics of plasmonic behavior is captured by this approach.
Accurate control and prediction of plasmonic behavior in metal nanoparticles in various configurations are expected to realize future ultra-high density integrated photonic devices (Koehl and Paniccia, 2005). For example, plasmonic effects in metal nanoparticle waveguide arrays and metal-dielectric interfaces have been used to transport electromagnetic energy below diffraction limited dimensions (Karalis et al., 2005; Maier et al., 2003a, b; Krenn et al., 1999; Quinten et al., 1998). Glasses containing metal nanoparticles exhibit intensity dependent refractive index values several orders of magnitude greater than that of silica glass due to dielectric and quantum confinement effects (S. Schmitt-Rink et al., 1987). These enhanced effects, occurring due to surface plasmon effects at the interface of the metal and the dielectric, could allow various use of linear and nonlinear optical responses of mixtures (Lopez et al., 2004; L. Yang et al., 1996; W. T. Wang et al., 2003), provided appropriate materials are selected (Garcia et al., 2006). Experimental observations have also demonstrated that composites containing multiple metals show multiple plasmonic peaks as well as dependence of such peaks on metal fraction (R. H. Magruder III et al., 1994; G. Battaglin et al., 2000). Therefore, the large optical nonlinearities, the waveguiding capability and multiple-wavelength sensitivity offered by plasmon behavior makes it an important area of study with potential applications to optoelectronics, sensing, etc. In this Letter, we develop and demonstrate a self consistent technique to accurately predict the effective dielectric constant of multi-component systems and apply it to ternary nanocomposites for which reliable experimental data are available (R. H. Magruder III et al., 1994; G. Battaglin et al., 2000; M. Moskovits et al., 2002).
The accurate prediction of the optical properties of nanocomposites made from multiple optical materials is an outstanding problem in current research. This is primarily because the effective permittivity is not uniquely determined by the optical properties of the individual components but also requires knowledge of the composite microstructure (Bergman, 1980; G. W. Milton, 1981). Previous theoretical work in this area has focused primarily on estimating the effective permittivity of two-component mixtures where one of the components is a dielectric and the other is a metal (A. Sihvola, 1999). There are numerous models that predict the effective permittivity of two component composites (J. C. M. Garnett, 1904; D. A. G. Bruggeman, 1935; W.E. Kohler and G.C. Papanicolaou, 1981). Moreover, there are already established rigorous bound for the values of the permittivity in such composites (Z. Hashin and S. Shtrikman, 1962; D. J. Bergman, 1981; G. W. Milton, 1981). However, these models have not been extended to or applied towards interpreting the behavior of multi-metal composites and typically multi-parameter fitting routines have been used to reproduce experimental data (Anderson et al., 1998; M. Moskovits et al., 2002). But such fitting approaches are of limited use in predicting the fundamental behavior of unexplored nanocomposite systems and hence, are not generally applicable tools for new product design. Recently it was shown that the problem of calculating the bounds for a multicomponent system can be reduced to the determination of the convex-hull generated in the complex plane when the volume fraction of each component act as a barycentric coordinate for the hull (K. Peiponen and E. Gornov, 2006). One of the limitations of this approach is that it can be used only for obtaining the loosest bounds which are the Wiener bounds (O. Wiener, 1912). These loose bounds cannot predict the location of the plasmon resonances in frequency space for a simple two component system. This is because the resonance enhancement of the absorption takes place at and is in contradiction to the well known condition for the resonance at , where is the volume fraction of the metal, is the dielectric permittivity of the host and is the real part of the dielectric permittivity of the metal or inclusion.
Here we report a self consistent technique that accurately predicts the plasmonic behavior, including peak positions, shifts and shapes, in multi-metal mixtures and/or alloy nanocomposites without the need for any fitting parameters. Our approach begins with the fact that for a two component nanocomposite the tightest lower bound on the dielectric permittivity can be expressed through the Bergman-Milton formula (Bergman, 1980; G. W. Milton, 1981), (which is based on restricting the values of the effective dielectric permittivity in the complex plane using suitably defined conformal mappings) as:
| (1) |
where and denote the volume fractions of the constituent materials with relative permittivity and respectively, and . The parameter takes the values . In this work we use because it corresponds to the exact Maxwell Garnett mixing rule (Garnett, 1904). The upper bound corresponds to the complementary mixture and is not of interest to us.
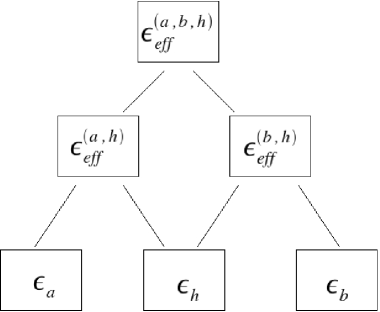
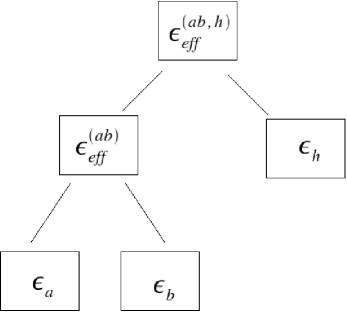
The central idea of this paper is to use Eq. 1 in a self consistent fashion within the effective medium approximation to calculate the effective permittivity of a three component or ternary nanocomposite. We begin with the hypothesis that a three component system formed by , and the host can be viewed as a mixture of two components, each having an effective permittivity and calculated using Eq. 1. In this mixing process the average electric field within the composite is held fixed at every stage of mixing. The constraint in the volume fraction is introduced while calculating the individual effective permittivities while the final effective permittivity is calculated using equal volumes of each mixture. Moreover, notice that , which represents the dielectric permittivity of the host matrix, is common to both mixtures. This simple binary mixing rule, depicted graphically in Fig. 1, can be stated as follows: the effective permittivity of an N-component mixture can be determined by mixing N-1 binary mixtures, each comprising of a host and a distinct metal, with the host being common to the N-1 pairs. In this Letter we focus on applying this mixing rule to ternary systems for which experimental data exists.
In order to test the validity of our hypothesis we have calculated the optical absorption coefficient of ternary composites containing multi-metal and/or alloy nanocomposites using experimental data for the individual permittivities of the metals obtained from ref. Sop, . The binary mixing rule was applied to the formation of nanocomposites made from mixtures of two metals, as shown in Fig. 1(a), and for alloys, as shown in Fig. 1(b). We also introduced a modification to the imaginary component of the permittivity of each metal in order to account for the enhanced rate of electron scattering due to particle size-dependent effects by modifying the Drude model (Ashcroft and Mermin, 1976). This was accomplished by expressing the imaginary component in the high frequency limit as follows:
| (2) |
where is the bulk plasmon resonance frequency of the metal, and is an effective relaxation time given by:
| (3) |
where is the bulk relaxation time of the electron, is the speed of the electrons close to the Fermi surface, and is the nanoparticle diameter. The second term in Eq. 3 takes into account the collision rate of the electron with the metal walls for spherically shaped particles.
In order to compare our predictions to previous experimental measurements, we identified multi-metal composites for which experimental observations of the plasmonic behavior are available including the three parameters required for the calculations, namely: (i) the average metal particle size; (ii) the length of the sample which determines the absorption, and (iii) the composition of the metal particles. Based on this, we compared theoretical predictions with the experiments of Magruder and co-workers on Ag and Cu mixtures in SiO (R. H. Magruder III et al., 1994), by Battaglin and co-workers on Au-Cu alloys in SiO (G. Battaglin et al., 2000) and by Moskovits and co-workers on colloidal solutions of Au-Ag alloy nanoparticles in HO (M. Moskovits et al., 2002). In our calculations, the optical absorption in a silica glass or water matrix was estimated in terms of the optical density given by , where is the absorption coefficient of the final mixture given by , where is the dielectric constant of the medium (corrected for addition of the nanoparticles), is the incident wavelength and and l is the length of the sample.
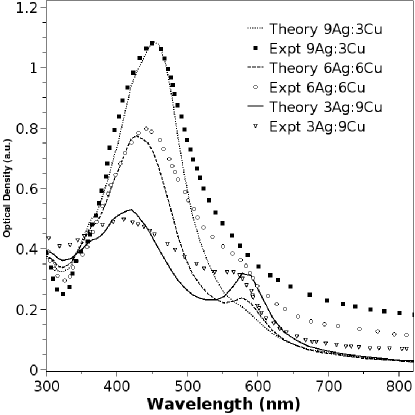
Magruder et al. (R. H. Magruder III et al., 1994) measured the behavior of the plasmonic peaks as a function of the volume fractions of the individual metals in a composite of Ag and Cu in SiO. Here, the various ratios of the metal ions were achieved by sequential ion implantation. The resulting composites had particles with a mean size of d = 30 nm for Ag and Cu in ratios of 9:3, 6:6, and 3:9 respectively. The central observations were that: (i) a dominant peak, attributed to Ag, shifts from ~410 nm to 440 nm as the Ag concentration was increased; and (ii) a second weak peak near ~575 nm appeared as the Cu concentration increased. Using the above values for the particle diameter and individual metal concentrations along with the experimental values for and for Cu and Ag we calculated the effective permittivity using the mixing rule developed above and estimated the plasmonic behavior of this system. Fig. 2 compares the experimental data extracted from ref. (R. H. Magruder III et al., 1994) (symbols) with the results of our predictions (lines). The theory, without the use of any fitting parameters, predicts the position of the plasmon peaks as well as the shift occurring due to change in Ag concentration. Our calculations predicted a shift from 417 nm to 452 nm with increasing Ag concentration. The calculation also accurately captured the appearance of the second peak at 572 nm with increasing Cu concentration. Moreover, the widths of the individual peaks, which is extremely sensitive to particle size, were fairly well represented by our model. The peak widths were a consequence of the correction introduced to the electron scattering time based on the particle size.
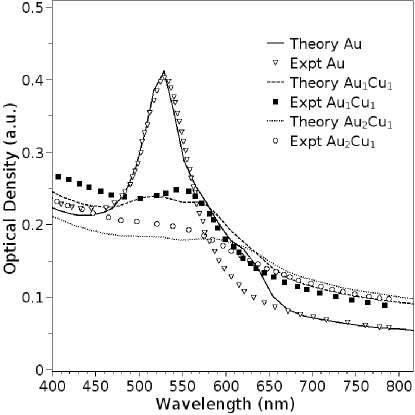
In Fig. 3 we compare model predictions with the data of Battaglin et al. (G. Battaglin et al., 2000) in which the plasmonic behavior was studied as a function of alloy concentration and particle size for Au-Cu alloys in SiO. Equal ratios of Au and Cu were implanted and then subjected to different annealing conditions. The as-deposited sample contained an alloy with AuCu composition (with the remaining Cu in atomic state) and average particle size of . The sample annealed in H had a AuCu1 alloy with an average particle size of while the sample annealed in air contained primarily Au nanoparticles of diameter, with the Cu preferentially found as an oxide in the near surface of the samples. For the theoretical calculations we first created the appropriate alloys using the mixing rule (depicted in Fig. 1(b)) and then the final composite based on the volume fraction of the alloy and the experimentally assigned particle diameters. The results are shown in Fig. 3, with experimental data as symbols and theory as lines. Once again the theory accurately predicts the peak positions and shift for this alloy system without the need for any fitting parameters.
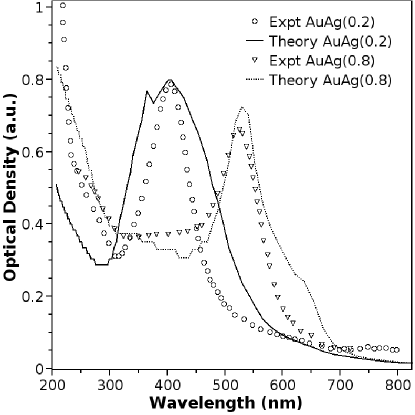
In Fig. 4 we compare the theoretically predicted and experimentally observed behavior of colloidal solutions containing Au-Ag core-shell nanoparticle alloys of various compositions in a water matrix, as measured by Moskovits and co-workers (M. Moskovits et al., 2002). Their primary conclusions were: (i) a single plasmon peak appeared for the core-shell structures and this peak shifted with changing Au-Ag concentration. This behavior was attributed to the formation of an alloy in the shell whose composition changed with varying Au-Ag fraction; and (ii) the trend could be fitted by applying a multi-parameter fitting routine to obtain the best fit based on summation of Lorentzian peaks. We applied our mixing rule to first create the appropriate alloy (Fig. 1(b)) with the particle diameters taken from (M. Moskovits et al., 2002). The resulting theoretical behavior is shown as lines in Fig. 4. The theory again predicted quite well the shift in the position of the plasmon peak with varying alloy composition.
In conclusion, we have developed a self consistent technique to determine/predict the effective permittivity of ternary composites containing mixtures and/or alloy nanocomposites using the Milton-Bergman lower bound expression for two component composites. We have successfully tested our theory against previously studied experimental systems comprising mixtures of multi-metal nanoparticles and/or alloys of Ag:Au:SiO, Ag-Cu:SiO, and Au-Cu:HO. This approach predicts quite accurately the peak position and shift of plasmonic behavior in these mixtures and alloys by utilizing experimentally available optical parameters (Sop, ) and without the need for any fitting. This result clearly indicates that our mixing approach captures the essential physics of plasmonic behavior in these multi-component systems. This calculation can readily be extended for nanocomposites with more than three components. However, at this point, no experimental data exists to validate the calculations for such systems. In addition, the shape of the plasmon peaks could also be fairly well reproduced by utilizing a simple correction to the relaxation time of the electrons that accounts for the enhanced scattering at the metal boundary as the particle size is reduced. This model allows for further corrections due to quantum confinement effects as the particle size gets reduced below the 10 nm size scale (Halperin, 1986). This approach could be of great value towards predicting optical properties in terms of plasmonic behavior as a function of volume fraction, particle size and alloy composition in multi-component mixtures and could guide the assembly of nanocomposites with tailored optical properties (fav, ; Bozhevolnyi and Shalaev, 2006).
RK and RS acknowledge support by the National Science Foundation through grants # DMI-0449258 and # CTS-0335348 respectively.
References
- Koehl and Paniccia (2005) S. Koehl and M. Paniccia, Photonics Spectra 39, 53 (2005).
- Karalis et al. (2005) A. Karalis, E. Lidorikis, M. Ibanescu, J. D. Joannopoulos, and M. Soljacic, Phys. Rev. Lett. 95, 063901 (2005).
- Maier et al. (2003a) S. A. Maier, P. G. Kik, and H. A. Atwater, Phys. Rev. B 67 (2003a).
- Maier et al. (2003b) S. Maier, P. Kik, H. Atwater, S. Meltzer, E. Harel, B. Koel, and A. Requicha, Nature Materials 2, 229 (2003b).
- Krenn et al. (1999) J. Krenn, J. C. Weeber, A. Dereux, B. Schider, A. Leitner, F. R. Aussenegg, and C. Girard, Phys. Rev. B 60, 5029 (1999).
- Quinten et al. (1998) M. Quinten, A. Leitner, J. Krenn, and F. Aussenegg, Optics Lett. 23, 1331 (1998).
- S. Schmitt-Rink et al. (1987) S. Schmitt-Rink, D. A. Miller, and D. S. Chemla, Phys. Rev. B 35, 8113 (1987).
- Lopez et al. (2004) R. Lopez, R. J. Haglund, L. Feldman, L. Boatner, and T. Haynes, Appl. Phys. Lett. 85, 5191 (2004).
- L. Yang et al. (1996) L. Yang, D. H. Osborne, J. R. F. Haglund, R. H. Magruder, C. W. White, R. A. Zuhr, and H. Hosono, Appl. Phys. A.: Mater. Sci. Process 62, 403 (1996).
- W. T. Wang et al. (2003) W. T. Wang, Z. H. Chen, G. Yang, D. Y. Guan, G. Z. Yang, Y. L. Zhou, and H. B. Lu, Appl. Phys. Lett. 83, 1983 (2003).
- Garcia et al. (2006) H. Garcia, H. Krishna, and R. Kalyanaraman, Appl. Phys. Lett. 89, 141109 (2006).
- R. H. Magruder III et al. (1994) R. H. Magruder III, D. H. Osborne Jr., and R. A. Zuhr, J. Non-Cryst. Sol. 176, 299 (1994).
- G. Battaglin et al. (2000) G. Battaglin, E. Cattaruzza, F. Gonella, G. Mattei, P. Mazzoldi, C. Sada, and X. Zhang, Nuc. Instr. Met. Phys. Res. B 166-167, 857 (2000).
- M. Moskovits et al. (2002) M. Moskovits, I. Srnova-Sloufova, and B. Vlckova, J. Chem. Phys. 116, 10435 (2002).
- Bergman (1980) D. J. Bergman, Phys. Rev. Lett. 44, 1285 (1980).
- G. W. Milton (1981) G. W. Milton, J. Appl. Phys. 52, 5286 (1981).
- A. Sihvola (1999) A. Sihvola, Electromagnetic Mixing Formulas and Applications (IEEE, Electromagnetic Theory, London, UK, 1999).
- J. C. M. Garnett (1904) J. C. M. Garnett, Trans. Royal Soc. London CCIII, 385 (1904).
- D. A. G. Bruggeman (1935) D. A. G. Bruggeman, Ann. Phys. 24, 636 (1935).
- W.E. Kohler and G.C. Papanicolaou (1981) W.E. Kohler and G.C. Papanicolaou, in Multiple Scattering and Waves, edited by P.L. Chow, W.E. Kohler, and G.C. Papanicolaou (North Holland, New York, 1981), pp. 199–223.
- Z. Hashin and S. Shtrikman (1962) Z. Hashin and S. Shtrikman, J. Appl. Phys. 33, 3125 (1962).
- D. J. Bergman (1981) D. J. Bergman, Physics Rep. 43 (1981).
- Anderson et al. (1998) T. Anderson, R. Magruder, D. Kinser, J. Wittig, R. Zuhr, and D. Thomas, J. Non-Cryst. Sol. 224, 299 (1998).
- K. Peiponen and E. Gornov (2006) K. Peiponen and E. Gornov, Optics Letters 31, 2202 (2006).
- O. Wiener (1912) O. Wiener, Abh. Math. Phys. K1 Königl. Sächs. Ges. 32, 509 (1912).
- Garnett (1904) J. C. M. Garnett, Trans. Roy. Soc. 53, 385 (1904).
- (27) SOPRA database, http://www.sopra-sa.com/.
- Ashcroft and Mermin (1976) N. Ashcroft and N. Mermin, Solid state physics (Thomson learning, USA, 1976).
- Halperin (1986) W. P. Halperin, Rev. Mod. Phys. 58, 533 (1986).
- (30) C. Favazza, J. Trice, H. Krishna, R. Kalyanaraman, and R. Sureshkumar, Appl. Phys. Lett. 88, 1531181 (2006); C. Favazza, J. Trice, A. Gangopadhyay, H. Garcia, R. Sureshkumar, and R. Kalyanaraman, J. Elec. Mat. 35, 1618 (2006); C. Favazza, R. Kalyanaraman, and R. Sureshkumar, Nanotechnology 17, 4229 (2006).
- Bozhevolnyi and Shalaev (2006) S. Bozhevolnyi and V. Shalaev, Photonics spectra 40, 58 (2006).
Figure captions
-
1.
Schematic of the binary tree approach to implement the self consistent binary mixing rule to obtain the effective dielectric constant. (a) Application of the mixing rule to create a mixture of two metals a and b in the host h. (b) Application of the rule to create an alloy nanocomposite in host h from alloys of metals a and b.
-
2.
Comparison of theory and experiment for plasmonic behavior in a nanocomposite containing various mixtures of Au and Cu in SiO. The theoretical results using the binary mixing rule are presented as lines while experimental data (symbols) were extracted from the work of Magruder et al. (R. H. Magruder III et al., 1994). The peak position, shift and widths are predicted very well using the mixing rule. The experimental data corresponds to various ratios of Ag:Cu achieved by sequential ion implantation.
-
3.
Comparison of theory and experiment of plasmonic behavior in various Au-Cu alloy nanocomposites in SiO obtained by ion implantation and annealing. The experimental data (symbols) was extracted from the work of Battaglin et al. (G. Battaglin et al., 2000) while the theoretical calculations are represented as lines. Alloy compositions are indicated on the figure.
-
4.
Comparison of plasmonic behavior in colloidal solutions containing Au-Ag core-shell alloys for two compositions. The symbols are experimental data extracted from Moskovits et al. (M. Moskovits et al., 2002) while lines are theory. The numbers within brackets in the legends represent the mole fraction of Au in the colloidal solution.