BULK ETCH RATE MEASUREMENTS AND CALIBRATIONS OF PLASTIC NUCLEAR TRACK DETECTORS
S. Balestra1, M. Cozzi1, G. Giacomelli1, R. Giacomelli1, M. Giorgini1, A. Kumar1,2, G. Mandrioli1, S. Manzoor1,3, A. R. Margiotta1, E. Medinaceli1, L. Patrizii1, V. Popa1,4, I.E. Qureshi3, M.A. Rana3, G. Sirri1, M. Spurio1, V. Togo1 and C. Valieri1
1. Phys. Dept. of the University of Bologna and INFN, Sezione di
Bologna, Viale C. Berti Pichat 6/2, I-40127 Bologna, Italy
2. Dept. Of Physics, Sant Longowal Institute of Eng. and Tech., Longowal
148 106 India
3. PRD, PINSTECH, P.O. Nilore, Islamabad, Pakistan
4. Institute of Space Sciences, Bucharest R-077125, Romania
Abstract
New calibrations of CR39 and Makrofol nuclear track detectors
have been obtained using 158 A GeV and ions; a new
method for the bulk etch rate determination, using both cone height and base
diameter measurements was developed. The CR39 charge resolution based on the
etch-pit base area measurement is adequate to identify nuclear fragments in
the interval . For CR39 the detection threshold is at
REL MeV cm2 g-1, corresponding to a nuclear fragment with
Z/ 7.
Base cone area distributions for Makrofol foils exposed to ions
have
shown for the first time all peaks due to nuclear fragments with ;
the distribution of the etched cone heights shows well separated individual
peaks for Z/ = 78 83 (charge pickup). The Makrofol detection
threshold is
at REL MeV cm2 g-1, corresponding to a nuclear fragment
with Z/ 50.
PACS: 29.40.Wk; 34.90.+q
Keywords: Nuclear Track Detectors; Bulk etch rate; Relativistic Ions; Nuclear Fragmentation.
1 Introduction
Nuclear Track Detectors (NTDs) are employed in several scientific and technological applications [1,2]. The most sensitive NTD is the isotropic poly-allyl-diglycol carbonate polymer, commercially known as CR39®; Makrofol®/Lexan® polycarbonates are also largely employed. More than 4000 of CR39 detectors were used in the MACRO and SLIM experiments devoted to the search for new massive particles in the cosmic radiation (magnetic monopoles, nuclearites, q-balls) [3,6]. Several experiments are going on in different fields which require an accurate detector calibration [7-8].
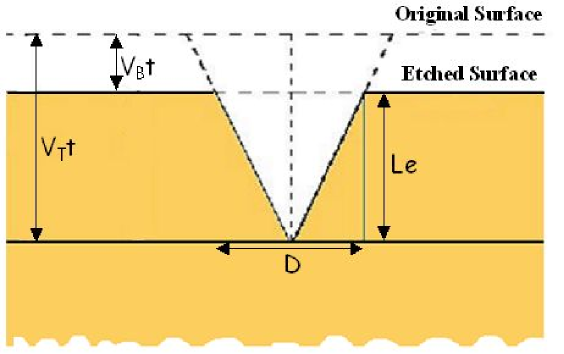
The damaged trail (called “latent track”) produced by an ionizing particle can be made visible with an optical microscope through a chemical etching process in aqueous solution of either NaOH or KOH at a proper concentration and temperature. The latent track develops into a conical-shaped etch-pit, when the etching velocity along the particle trajectory () is larger than the one for the bulk etching of the material ( ), Fig. 1 [1]. The addition of ethyl alcohol in the etchant speeds up the etching process, improves the post-etched surface quality of CR39 and Makrofol, but raises their detection thresholds.
For particles with constant energy loss, the etch-rate ratio , may be determined by measuring either the etch-pit surface area or the etch-pit height and the bulk etch rate, . Two methods have been used to determine : the most common one is based on the measurement of the detector thickness removed during etching. The method is affected by a systematic error of a few [9].
The main aim of this paper is to analyze a new method of measurement of the bulk-etch rate in CR39 and in Makrofol, and to obtain new calibrations for these detectors.
2 Experimental
A stack composed of Makrofol and CR39 foils of size 11.5 x 11.5 cm2 with a 1 cm thick lead target was exposed to 158 A GeV ions in 1996 (Pb96); a second stack with a 1 cm thick aluminium target was exposed to 158 A GeV ions in 2003 (In03); both exposures were performed at the CERN-SPS, at normal incidence and a total ion density of . The CR39 polymer sheets used in the present experiment were manufactured by Intercast Europe Co., Parma, Italy using a specially designed line of production [10]. The Makrofol detectors were manufactured by Bayer A.G., Germany. The Makrofol thickness is 500 , the CR39 thickness is either 700 or 1400 ; all detector sheets were covered by a 30 plastic film to protect them from exposure to ambient radon; the protective layers were removed before etching. The detector foils downstream of the target recorded the beam ions as well as their nuclear fragments.
After exposures, two CR39 foils (In03 stack) and two Makrofol foils, (Pb96 stack), located after the target were etched in 6 N NaOH + 1 ethyl alcohol at 70 for 40 h and 6 N KOH + 20 ethyl alcohol at 50 for 8 h, respectively. The etching was performed in a stainless steel tank equipped with internal thermo-resistances and a motorized stirring head. The temperature was stable to within . In order to keep homogeneous the solution and to avoid that etched products deposit on the detector surfaces, a continuous stirring was applied during etching.
For CR39 detectors, etch-pit base diameters and heights of In ions and their fragments were measured with a Leica optical microscope. In Makrofol, Pb ions and their high Z fragments made through-holes in the detector sheets; thus the cone length was measured only for high Z fragment tracks that have sharp etch-cone tips (no holes). Nuclear fragments with charges were identified by etching another Makrofol sheet from the same stack in the same conditions for only 5 hours.
2.1 “Standard” measurement of
As already recalled, the standard determination of is based on the measurement of the thickness of the detector at different etching times. The thickness is measured with an electronic micrometer of 1 accuracy in 25 positions on the detector foil. The average bulk-etch velocity is , where is the mean thickness difference after a etching time. For CR39, at etching times shorter than 10 hours the thickness is affected by detector swelling [11-13]. The bulk etching rate must be determined by a linear fit of vs for etching times longer than 10 hours. For Makrofol no significant swelling effect was observed.
2.2 The bulk etch rate from the cone height and base diameter measurements
For relativistic charged particles the track etch rate can be considered constant. For normally incident particles, the measurable quantities are the cone base diameter D, and the height , see Fig. 1. is obtained by multiplying the measured cone height by the refractive index n of the etched detector material; n is obtained from the ratio of the actual thickness (measured with an electronic micrometer with a precision of 1 ) to the apparent thickness measured with an optical microscope (precision of 1 ) [; ].
The following relations hold:
| (1) |
| (2) |
From the above relations, the following quadratic equation in is obtained
| (3) |
The real solution for is
| (4) |
From equation 1 the track etch rate can be written as
| (5) |
and from equations 1 and 2, the reduced etch rate follows
| (6) |
We may thus determine the bulk etch rate and the reduced etch-rate p by measuring the track parameters Le (measured with a precision of 1 ) and D (precision of 0.5 ).
Relations (4-6) were tested with relativistic Pb and In ions and their nuclear fragments. We selected only tracks for which precise measurements of the cone height and diameter could be performed (for example we cannot measure precisely the track cone heights for low Z fragments). Then, using equation (4) we computed the bulk-etch rate for CR39 and Makrofol. Batches of measurements were made by different operators, and the average ’s and their statistical standard deviations were computed, see Table 1. By this method we obtain values with accuracies of 0.01 - 0.05 /h. The values obtained for the same foils using detector thickness measurements are also given.
Notice that we can effectively make measurements with the available measuring instruments using the new method only for intermediate z-values because at low and high z we do not have enough precision for measuring and D, respectively.
3 Calibrations
In ref. [14] it was shown that the reduced etch rate p of CR39 is a unique function of the particle Restricted Energy Loss (REL). In the following sections new calibration data are reported for CR39 and Makrofol based on the new determination of the bulk etch rate.
3.1 Calibration of the CR39 detector
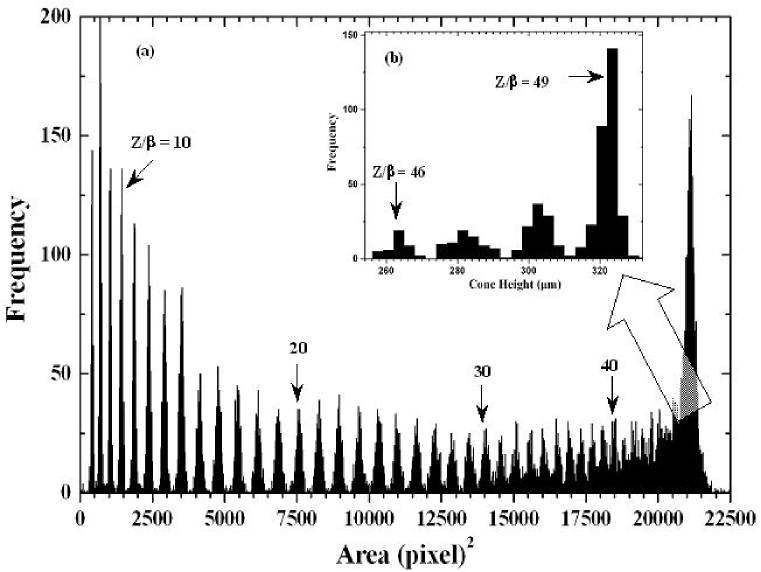
Etch-pit base areas were measured with the Elbek automatic image analyzer system [15]. Fig. 2 shows the etch-pit base area distribution for Indium ions and their fragments in CR39; averages were computed from measurements made on the ”front sides” of two detector sheets. The peaks are well separated from 7 to 45; the charge resolution for the average of two measurements is at . The charge resolution close to the Indium peak (Z 49) can be improved by measuring the heights of the etch pit cones [16]. The heights of 1000 etch-cones with diameter larger than 48 (corresponding to nuclear fragments with ) were measured with an accuracy of with a Leica microscope coupled to a CCD camera and a video monitor. The corresponding distribution is shown in the inset in Fig. 2; each of the 4 peaks is well separated from the others, and a charge can be assigned to each one.
The charge resolution for single measurements of different nuclear fragments is given in Table 2; it is at . The charge resolutions may be computed using the relations [17]
| (7) |
where and are the standard deviations; A is the mean base area and the mean height of the etched cones.
3.2 Calibration of the Makrofol detector
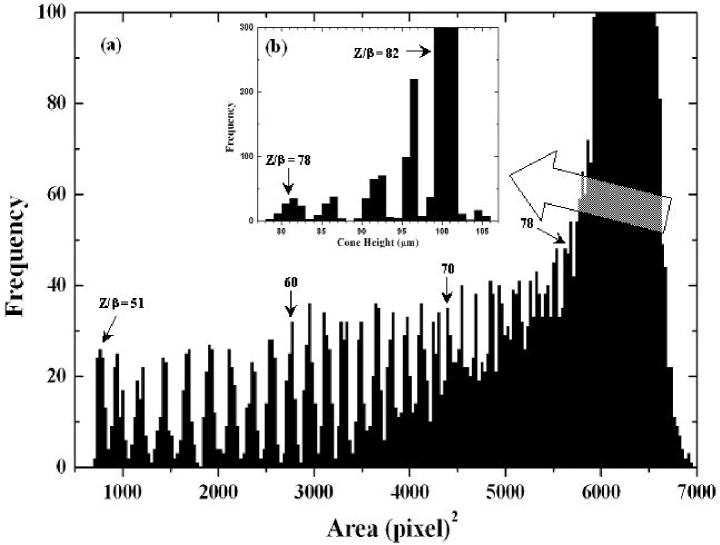
Fig. 3 shows the base area distribution for the average of 2 measurements of Pb ions and their fragments in Makrofol; averages were computed from measurements on the front sides of two detector foils. The peaks are well separated from to (the charge resolution is at . The charge resolution close to the Pb peak (Z = 82) was improved by measuring the heights of the etch pit cones. The heights of 4000 etch cones with base diameters larger than 47 were measured; the corresponding distribution is shown in the inset in Fig. 3; each peak is well separated from the others, and a charge was assigned to every peak. The charge resolution for single measurements of different nuclear fragments is at , see Table 2). Notice the presence of the Z = 83 peak from a charge pick-up reaction.
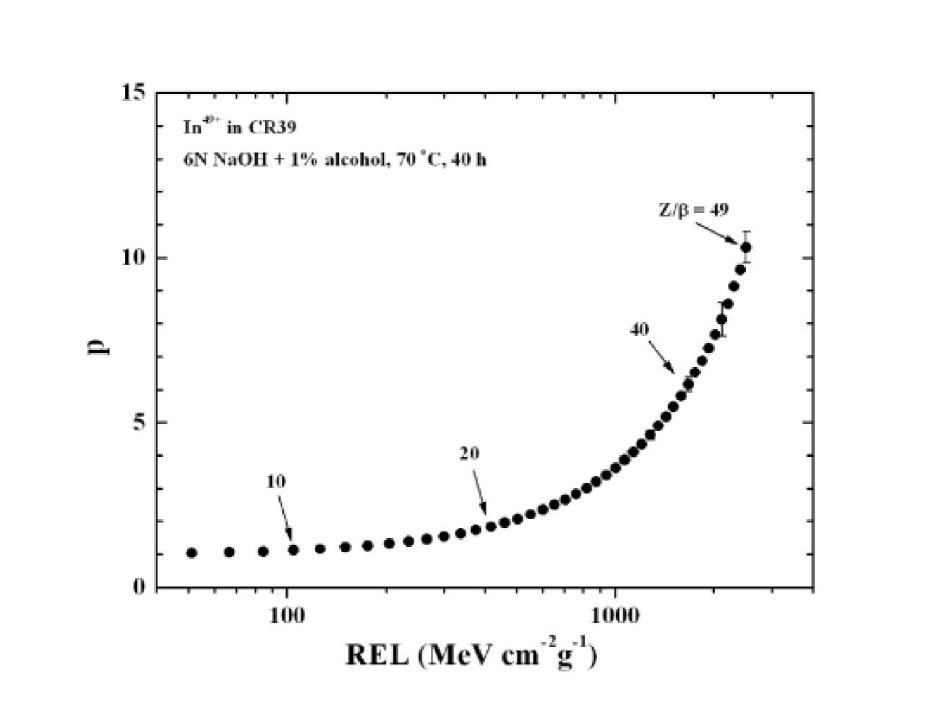
For each detected nuclear fragment from Z = 7 to 48 and Indium ions (Z = 49) we computed the REL and the reduced etch rate p = using eq. (6). p versus REL for CR39 is plotted in Fig. 4; the CR39 detection threshold is at REL MeV cm2 g-1 (corresponding to a relativistic nuclear fragment with 7.
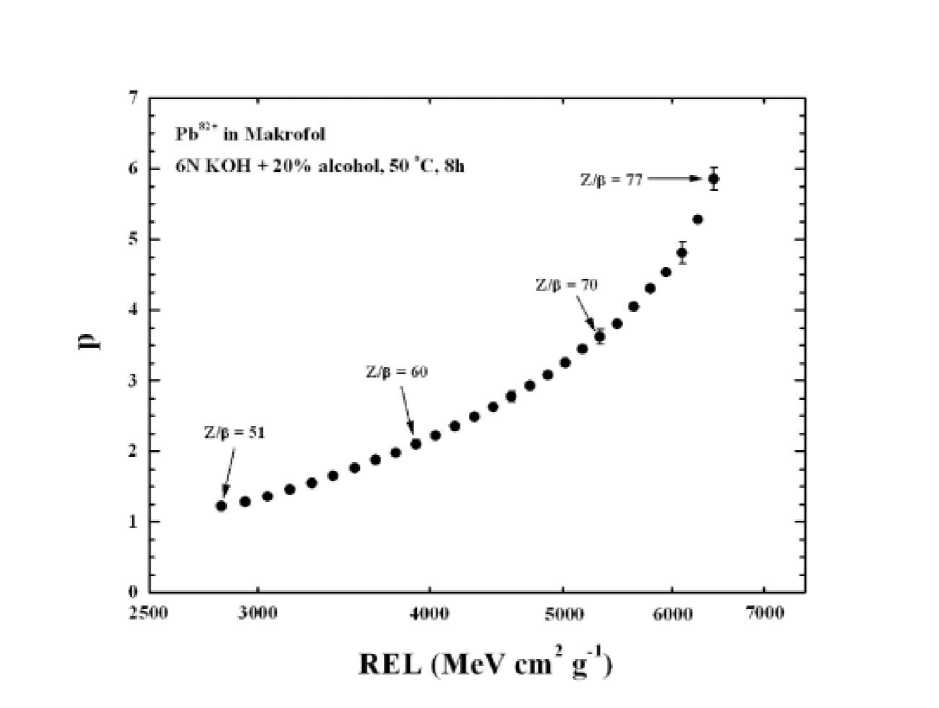
The same procedure was applied to Makrofol (Fig. 5). The Makrofol detection threshold is at REL MeV cm2 g-1, corresponding to a nuclear fragment with .
As evident in Figs. 4 and 5 the reduced etch-rate p is a non-linear function of REL. For example for CR39 up to REL MeV cm2 g-1, p changes slowly with REL, while a rapid increase is observed at larger values.
The changes and with respect to can be obtained by differentiating eqs. 1 and 2 with respect to p [18]:
| (8) |
| (9) |
At large p values, is smaller with respect to ; for high REL it is difficult to obtain a charge resolution 1e. From Figs. 2 and 3 it is seen that for high , the base area distribution does not give well separated peaks, while by cone height measurements the peaks are well separated (see the insets).
4 Discussion and Conclusions
The ”new method” for measuring the bulk etch rate for intermediate or high z values yields slightly smaller uncertainties than the ”standard method” (change in thickness). This comes from the use at the same time of both cone heights and base diameter measurements of tracks.
The values obtained here by the two methods are in reasonable agreement; the differences may arise from small systematic uncertainties affecting the thickness measurement of a sheet and the cone height and diameter of etch-pits.
Calibration data were obtained with ions of 158 A GeV for CR39 and with ions of 158 A GeV for the Makrofol detectors. Well separated peaks for the primary ions and for their fragments are observed in Figs. 2 and 3. At low Z/ the measurements of the base area cones are adequate, while at high Z/ the measurements of the cone heights are more useful. All the peaks are well separated in CR39 (In03) for Z/ 7 - 49 and in Makrofol (Pb96) for Z/ 52 - 83; a charge value may be assigned to each peak (for these exposures ).
The reduced etch rate p (computed with the new method) plotted versus REL covers a large Z/ range for both detectors, Fig. 4 and 5.
5 Acknowledgements
We thank the CERN SPS staff for the Pb and In beam exposures. We acknowledge many colleagues for their cooperation and technical advice. We gratefully acknowledge the contribution of our technical staff, in particular E. Bottazzi, L. Degli Esposti and G. Grandi. We thank INFN and ICTP for providing fellowships and grants to non-Italian citizens.
References
- [1] R.L Fleischer, P.B. Price, R.M. Walker, Nuclear Tracks in Solids, University of California Press, California, 1975.
- [2] S.A. Durrani, R.K. Bull, Solid State Nuclear Track Detection, Pergamon Press, Oxford, 1987.
- [3] M. Ambrosio et al., Eur. Phys. J. C 25 (2002) 511; hep-ex/0207020.
- [4] S. Cecchini et al., Radiat. Meas. 40 (2005) 405; hep-ex/0508043; hep-ex/ 0503003; hep-ex/0506075.
- [5] J. Derkaoui, G. Giacomelli, T. Lari, G. Mandrioli, M. Ouchrif, L. Patrizii, V. Popa, Astropart. Phys. 10 (1999) 339.
- [6] S. Cecchini, T. Chiarusi, G. Giacomelli, A. Kumar, L. Patrizii, Proc. of the 16th PAC-European Rocket Balloon Programmes Related Research, (2003), SP-530, astro-ph/0510717.
- [7] Y. Uchihori et al. (ICCHIBAN Collaboration), J. Radiat. Res. (Tokyo) 43 (2002) Suppl:S81-5.
- [8] S. Kodaira, N. Hasebe, T. Doke, A. Kitagawa, H. Kitamura, S. Sato, Y. Uchihori, N. Yasuda, K. Ogura, H. Tawara, Japanese J. of Appl. Phys. 43 (2004) 6358.
- [9] S. Cecchini, G. Giacomelli, M. Giorgini, L. Patrizii, P. Serra, Radiat. Meas. 34 (2001) 55.
- [10] L. Patrizii et al., Nucl. Tracks Radiat. Meas. 19 (1991) 641.
- [11] S. Ahlen et al., Nucl. Instrum. Meth. A 324 (1993) 337.
- [12] A. Kumar, R. Prasad, Nucl. Instrum. Meth. B 119 (1996) 515.
- [13] F. Malik, E.U. Khan, I.E. Qureshi, S.N. Husaini, M. Sajid, S. Karim, K. Jamil, Radiat. Meas. 35 (2002) 301.
- [14] S. Cecchini et al., Il Nuovo Cimento, 109 A (1996) 1119.
- [15] A. Noll, G. Rusch, H. Rocher, J. Dreute, W. Heinrich, Nucl. Tracks Radiat. Meas. 15 (1988) 265.
- [16] G. Giacomelli, M. Giorgini, G. Mandrioli, S. Manzoor, L. Patrizii, V. Popa, P. Serra, V. Togo, E.C. Vilela, Nucl. Instrum. Meth. A 411 (1998) 41.
- [17] S. Cecchini, H. Dekhissi, G. Giacomelli, E. Katsavounidis, A.R. Margiotta, L. Patrizii, F. Predieri, P. Serra, M. Spurio, Astropart. Phys. 1 (1993) 369.
- [18] I.E. Qureshi, M.I. Shahzad, M.T. Javed, S. Manzoor, G. Sher, F. Aleem, H.A. Khan, Radiat. Meas. 40 (2005) 437.
| Detector | Z Range | Etching Conditions | ||
| (beam) | New Method | Standard Method | ||
| CR39 | 44 - 49 | 6N NaOH | 1.25 m/h | 1.15 m/h |
| (In03) | +1 alcohol, 70∘C, 40 h | |||
| CR39 | 75 - 80 | 6N NaOH 70∘C, 30 h | 1.10 m/h | 1.15 m/h |
| (Pb96) | ||||
| CR39 | 78 - 82 | 6N NaOH 45∘C, 268 h | 0.16 m/h | 0.17 m/h |
| (Pb96) | ||||
| Makrofol | 75 - 78 | 6N KOH | 3.44 m/h | 3.52 m/h |
| (Pb96) | +20 alcohol, 50∘C, 8 h |
| CR39 Detector | Makrofol Detector | ||
| Charge | Charge Resolution | Charge | Charge Resolution |
| Z=8 to 11 | 0.12e | Z=51 to 58 | 0.18e |
| Z=12 to 21 | 0.13e | Z=51 to 66 | 0.19e |
| Z=22 to 31 | 0.16e | Z=59 to 66 | 0.21e |
| Z=32 to 41 | 0.20e | Z=59 to 69 | 0.22e |
| Z=32 to 45 | 0.22e | Z=70 to 74 | 0.31e |
| Z=42 to 49 | 0.28e | Z=75 to 77 | 0.37e |
| Z=46 to 49 | 0.22e | Z=79 to 82 | 0.18e |
| by cone height | by cone height | ||