Wavelength- and material-dependent absorption in GaAs and AlGaAs microcavities
Abstract
The quality factors of modes in nearly identical GaAs and Al0.18Ga0.82As microdisks are tracked over three wavelength ranges centered at 980 nm, 1460 nm, and 1600 nm, with quality factors measured as high as 6.62105 in the 1600-nm band. After accounting for surface scattering, the remaining loss is due to sub-bandgap absorption in the bulk and on the surfaces. We observe the absorption is, on average, 80 percent greater in AlGaAs than in GaAs and in both materials is 540 percent higher at 980 nm than at 1600 nm.
In recent semiconductor cavity QED experiments involving self-assembled III-V quantum dots (QDs), Rabi splitting of the spontaneous emission line from individual QD excitonic states has been measured for the first time Reithmaier et al. (2004); Yoshie et al. (2004). Potential application of these devices to quantum networks Cirac et al. (1997) and cryptography Waks et al. (2002) over long-haul silica fibers has sparked interest in developing QD-cavity systems with efficient light extraction operating in the telecommunication bands at 1300 nm and 1550 nm Miyazawa et al. (2005). The demonstration of vacuum-Rabi splitting in this system, a result of coupling a QD to localized optical modes of a surrounding microresonator, has been greatly aided by prior improvements to the design and fabrication of semiconductor microcavities Akahane et al. (2003); Löffler et al. (2005); Englund et al. (2006). At the shorter wavelengths involved in these Rabi splitting experiments (740–1200 nm), the optical quality factors () of the host AlGaAs microcavities were limited to 2104—corresponding to a loss rate comparable with the coherent QD-cavity coupling rate. Further reduction of optical loss would increase the relative coherence of the QD-cavity system and would allow greater coupling efficiency to the cavity mode.
In previous measurements of wavelength-scale AlGaAs microdisk resonators, we have demonstrated -factors up to 3.6105 in the -nm band Srinivasan et al. (2005a) and attributed the improved performance to an optimized resist-reflow and dry-etching technique, which produces very smooth sidewalls Borselli et al. (2005). Subsequently, we have also measured Al0.3Ga0.7As microdisks with similar quality factors between 1200 nm and 1500 nm; however, these disks exhibit a significant unexpected decrease in at shorter wavelengths ( nm) Srinivasan et al. (2005b). In related work on silicon microdisks, methods have been developed to specifically measure and characterize losses due to material absorption and surface scattering Borselli et al. (2004, 2005, 2006). In this Letter we study the properties of GaAs and Al0.18Ga0.82As microdisks across three wavelength bands centered at 980 nm, 1460 nm, and 1600 nm. After estimating and removing the surface-scattering contribution to the cavities losses, we find the remaining absorption, composed of losses in the bulk and on the surfaces, depends significantly on both wavelength and material composition.
Within the microdisk resonators studied here, optical loss can be separated into three main components: intrinsic radiation of the whispering-gallery modes (WGMs), scattering from roughness at the air-dielectric interface due to fabrication imperfections, and absorption at the surface or in the bulk of the semiconductor material. The measured total intrinsic is given by
| (1) |
where , , and describe cavity losses to radiation, surface scattering, and absorption, respectively. As in the devices studied here for disk diameters (thicknesses) () where is the free-space wavelength and is the refractive index of the disk material, microdisk cavities support a large number of modes with very low radiation loss. For all the microdisk modes studied here, the calculated is 106 and typically is 108.
The samples were fabricated from high-quality heterostructures grown by molecular beam epitaxy (MBE) on a GaAs substrate. Two different samples were grown: a “GaAs” sample containing a 247-nm GaAs disk layer, and an “AlGaAs” sample with a 237-nm Al0.18Ga0.82As disk layer. In both samples the disk layer was grown nominally undoped (background doping levels cm-3) and was deposited on a 1.6-m Al0.7Ga0.3As sacrificial layer. Microdisks with a radius of 3.4 m were defined by electron-beam lithography and etched in a 55 percent (by volume) HBr solution containing 3.6 g of K2Cr2O7 per litre Gayral et al. (1999). The disks were partially undercut by etching the sacrificial layer in 8 percent HF acid for 45 s, prior to e-beam resist removal.
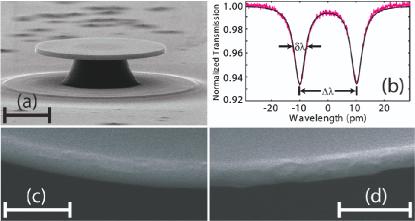
Passive measurements of the cavity were performed using an evanescent coupling technique employing a dimpled fiber-taper waveguide Borselli et al. (2004); Srinivasan et al. (2004); Michael et al. . The dimpled taper was mounted to a three-axis 50-nm-encoded stage and positioned in the near field of the resonator. Using the taper position to vary the coupling, the WGMs of the microdisks were excited using three swept tunable laser sources (linewidth MHz, covering 963–993 nm, 1423–1496 nm, and 1565–1625 nm). By weakly loading the cavity, the resonance linewidth [see Fig. 1(b)] is a good measure for the intrinsic quality factor ().
High-resolution linewidth scans were calibrated to pm accuracy using a fiber-based Mach-Zehnder interferometer. A set of polarization-controlling paddle wheels was used to selectively couple to TE-like or TM-like microdisk modes. Each family of modes (same radial order ) was identified by comparing the coupling behavior and free spectral range (FSR) to finite-element method (FEM) models Borselli et al. (2006).
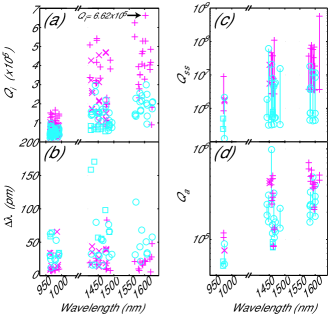
The measured s for all observed modes are summarized in Fig. 2(a). Modes with s dominated by radiation loss, i.e. the measured is near calculated using FEM simulations, are omitted. In the 1600-nm band, the high- TE modes are 1–4 in GaAs and 1–3 in AlGaAs; all TM modes are radiation limited in this band. Near 1460 nm, the TEp=1-4 and TMp=1 modes in both materials are detectable and not radiation limited. In the 980-nm range, identifying modes becomes more difficult: at this wavelength families through TEp=8 and TMp=7 are not radiation limited, and significant spectral overlap between the modes causes Fano-like resonance features Fano (1961). In addition, we are unable to couple to the lowest order modes of both polarizations ( 1–3) because they are poorly phase matched to the fiber taper.
Despite efforts to produce perfectly smooth side walls, Figs. 1(c,d) indicate that significant surface roughness is still present. Surface roughness on microdisk resonators backscatters light between the degenerate WGMs, which breaks their degeneracy and results in the measured mode-splitting () shown in Fig. 1(b). Following the theory developed in Refs. Borselli et al. (2005) and Little and Chu (1996), and are both dependent on the characteristic volume of the scatterer ():
| (2) | |||||
| (3) |
where and are the indices of refraction of the disk and surrounding medium, respectively, is the spatially-averaged -polarized normalized electric field energy at the disk edge, and is a geometrical factor weighting the radiation contribution from the polarizations. The mode field profiles are calculated by the FEM. For FEM models in the 980-nm span, we treat all measured TE (TM) modes as TEp=7 (TMp=6) because the appropriate field parameters do not vary significantly between radial orders.
We employ two separate measurements to find rough bounds on . First, we use the average doublet splitting for each family to find the average sampled by each mode and then calculate the associated with each family.
Second, we statistically analyze the roughness of the disk edges in high resolution SEM images Borselli et al. (2004). Fitting the autocorrelation of the roughness to a Gaussian, the roughness amplitude () and correlation length () give the “statistical” scatterer volume ( where and are the disk’s thickness and radius) for each disk, which is used to estimate .
The average for the GaAs and AlGaAs disks are nm and nm, respectively. Because each mode will not sample all of the disk’s physical irregularities, the roughness estimated by the statistical analysis is slightly greater than the roughness calculated from the doublet splittings. Hence, the doublet splitting places an upper bound and more accurate value for [Fig. 2(c)]. The statistical analysis gives a lower bound, although neither bound is strict in the theoretical sense.
Through Eq. (1), and are removed from the measured to obtain limits on [Fig. 2(d)]. To relate cavity losses to material properties, the material absorption rate () for the mode is given by 111The commonly used absorption coefficient () depends on both the material absorption rate and the group velocity of the cavity mode ().. We weight each measured doublet equally and average over all families in a band to determine an average . Table 1 compiles the average absorption rates for both GaAs and Al0.18Ga0.82As across the three wavelength ranges.
| Method: | Splitting | Statistical |
|---|---|---|
| Sample | (GHz) | |
| GaAs @ 1600 nm – TE | ||
| AlGaAs @ 1600 nm – TE | ||
The average rates are 540 percent larger at 980 nm than at 1600 nm and 80 percent greater in AlGaAs than in GaAs.
The measured absorption may be due to a number of sources. Although nonlinear-absorption-induced optical bistability was measured for internal cavity energies as low as 106 aJ, the losses reported in Table 1 were all taken at input powers well below the nonlinear absorption threshold. Free carrier absorption can also be neglected given the nominally undoped material and relatively short wavelengths studied here Spitzer and Whelan (1959). The Urbach tail makes a small contribution in the 980-nm band (15 percent) and is negligible otherwise Spitzer and Whelan (1959). This leaves deep electron (hole) traps as the major source contributing to bulk material absorption in the measured microdisks. Similar wavelength dependent absorption has been observed in photocurrent measurements of MBE-grown AlGaAs waveguides Karkhanehchi et al. (1997) and attributed to sub-bandgap trap levels associated with vacancy complexes and oxygen incorporation during growth Yamanaka et al. (1987). Given the high surface-volume ratio of the microdisks, another possible source of loss is surface-state absorption. The sensitivity to absorption from surface-states can be quantified by the mode’s energy overlap with the disk’s surface, ; TM modes are more surface-sensitive than TE modes Borselli et al. (2006) whereas both polarizations are almost equally sensitive to the bulk. The calculated surface overlap ratio is for modes in the 1460-nm band, where all surfaces of the disk (top, bottom, and etched edge) are treated equally. For these modes the measured absorption ratio is () in the AlGaAs (GaAs) microdisks, which indicates the presence of significant surface-state absorption in the AlGaAs resonators and dominant bulk absorption in the GaAs disks. In the 980-nm band, the data are consistent with bulk absorption [ () for the AlGaAs (GaAs) devices] although the results are less conclusive due to the larger scatter in the data.
In summary, after accounting for radiation and surface scattering losses, we measure greater sub-bandgap absorption in Al0.18Ga0.82As microdisks than in similar GaAs resonators, and the absorption in both materials decreases towards longer wavelengths. From the polarization dependence of the measured optical loss, we infer that both surface states and bulk states contribute to the residual absorption in these structures. Our results imply that reductions in the optical loss of AlGaAs-based microphotonics, especially at the shorter wavelengths m and in high Al content alloys, will require further study and reduction of deep level traps, and that surface passivation techniques Mohideen et al. (1994) will also likely be important.
Two authors (C.P.M. and K.S., respectively) would like to thank the Moore Foundation and the Hertz Foundation for their graduate fellowship support. K. H. L. thanks the Wingate Foundation. H. K. has been supported by NSF grant No. 0304678.
References
- Reithmaier et al. (2004) J. P. Reithmaier, G. Sȩk, A. Löffler, C. Hofmann, S. Kuhn, S. Reitzenstein, L. V. Keldysh, V. D. Kulakovskii, T. L. Reinecke, and A. Forchel, Nature 432, 197 (2004).
- Yoshie et al. (2004) T. Yoshie, A. Scherer, J. Hendrickson, G. Khitrova, H. M. Gibbs, G. Rupper, C. Ell, O. B. Shchekin, and D. G. Deppe, Nature 432, 200 (2004).
- Cirac et al. (1997) J. I. Cirac, P. Zoller, H. J. Kimble, and H. Mabuchi, Phys. Rev. Lett. 78, 3221 (1997).
- Waks et al. (2002) E. Waks, K. Inoue, C. Santori, D. Fattal, J. Vučović, G. S. Solomon, and Y. Yamamoto, Nature 420, 762 (2002).
- Miyazawa et al. (2005) T. Miyazawa, K. Takemoto, Y. Sakuma, S. Hirose, T. Usuki, N. Yokoyama, M. Takatsu, and Y. Arakawa, Jpn. J. Appl. Phys. 44, L620 (2005).
- Akahane et al. (2003) Y. Akahane, T. Asano, B.-S. Song, and S. Noda, Nature 425, 944 (2003).
- Löffler et al. (2005) A. Löffler, J. P. Reithmaier, G. Sȩk, C. Hofmann, S. Reitzenstein, M. Kamp, and A. Forchel, Appl. Phys. Lett. 86, 111105 (2005).
- Englund et al. (2006) D. Englund and J. Vučković, Opt. Express 14, 3472 (2006).
- Srinivasan et al. (2005a) K. Srinivasan, M. Borselli, T. J. Johnson, P. E. Barclay, and O. Painter, Appl. Phys. Lett. 86, 151106 (2005a).
- Borselli et al. (2005) M. Borselli, T. J. Johnson, and O. Painter, Opt. Express 13, 1515 (2005).
- Srinivasan et al. (2005b) K. Srinivasan, P. E. Barclay, O. Painter, A. Stintz, and S. Krishna, in Quantum Electronics and Laser Science Conference (QELS) (Optical Society of America, Baltimore, MD, 2005b), pp. QME5–59.
- Borselli et al. (2004) M. Borselli, K. Srinivasan, P. E. Barclay, and O. Painter, Appl. Phys. Lett. 85, 3693 (2004).
- Borselli et al. (2006) M. Borselli, T. J. Johnson, and O. Painter, Appl. Phys. Lett. 88, 131114 (2006).
- Gayral et al. (1999) B. Gayral, J. M. Gérard, A. Lemaître, C. Dupuis, L. Manin, and J. L. Pelouard, Appl. Phys. Lett. 75, 1908 (1999).
- Srinivasan et al. (2004) K. Srinivasan, P. E. Barclay, M. Borselli, and O. Painter, Phys. Rev. B 70, 081306R (2004).
- (16) C. P. Michael, M. Borselli, and O. Painter, (unpublished).
- Fano (1961) U. Fano, Phys. Rev. 124, 1866 (1961).
- Little and Chu (1996) B. E. Little and S. T. Chu, Opt. Lett. 21, 1390 (1996).
- Spitzer and Whelan (1959) W. G. Spitzer and J. M. Whelan, Phys. Rev. 114, 59 (1959).
- Karkhanehchi et al. (1997) M. M. Karkhanehchi, D. A. Barrow, A. C. Bryce, C. J. Hamilton, and J. H. Marsh, IEEE J. Quantum Elect. 33, 933 (1997).
- Yamanaka et al. (1987) K. Yamanaka, S. Naritsuka, K. Kanamoto, M. Mihara, and M. Ishii, J. Appl. Phys. 61, 5062 (1987).
- Mohideen et al. (1994) U. Mohideen, W. S. Hobson, S. J. Pearton, F. Ren, and R. E. Slusher, Appl. Phys. Lett. 64, 1911 (1994).