On the action potential as a propagating
density pulse and the role of anesthetics
Thomas Heimburg,∗ and Andrew D. Jackson
The Niels Bohr Institute, University of Copenhagen,
Blegdamsvej 17, 2100 Copenhagen Ø, Denmark
∗corresponding author, theimbu@nbi.dk
keywords: Action potential; Hodgkin-Huxley model; solitons; heat
changes
The Hodgkin-Huxley model of nerve pulse propagation relies on ion
currents through specific resistors called ion channels. We discuss a
number of classical thermodynamic findings on nerves that are not
contained in this classical theory. Particularly striking is the
finding of reversible heat changes, thickness and phase changes of
the membrane during the action potential. Data on various nerves
rather suggest that a reversible density pulse accompanies the action
potential of nerves. Here, we attempted to explain these phenomena by
propagating solitons that depend on the presence of cooperative phase
transitions in the nerve membrane. These transitions are, however,
strongly influenced by the presence of anesthetics. Therefore, the
thermodynamic theory of nerve pulses suggests a explanation for the
famous Meyer-Overton rule that states that the critical anesthetic
dose is linearly related to the solubility of the drug in the
membranes.
1 Introduction
The description of electrical phenomena in nerves is among the first biological problems studied in physics. Galvani [1] noticed that the legs of dissected frogs made active movements when their nerves were connected to a battery. He called this phenomenon “animal electricity”. After learning about these experiments, Volta [2] stated that nerve pulses are electrical conduction phenomena. Helmholtz [3] performed the first measurements of the propagation velocity of nerves and found a value of about 30 m/s in the nerves from frog muscle. In the second half of the 19th century Ostwald [4] and others developed the theory of osmosis and electrochemistry, and attempts were made to relate the flux of ions through the nerve membranes to the propagating action potential [5]. This finally resulted in the model by Hodgkin and Huxley [6] from 1952 that is the presently accepted model for the nerve pulse. This model relies on ionic currents through ion-selective objects (ion channel proteins) and the membrane capacitor. In the context of their model, the conductance of these objects displays rather complex voltage and time dependences that enter the differential equation via a set of empirical parameters. Those parameters are taken from experiment but do not yet have a satisfying theoretical justification. Even though Hodgkin and Huxley [6] did not originally specify the ion-conducting objects, it was clear from the line of argument that these objects were expected to be specific proteins called ion-channels. In 1976, Neher and Sakmann using the patch clamp technique described such channels microscopically [7]. Nowadays, many investigators all over the world investigate the properties of ion channels. In 1998, MacKinnon and collaborators crystallized the potassium channel and suggested a pathway for the potassium through a pore within the protein [8]. Thus, the Hodgkin-Huxley model seemingly finds support in independent experiments. The model by Hodgkin and Huxley is a purely electrical description based on conductors (ion channels and the cytosol of the nerve axon) and on a capacitor, which is the lipid membrane. It does not contain any thermodynamical variable except the membrane potential. Entropy, temperature, pressure and volume do not play a role. There is, however, strong evidence that phenomena during the action potential are not purely electrical. It has been observed by a number of investigators that the dimensions of the nerve change in phase with voltage changes and that the nerve exerts a force normal to the membrane surface [9, 10, 11, 12, 13]. Further, during the action potential lipid membrane markers change their fluorescence intensity and their anisotropy [14, 15]. Most striking, however, is the finding that there are reversible changes in temperature and heat during the action potential [16, 17, 18, 19, 20]. While the Hodgkin-Huxley model [6] contains resistors that should generate heat during the flow of ions, the reversible release and re-absorption of heat does not find a satisfactory explanation within this model [21]. Recently, Heimburg and Jackson [22, 23] proposed that the action potential is rather a propagating density pulse (soliton), and therefore an electromechanical rather than a purely electrical phenomenon. This corresponds to a localized piezoelectric sound pulse within the nerve membrane. Such a model is able to explain most of the thermodynamical findings on nerves and results in the correct propagation velocity of about 100 m/s for a myelinated nerve. Interestingly, Hodgkin and Huxley themselves proposed the possibility that the nerve pulse is a propagating mechanical wave [24].
Anesthesia is a phenomenon that seems to be closely related to the action of nerves. Since the standard model of nerve action is based on the action of ion channels, most research has been dedicated to investigating the influence of anesthetics on such proteins. However, an old finding by Meyer [25] and Overton [26, 27] states that the action of anesthetics is linearly related to their solubility in membranes. This includes the noble gas Xenon. Although some ion channels are influenced by some anesthetics, there is no quantitative correlation with the well-documented Meyer-Overton rule [28].
In this paper we briefly discuss some of the historical findings on nerves, including the Hodgkin-Huxley model and thermodynamic data on nerves. It is shown that the Hodgkin-Huxley theory does not describe the thermodynamics of the nerve pulse correctly. Instead, the propagation of a density pulse is shown to explain in a quantitative manner many features of the nerve pulse, including density, fluorescence anisotropy and heat changes. Finally, we show that such a description leads to a satisfactory quantitative explanation of general anesthesia.
2 The Hodgkin-Huxley model
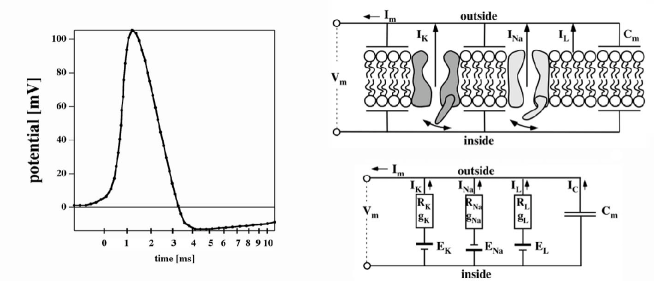
In the Hodgkin-Huxley model [6] the propagation of a voltage pulse is the consequence of ion currents through the membrane and along the nerve axon. The electrochemical potential (Nernst potential) across the nerve membrane balances the ion concentration differences on both sides of the nerve axon. The transient opening of voltage-dependent ion channels leads to a related transient voltage change that can propagate. Most of the data on which the Hodgkin-Huxley model is based originate from voltage-clamp experiments on giant squid axons where the trans-membrane voltage is kept constant along the whole length of the axon.
The relation for the ion current through the membrane under voltage clamp conditions is based on an equivalent circuit picture that is schematically shown in Fig. 1. Describing ion channels by resistors and the membrane as a capacitor, one obtains
| (1) |
where is the current through the membrane, and is the capacitance of the membrane (typically on the order of ). The , and are resting potentials that depend on ion concentrations. The and are the conductances of K-channels and Na-channels, and describes the leakage currents. The conductances are not constants but rather complicated functions of time and voltage, and , that have been empirically fitted by Hodgkin and Huxley [6] using many ad hoc parameters. Therefore, the seemingly simple eq. (1) is in fact very complicated, and all the mysteries of the observed phenomena are hidden in the functional dependences of the conductances on time and voltage. The trans-membrane current in eq. (1) is given as the sum of a capacitive current and an Ohmic current. The capacitive current is given by
| (2) |
A closer look at the right hand side of eq. (1) indicates that the capacitive current used by Hodgkin and Huxley consists only of the term and that the capacitance was assumed to be constant. Therefore the term has been neglected. This is probably not correct since we will show in the next section that the thickness of nerves changes during the pulse. Note in particular that the function dCm/dt carries the same units as the conductances, . For this reason it may not always be trivial to distinguish currents through resistors and capacitive currents in an experiment during a propagating pulse [29, 30].
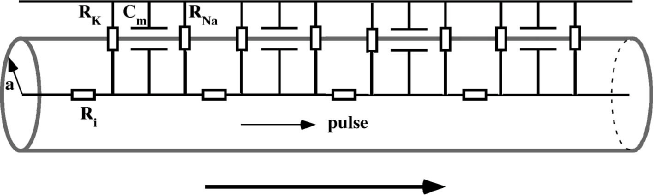
To arrive at a wave equation for the nerve axon, Hodgkin and Huxley assumed that the total current is the sum of the trans-membrane current and the current along the axon. A further ad-hoc assumption is that a propagating solution exists that fulfills a wave equation. Hodgkin and Huxley6 arrived at the following differential equation for the propagating nerve pulse:
| (3) |
where is the radius of the axon and is the resistance of the
cytosol within the nerve. This equation introduces a dependence of
the pulse propagation on the nerve radius. The elements of the
propagating pulse are summarized in Fig. 2 that shows the equivalent
circuits as an in-line arrangement of many local equivalent circuits
as shown in Fig. 1. Due to the voltage and time dependence of the
conductances in eq. (3) this differential equation can only be
solved numerically. Hodgkin and Huxley found a convincing agreement
between the calculated and the observed pulse shape for the squid
axon that only contains K- and Na-currents.
One immediate implication of the Hodgkin-Huxley model is that ion currents through the nerves should produce heat. Electrical currents through resistors generate heat, independent of the direction of the ion flux. The heat production in such an experiment therefore should always be positive if the Hodgkin-Huxley model is taken seriously and the analogy of ion currents through protein pores and Ohmic currents is assumed to be correct. The heat dissipation should be related to the power of a circuit through the resistor, i.e. for each of the conducting objects in all phases of the action potential. In the next section we will show that this is not in agreement with the experiment.
3 Thermodynamics of nerve pulses
The Hodgkin-Huxley model [6] is a purely electrical theory. It is based on equivalent circuits and makes use of capacitance, resistors and ionic currents. It is not a thermodynamic theory. It does not explicitly contain temperature and heat or other thermodynamic variables such as pressure, volume and the chemical potentials of molecules dissolved in the membrane (e.g. anesthetics). However, there are many reports in the literature indicating that, in addition to the electrical response of nerves, other variables also change, for example the thickness, the enthalpy and heat content of the nerve. In the following we briefly discuss some of these data.
3.1 Thickness and forces
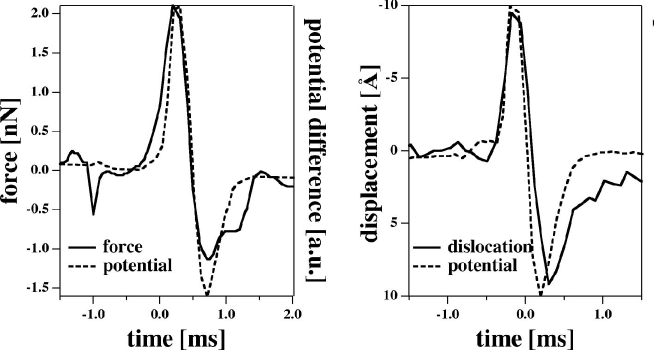
I. Tasaki and collaborators have published several studies on the mechanical and thermodynamic properties of various nerves [9, 10, 11, 12, 13, 14, 19, 20, 31]. For all nerves investigated, they found that the action potential (i.e. the voltage pulse) is accompanied by changes in the dimensions of the nerve. In Fig.3 (right) it is shown that the voltage pulse of a squid axon is exactly proportional to the change of its thickness [9, 10]. In the example this thickness change is about 1 nm. Further, the same authors showed that during this pulse a considerable force acts on a piston that was brought into contact with the nerve surface (Fig.3, left). The force on that piston (0.01 cm2 cross section) was shown to be about 2 nN at the voltage peak maximum.
3.2 Fluorescence changes, optical changes and alterations in lipid state
During the action potential not only thickness and pressure on a piston change but also the state of the membrane as measured by the fluorescence changes of lipid dyes. Tasaki and coworkers [14, 15] found that in various nerves under the influence of the action potential the fluorescence intensity change is proportional to the voltage pulse (see Figure 4).
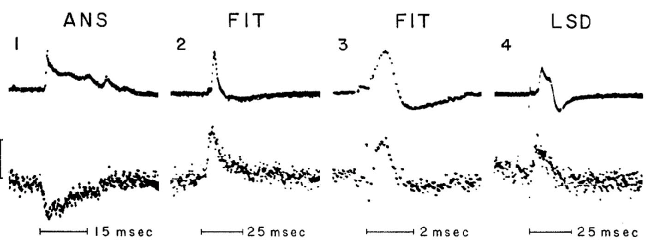
In the same paper they showed that the fluorescence anisotropy of these markers also changes (data not shown). The fluorescence anisotropy is a measure of the rotational mobility of the fluorescence markers. A lower anisotropy indicates faster movement, whereas a high anisotropy indicates slower movement. Since the fluorescence anisotropy changed during the voltage pulse, Tasaki and collaborators [14] concluded that the viscosity of the membrane changes during the nerve pulse. Note that they published this paper prior to the fluid mosaic model by Singer and Nicholson [32] from 1972 that established the present view of the biological membrane. The concept of phase transitions in lipid membranes was not established. One should conclude from the fluorescence data that significant changes in the order of the lipid membrane take place. The evidence for phase transitions during nerve pulses has been discussed in more detail by Kinnunen and Virtanen [33] and Tasaki and coworkers [31, 34]. In this context it should be noted that also changes in light scattering and turbidity accompany the action potential that clearly cannot be related to membrane voltages [14, 35].
3.3 Reversible heat changes and their meaning
The most striking thermodynamic findings in nerves during the action
potential are reversible temperature changes and corresponding changes
in the heat released during the nerve pulse. The first to carefully
describe the heat changes was A. V. Hill who published a series of
papers in the 1920 s and 1930 s. Abbott et al. [16]
showed that the heat release during the first phase of the action
potential is nearly exactly compensated by a heat uptake in the second
phase of the action potential. This effect was found in
non-myelinated [16, 17, 18, 19]
and in myelinated [16, 20] nerves. Interestingly,
Hill and collaborators found that the reversible heat release in
myelinated nerves originates from the complete nerve and not only from
the nodes of Ranvier [16]. They found it most likely that the complete
membranes of the myelinated nerves contribute to the heat release and
that one should therefore consider an active role of the myelin sheet
to the nervous impulse. Saltatory conduction that is the textbook
picture for pulse propagation in myelinated nerves, in contrast,
attributes a special role to the nodes of Ranvier. Other authors
reproduced the findings on reversible heat release, e.g. Howarth et
al. [17], Ritchie & Keynes [18] or
Tasaki and coworkers [19, 20, 34]. It has to
be acknowledged that these experiments are difficult and the observed
temperature changes are small (of order 100mK).
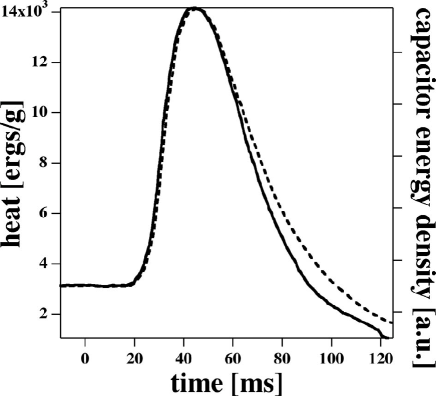
One important result demonstrated in Fig. 5 shows the integrated heat release during the action potential and the square of the voltage changes related to the free energy of the membrane capacitor [18]. These two functions were found to be qualitatively nearly identical. However, the heat reversibly released during the action potential was several times larger than the energy of the capacitor so that it can be excluded that the reversible heat release is explained by the charging of the membrane capacitor. This is the only semi-reversible element in the Hodgkin-Huxley model [6]. Further, the heat after the whole pulse returns to the baseline in phase with voltage changes. Thus, after the nerve pulse no net heat was dissipated within experimental error. Control experiments indicate that heat is not lost by thermal conduction into the environment but is rather reabsorbed by the nerve in the second phase of the action potential.
The reversible heat release is a remarkable and very meaningful finding. It suggests that the physical processes underlying the nerve impulse are reversible processes. The Hodgkin-Huxley model, however, is based on irreversible processes, in particular on the exchange of potassium and sodium ions along ion gradients. The model does not contain any true reversible processes. Even if the membrane capacitor was reversibly charged, this would not result in a reversible heat change unless the flux of the ions was also reversible, which is not the case within the framework of the model. Taking the equivalent circuit picture seriously, the flux of charges through a resistor should rather result in a heat release independent on the direction of the flux of the ions. The flux of potassium and of sodium should both dissipate heat. This is obviously not in agreement with the thermodynamic results obtained from real nerves. The finding of changes in lipid state and in thickness also does not find a satisfactory explanation within the Hodgkin-Huxley model.
4 Propagating density pulses
In the following we show that the thermodynamic findings described above find an explanation if one assumes that the action potential consists of a propagating density pulses. Heimburg and Jackson [22] showed that one could obtain stable propagating density pulses in cylindrical lipid membranes provided that the membrane exists in a physical state slightly above a melting transition. In the following we outline the underlying basis of this model.
4.1 Melting transitions in biological membrane
Many biological membranes display melting transitions slightly below
body temperature. In Fig. 6 the melting transition of native E.coli
membranes (including all their proteins) are shown. One finds a
pronounced lipid-melting peak slightly below body temperature that is
affected by growth temperature of the bacteria, by hydrostatic
pressure and pH [36]. Further, one finds several protein unfolding peaks
slightly above body temperature. It is a remarkable fact in itself
that Nature chooses living systems to exist so close to the
cooperative transitions of their molecules, including membranes,
proteins and DNA. The underlying theme of this paper is that this is
of major biological relevance.
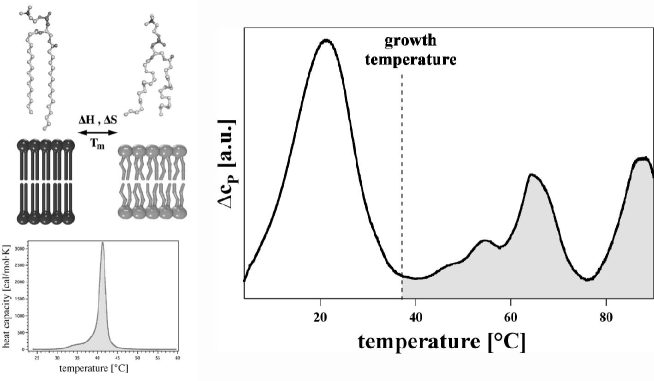
The melting transitions of such membranes display a melting temperature, Tm, a melting enthalpy, , and a melting entropy, , given by . Further, volume and area of the membrane change during the melting process. For the model lipid DPPC (dipalmitoyl phosphatidylcholine) that is the major lipid component of lung surfactant one finds: K, kJ/mol, J/molK, and . These values give the order of magnitude but vary between different lipid species.
4.2 The relation between heat capacity and compressibility
The enthalpy, specific volume and specific area changes in a lipid melting transition can be written as
| (4) | |||||
is the temperature-dependent enthalpy of the pure gel phase and the function is the excess enthalpy of the transition. Similarly, and are the temperature-dependent specific volume and area of the gel phase. and are the excess volume and area changes associated with the melting transition. It has been found experimentally that the volume and area changes in the chain melting transition are proportional to the changes in enthalpy [37, 38].
| (5) |
where the constants and are approximately the same for various artificial lipids and for biological membranes. Using the fluctuation dissipation theorem it is easy to show that excess heat capacity changes within the lipid melting transition is proportional to the excess isothermal volume and area compressibility:
| (6) |
The heat capacity can easily be measured in calorimetry. The functions and are the temperature dependent compressibilities of the pure phases that have to be taken from literature. One can see that both volume and area compressibilities assume maxima at the temperature where the heat capacity is maximum. The adiabatic compressibilities relevant for sound propagation can be determined when the isothermal compressibilities are known. They assume the form [37]
| (7) |
where the heat capacity is that of the membrane plus the aqueous environment that transiently absorbs heat from the membrane upon compression. If the compression is very slow, will be very large and therefore in the limit of very slow compression and . It has been found experimentally that the adiabatic compressibility obtained for periodic perturbations with a frequency MHz can be determined accurately if the heat capacity is assumed be the total heat capacity of the lipid membrane alone. It is obviously smaller than the isothermal compressibility. Therefore, one has to conclude that the adiabatic compressibility is in general frequency dependent and, thus, dispersion is present. The frequency dependence of relaxation phenomena in the lipid melting transition has also been documented in experiments [39] and justified theoretically [40]. It is also obvious from eqs. (4.2) (6) that the compressibility is a nonlinear function of the membrane density [22]. If the adiabatic compressibility is known one can calculated the sound velocity, e.g. for the lateral sound velocity within the membrane plane
| (8) |
The lateral area density of the membrane and the enthalpy are related. Therefore the adiabatic compressibility is a function of the area density of the membrane, and it follows that the sound velocity is a nonlinear function of the density that, close to the lipid melting transition, can be expanded into a power series such that
| (9) |
where is the sound velocity in the fluid phase of the membrane. Here, and are parameters to be determined from the known dependence of the sound velocity on the density. For unilamellar DPPC membranes slightly above the transition one finds experimentally that m/s (the lateral sound velocity in the fluid phase at low frequencies), and (for details see ref. [22]). Here, is the lateral area density in the fluid phase of the membrane slightly above the melting point. Similar values were found for lung surfactant and native E.coli membranes.
4.3 Propagating solitons
We now consider the propagation of a density pulse in a cylindrical membrane along the axis, x. The hydrodynamic equation for the propagation of such a density pulse in the presence of dispersion [22, 23] is given by
| (10) |
describing the changes of the lateral membrane density as a function of time and space. The second term is chosen ad hoc to mimic the frequency dependence of the sound velocity in a linear way using a parameter h (for details see ref. [22]). This parameter is the only one that has not yet been determined by experiment. We will see below that the only role of the parameter h is to set the linear scale of the propagating pulse.
We have shown above that the sound velocity is a function of the area density, . Introducing eq. (9) into eq. (10) we obtain
| (11) | |||||
and after the coordinate transformation (introducing the propagation velocity, ) we arrive at the time independent form describing the shape of a propagating density excitation:
| (12) | |||||
This equation has a localized analytical solution [23]:
| (13) |
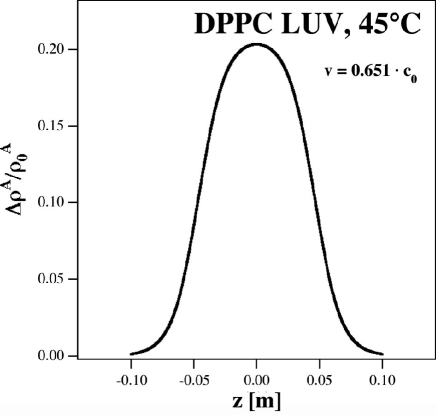
Such localized solutions are known as solitary waves or solitons. A typical soliton profile is shown in Fig. 7. The minimum velocity vmin allowed by eq. (13) is found to be
| (14) |
The minimum velocity for a soliton in DPPC membranes is found to be m/s, which is very close to the velocity of the action potential found in myelinated nerves. The minimum velocity is the velocity of the soliton when its amplitude reaches the maximum value of
| (15) |
corresponding to an overall density change of . Solitons with larger density change do not exist. The total area change when going through a melting transition is (for DPPC). Thus, at maximum amplitude the soliton forces the lipid membrane by about 85% through the melting transition. This will cause a transient heat release corresponding to 85% of the melting enthalpy (which is on the order of 35kJ/mol or 13 kT per lipid). Simultaneously, the thickness of the membrane will change by 85% of the thickness change in the transition from fluid to gel (7.4 Åfor DPPC). Since the soliton is linked to changes in lipid state the fluorescence anisotropy will also change. It is well known that the anisotropy (related to the rotational mobility) is higher in the gel phase then in the fluid phase. Precisely these changes have all been found in real nerves under the influence of the action potential [14, 31] (see sections 3.1, 3.2 and 3.3). The predicted order of magnitude of these changes matches the data found for such nerves.
4.4 Electromechanical coupling
It seems evident that the solitons described above have many similarities with real nerve pulses and can describe their thermodynamic properties well. However, the action potential is known to be a propagating voltage pulse with a net voltage change of about 100mV. In the following we will argue that this voltage change is a consequence of the change in area density of the membrane in a manner similar to the propagation of a piezoelectric wave. The membranes of biological membranes contain charged lipids. Depending on cell and organelle the fraction of charged lipids is between 10% and 40%. Some membranes are especially rich in charged lipids, e.g. mitochondria. Typically, most of these charged lipids are found on the inner membrane, generating an electrical field. To make an estimate of the size of the potential change, we therefore assume that the inner membrane of a nerve contains 40% charged lipids and the outer membrane contains only a very small fraction of charged lipids (average of both leaflets 20%). We ignore the contributions from proteins that clearly are also present. According to the Gouy-Chapman theory for the potential of surfaces in electrolytes, the potential of a charged surface at high ionic strength is given by
| (16) |
This is the low potential limit of the Gouy-Chapman theory [41]. The dielectric constant in vacuum is , and the relative permittivity for water. Here, is the Debye constant that depends on the ionic strength. For a monovalent salt it is given by
| (17) |
where C is the elementary charge and c is the concentration of the monovalent salt. For c=150mM NaCl the Debye constant assumes a value . For a fixed number of charged lipids the charge density, , is different in the fluid and in the gel phase of the lipids because the respective lipid areas differ by about 24%. Therefore, one expects changes in the electrostatic potential of the membrane during a propagating density pulse. In piezoelectrics, voltage changes and density changes are tightly coupled. Such coupling between lateral density and electrostatic potential is also known as electromechanical coupling. It is also linked to changes in capacitance. Electromechanical coupling in membranes was first proposed by Petrov [42, 43] and has been discussed by various authors as relevant in hair cells [44, 45]. Here, the potential of the lipid membrane is discussed. A biological membrane contains on average 50 weight percent of protein, which also carry charges. The total potential of the inner and outer leaflet is the sum of lipid and protein contributions. The contribution of the proteins will lead to an equilibrium resting potential of the total membrane that is different from that of the pure lipid membrane. However, it is most likely that only the lipids undergo changes in area during the pulse. The potential of the inner membrane at the lipid surface under the above conditions and the simplifying and somewhat arbitrary assumptions regarding lipid distribution is
| (18) |
resulting in a voltage change of at the soliton peak. That is of the same order as the voltage changes in the action potential (which is about 100mV). This is a very rough estimate since the exact charge of the lipid membrane on both sides of the membrane is not known and protein charges have not been considered. However, it seems as if the changes in the membrane area during the action potential are of the right order to account for the observed voltage changes during the action potential. Furthermore, membrane thickness changes during the action potential, thereby changing the capacitance. The assumption of a constant capacitance, as made by Hodgkin-Huxley, therefore cannot be correct (cf. eqs. 1 and 2). In summary, it seems plausible that mechanical solitons can generate voltage changes comparable to those observed during the action potential. The exact values remain to be determined by experiment.
5 Anesthesia
If one assumes that the soliton model for the nerve pulse is a valid description of the nerve pulse containing its thermodynamics one immediately arrives at a quantitative explanation for anesthesia [36]. Anesthesia as a tool for painless surgery by use of diethyl ether was first publicly demonstrated in 1846 by William Morton from the Massachusetts General Hospital [28]. This method was adopted within short time all over the world. Many other anesthetics had been studied in the following decades, including both gaseous (e.g. nitrous oxide = laughing gas) and liquid anesthetics (e.g. the alkanols from ethanol to decanol). A large variety of chemically distinct molecules also cause anesthesia, e.g. barbiturates or halogenated alkanes.
5.1 The Meyer-Overton rule
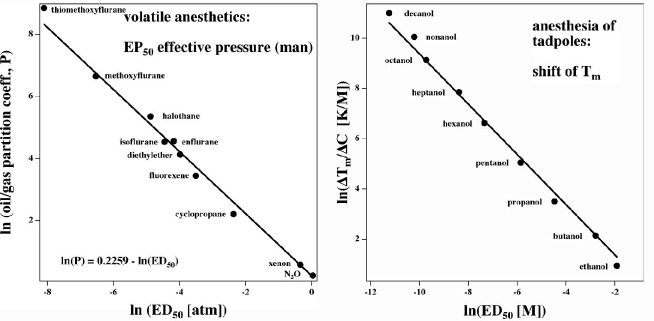
About 50 years after Morton, Meyer [25] and Overton [26, 27] independently found that the critical anesthetic dose of anesthetics is linearly proportional to their solubility in olive oil. The critical anesthetic dose (or ) is defined as the bulk concentration of anesthetic in the air (in this case equivalent to partial pressure) or in water at which 50% of the organisms studied are motionless. Overton suggested that this finding was related to the solubility of the molecules in the cell membrane whose structure was not known at the time. The Meyer-Overton rule covers a large range of anesthetics with membrane partition coefficients ranging over 5-6 orders of magnitude, from laughing gas (N2O) and the noble gas Xenon, the liquid alcohols to modern anesthetics such as liducaine. The partition coefficients of all these molecules lie within error on a straight line with slope 1 when plotted versus critical anesthetic dose (see Fig. 8, left).
Even after more than 160 years the effect of anesthetics on organisms remains unexplained. A number of functions of cells are affected by anesthetics, including the membrane permeability, hemolysis, nerve function and the function of ion channels and proteins totally unrelated to anesthesia, e.g. firefly luciferase. Since the most obvious effect is on consciousness much of the research has focused on the action of anesthetics on nerves. The Hodgkin-Huxley model [6] is based on the opening and closing of ion channels, and it seems straightforward to investigate the action of anesthetics on ion channels. In fact, it has been observed that some ion channel properties are influences by anesthetics. However, this effect is not quantitative and does not follow the Meyer-Overton rule. Some channels are affected by some anesthetics but not by others. As an example, voltage gated sodium and potassium channels are slightly inhibited by halogenated alkanes and ethers but not by Xenon and nitrous oxide, although all these anesthetics follow the Meyer-Overton rule in causing anesthesia [28]. It has to be concluded that protein pictures of anesthesia are not yet satisfactory.
The Meyer-Overton rule suggests that the effect of anesthetics is independent of the chemical nature of the molecule. Since the noble gas Xenon lies on the same straight line as halothane or the liquid anesthetics, one can essentially rule out specific binding effects, which are the basis of the protein models (see also discussion).
5.2 Melting point depression
It is known that anesthetics have a pronounced effect on lipid melting transitions. Typically, with addition of anesthetics to the bilayers, transitions shift to lower temperatures in a linear relation with the anesthetic concentration. Heimburg and Jackson [36] have shown that this effect can be described by accurately by the well-known phenomenon of freezing point depression. If one assumes that anesthetics molecules are readily soluble in fluid lipid membranes and insoluble in the gel membrane, one arrives at following law for the freezing point depression
| (19) |
where is the molar fraction of anesthetics in the fluid lipid membrane, is the melting point of the lipid membrane and H is the melting enthalpy. The derivation of this equation can be found in any physical chemistry textbook. The membrane concentration of anesthetics at the critical dose, , is related to the partition coefficient via
| (20) |
where is the partition coefficient between membrane and water, is the critical anesthetic concentration, and is the molar volume of the lipids (about 0.75 l/mol). The two equations above describe the behavior of many anesthetics. D. Kharakoz [46] has collected data for various anesthetics, some of which are displayed in Fig. 8 (right). Shown is the concentration dependence of the melting point as a function of the critical anesthetic dose for tadpoles. The melting point depression for all anesthetics (shown here are alkanols) lie on a straight line when plotted versus the critical anesthetic dose. The slope of the curve indicates that the shift of the transition temperature at critical anesthetic dose is K for all anesthetics that follow the Meyer-Overton rule, independent of the chemical nature of the drug [36, 46]. The Meyer-Overton rule therefore can be reformulated as: The anesthetic potency of anesthetics is proportional to their ability to lower the melting point of lipid membranes. It is clear that within the soliton model for nerve pulses the melting points play an essential role. The assumption in the following is that the lipid melting point plays an important role in the control of biological membranes.
5.3 Pressure reversal
If one assumes that the lipid melting point is important for biological function and that the effect of anesthetics is related to their effect on melting points, it is interesting to compare this to other physical properties that also influence melting points, most notably the influence of pressure. It has long been known that pressure influences the melting points of membranes by shifting them to higher temperatures. The pressure dependence of such transitions is described by [38]
| (21) |
where is a constant that is roughly the same for all lipids, lipid mixtures and biological membranes [37, 38]. This equation indicates that a lipid membrane with a K (dipalmitoyl phosphatidylcholine) shifts its transition by 1 K to higher temperatures upon application of 40.8 bar hydrostatic pressure. This indicates that a pressure of 24.5 bar should be sufficient to reverse the effect of anesthesia (which corresponds to a shift by 0.6 K to lower temperatures). Pressure reversal of anesthesia has indeed been found, first by Johnson et al. [47]. If tadpoles are anesthetized at 3 times the critical anesthetic dose of ethanol, they wake up upon application of 150 bars of hydrostatic pressure. The pressure reversal of anesthesia is well documented in the literature.
5.4 Free energy of the membrane
The free energy difference between gel and fluid phase is the free energy that must be provided to shift the lipid membrane through its phase transition. It is given by
| (22) |
making use of the identity . This equation indicates that the free energy difference between the two phases is linearly dependent on the difference of the experimental temperature, , and the melting temperature, . Now, we have shown in the previous section that is influenced by both anesthetics concentration and by pressure. The melting temperature is changed by anesthetics and pressure in the following manner
| (23) |
where is the transition temperature at atmospheric pressure and in the absence of anesthetics. We finally obtain
| (24) |
If the melting transition of the lipid membrane is to play a relevant role for biological function, it follows that biological function should be the same when is the same. Therefore, the condition for pressure reversal of anesthesia is or
| (25) |
The numbers obtained from this equation are of an order very similar to that obtained in experiments. Data from octanol and DPPC membranes as well as the equations above suggest that a pressure of 24.5 bar reverses anesthesia [36]. The data from Johnson on tadpoles in an ethanol solution corresponding to three times the anesthetic dose was reversed by 150 bars of pressure [47]. Our calculation yields 73.5 bars, assuming a membrane partition coefficient for ethanol of 0.6 (which is subject to an error of the order of a factor 2).
6 Discussion
We have suggested here that the Hodgkin-Huxley model
[6] for the action potential does not provide a
satisfactory description of nervous impulse because it does not
include the mechanical and optical changes associated with the action
potential. Further, it is clearly inconsistent with the thermal
response. The initial heat release and subsequent re-absorption
studied by a number of authors
[16, 17, 18, 19, 20] points
rather to a reversible physical phenomenon that conserves entropy. In
contrast, the Hodgkin-Huxley model is based on the flux of currents
through resistors that should heat the membrane independent of the
nature of the current and its direction. Therefore, we have proposed
an alternate model based on the known mechanical and thermal features
of artificial and biological membranes. It was shown that under
physiological conditions stable mechanical solitons could propagate
and display reversible heat release, changes in membrane thickness,
changes in membrane order and reversible membrane potential changes.
All these changes have been observed in experiments. In particular
the reversible heat release and the overall conservation of entropy is
a feature typical of sound propagation. It should be noted that we
use the term sound propagation in a general sense that includes all
changes of the thermodynamic variables that accompany a mechanical
compression according to Maxwell s relations. In such a description,
the simultaneous occurrence of density changes, voltage changes, and
heat release is a surprise but rather a necessary consequence of
thermodynamics. The Hodgkin-Huxley model seems to be in agreement
with fluxes through ion channel proteins. However, the currents
through such channels fall short of presenting an explanation in the
sense of a physical theory based on first principles. The
conductances of the channels contain many parameters that cannot be
justified theoretically. Therefore, their seemingly simple
description relies on objects that contain all the unexplained
features in the form of parameters. For this reason Hodgkin and
Huxley originally recommended treating their model with care. They
state in their seminal paper from 1952
[6]:”The agreement must not be taken as
evidence that our equations are anything more than an empirical
description of the time-course of the changes in permeability to
sodium and potassium. An equally satisfactory description of the
voltage clamp data could no doubt have been achieved with equations of
very different form, which would probably have been equally successful
in predicting the electrical behavior of the membrane. …the
success of the equations is no evidence in favour of the mechanism of
permeability change that we tentatively had in mind when formulating
them.” In this paper we have, in fact, shown that many changes can
be explained by totally different physical mechanisms that result in
similar equations for the pulse propagation. Hodgkin was clearly
aware of the problems generated by the finding of a reversible heat
releases during the action potential. He wrote in his textbook ‘The
conduction of the nervous impulse’ [21]: “In
thinking about the physical basis of the action potential perhaps the
most important thing to do at the present moment is to consider
whether there are any unexplained observations which have been
neglected in an attempt to make the experiments fit into a tidy
pattern. …perhaps the most puzzling observation is one made by
A.V. Hill and his collaborators Abbott and Howarth
(1958).[16] …Hill and his colleagues found that it
(the heat release) was diphasic and that an initial phase of heat
liberation was followed by one of heat absorption. a net cooling on
open-circuit was totally unexpected and has so far received no
satisfactory explanation.” Howarth et al. [17]
concluded from their finding of heat release and subsequent heat
uptake:”It seems probable that the greater part of the
initial heat results from changes in the entropy of the nerve membane
when it is depolarized and repolarized.” Reversible entropy changes,
however, are not a feature of textbook pictures of nerve pulses.
Here, we have followed Hodgkin s suggestion and searched for ways to
explain the reversible heat. Slightly below physiological
temperatures, there exist chain-melting transitions of the membrane.
It is interesting to note that these transitions occur at much lower
temperatures in the absence of the proteins. For instance, the
melting point of E.coli lipid extracts is about 20K lower
than that of the native membrane in the presence of all their lipids.
Therefore, the presence of proteins seems to play an essential role in
fine-tuning the thermodynamics of biological membranes. Besides their
role as catalysts, proteins also possess chemical potentials that are
thermodynamics variables. They contribute to the behavior of
membranes in a manner similar to temperature, pressure, pH and other
variables. The presence of cooperative lipid transitions forms the
basis for the possibility of density pulses that propagate along the
nerve axon. One short-coming of our model is that it does not yet
include a frictional term even though one may expect that, due to the
flux of lipids and changes in diameter of the nerve, a proper
hydrodynamic treatment should yield in a dampening of the pulse. This
problem remains unanswered in the context of our model, mainly due to
the lack of detailed data on the dimensional changes in nerves.
However, experiments show that such density pulses propagate
[9, 10] in real nerves, and the near-complete
reversal of the heat [16, 17, 18]
suggests that friction is small. Within the soliton model proteins do
not play a role as channels or as active components. Rather, they
tune the thermodynamics of the membrane. An important question is how
such a mechanical soliton can be generated in a membrane. Since the
soliton pushes the membrane through its chain melting transition,
everything that moves membranes through transitions should be able to
generate a pulse. All physical changes that push the transition away
from physiological conditions should inhibit pulses. As an example,
local cooling of a nerve has been shown to induce nerve firing,
whereas temperature increase inhibits pulse conduction
[31]. Due to the electromechanical coupling described
in section 4.4, changes in trans-membrane voltage are also
potentially able to generate pulses. Further, a local decrease of pH,
increase in pressure or increase in calcium concentration all have the
potential to trigger pulses because all of these changes increase the
phase transitions of biomembranes. Most interestingly, anesthetics
inhibit pulse generation due to their property of lowering phase
transitions. Since ion channels do not play an active role in our
description of nerve pulses, it is obvious that the action of
anesthetics requires a different explanation than their action on ion
channels. The famous 100-year old Meyer-Overton correlation
[25, 26, 27, 28] states that the
action of anesthetics is, within error, strictly proportional to their
solubility in lipid membranes. This law is valid over 6 orders of
magnitude in the membrane/air and membrane/water partition
coefficient. This law remains an elegant and valid means to determine
the effectiveness of an anesthetic [28]. It basically excludes the
notion that the action of anesthetics can be linked to specific
binding of the drug to a receptor. The argument is simple: The
binding of two molecules is described by the free energy, which is a
function of state. If the action of anesthetics is exactly
proportional to the concentration of drugs in the membrane independent
on chemical nature of the drug as follows from the Meyer-Overton
correlation, the binding constant of all anesthetics to receptors must
be identical, including that of the noble gas Xenon. Since noble
gases cannot bind specifically, the same must be concluded for all
other anesthetics that follow the Meyer-Overton rule. The
experimental finding is that halogenated alkanols act very differently
on ion channels than Xenon or nitrous oxide. Thus, protein models are
clearly not consistent with the well-documented Meyer-Overton
correlation. Although protein models are currently quite popular,
they cannot fulfill the basic thermodynamic requirements for
anesthetics that follow the Meyer-Overton correlation. Due to the
above argument it is unlikely that the action on ion channels is
related to anesthesia. Here, we have outlined the thermodynamic
theory of how anesthetics influence the phase behavior of lipid
membranes via a well-known unspecific phenomenon known as
freezing-point depression. It states the lowering of the melting
point is proportional to the membrane concentration of the anesthetic
drug. Thereby, we attribute a physical meaning to the Meyer-Overton
rule that was not provided by Overton himself. By this mechanism
anesthetics alter the features of propagating solitons in a
quantitative manner. More specifically, they alter the amount of free
energy that has to be provided to generate a pulse. We found that it
is linearly dependent on the distance between physiological
temperature and the transition in the nerve membrane. This approach
admits the possibility of finding strict thermodynamics relations
between various thermodynamics variables, including the pressure
reversal of anesthesia that can be calculated in quantitative terms
[47].
It seems unlikely that all of these quantitative correlations can be
found experimentally without thermodynamics being an essential player
in the description of both the action potential and the action of
anesthesia. Indeed, simple thermodynamics seems to contain a complete
description of such phenomena.
Acknowledgments: We thank Dr. E. Neher (Max Planck Institute, Göttingen) for discussing the problem of friction of the solitons, and Dr. I. Tasaki (NIH, Bethesda) and Dr. K. Kaufmann (Göttingen) for helpful discussion on the mechanical nature of nerve pulses. Dr. B. Lautrup (NBI, Copenhagen) contributed the analytical solution of the propagating soliton and many hours of discussion.
References
- [1] Galvani, A., 1791. Abhandlung über die Kräfte der Electricität bei der Muskelbewegung, volume 52 of Ostwald’s Klassiker der exakten Wissenschaften (1894).
- [2] Volta, A., 1796-1800. Untersuchungen über den Galvanismus, volume 118 of Ostwald’s Klassiker der exakten Wissenschaften (1900).
- [3] von Helmholtz. 1852. Messungen über fortpflanzungsgeschwindigkeit derreizung in den nerven. Arch. Anat. Physiol. wiss. Med. 199–216.
- [4] Ostwald, W. 1890. Elektrische Eigenschaften halbdurchlässiger Scheidewände. Z. Phys. Chem. 6:71–82.
- [5] Bernstein, J., 1912. Elektrobiologie. Die Lehre von den elektrischen Vorgängen im Organismus auf moderner Grundlage dargestellt. Vieweg & Sohn.
- [6] Hodgkin, A. L., and A. F. Huxley. 1952. A quantitative description of membrane current and its application to conduction and excitation in nerve. J. Physiol. 117:500–544.
- [7] Neher, E., and B. Sakmann. 1976. Single-channel currents recorded from membrane of denervated frog muscle fibres. Nature 260:779–802.
- [8] Doyle, D. A., J. Morais, J. M. Gulbis, A. L. Cohen, B. T. Chait, and R. MacKinnon. 1998. The structure of the potassium channel: Molecular basis of k+ conduction and selectivity. Science 280:69.
- [9] Iwasa, K., and I. Tasaki. 1980. Mechanical changes in squid giant-axons associated with production of action potentials. Biochem. Biophys. Research Comm. 95:1328–1331.
- [10] Iwasa, K., I. Tasaki, and R. C. Gibbons. 1980. Swelling of nerve fibres associated with action potentials. Science 210.
- [11] Tasaki, I., and M. Byrne. 1990. Volume expansion of nonmyelinated nerve fibers during impulse conduction. Biophys. J. 57:633–635.
- [12] Tasaki, I., and K. Iwasa. 1982. Further studies of rapid mechanical changes in squid giant axon associated with action potential production. Jap. J. Physiol. 32:505–518.
- [13] Tasaki, I., K. Iwasa, and R. C. Gibbons. 1980. Mechanical changes in crab nerve fibers during action potentials. Jap. J. Physiol. 30:897–905.
- [14] Tasaki, I., L. Carnay, and A. Watanabe. 1969. Transient changes in extrinsic fluorescence of nerve produced by electric stimulation. Proc. Natl. Acad. Sci. USA 64:1362–1368.
- [15] Tasaki, I., A. Watanabe, R. Sandlin, and L. Carnay. 1968. Changes in fluorescence, turbidity and birefringence associated with nerve excitation. Proc. Natl. Acad. Sci. USA 61:883–888.
- [16] Abbott, B. C., A. V. Hill, and J. V. Howarth. 1958. The positive and negative heat production associated with a nerve impulse. Proc. R. Soc. London. B 148:149–187.
- [17] Howarth, J. V., R. Keynes, and J. M. Ritchie. 1968. The origin of the initial heat associated with a single impulse in mammalian non-myelinated nerve fibres. J. Physiol. 194:745–793.
- [18] Ritchie, J. M., and R. D. Keynes. 1985. The production and absorption of heat associated with electrical activity in nerve and electric organ. Quart. Rev. Biophys. 392:451–476.
- [19] Tasaki, I., K. Kusano, and M. Byrne. 1989. Rapid mechanical and thermal changes in the garfish olfactory nerve associated with a propagated impulse. Biophys. J. 55:1033–1040.
- [20] Tasaki, I., and P. M. Byrne. 1992. Heat production associated with a propagated impulse in bullfrog myelinated nerve fibers. Jpn. J. Physiol. 42:805–813.
- [21] Hodgkin, A. L., 1964. The conduction of the nervous impulse. Liverpool University Press, Liverpool, UK.
- [22] Heimburg, T., and A. D. Jackson. 2005. On soliton propagation in biomembranes and nerves. Proc. Natl. Acad. Sci. USA 102:9790–9795.
- [23] Lautrup, B., A. D. Jackson, and T. Heimburg. 2005. The stability of solitons in biomembranes and nerves. arXiv:physics/0510106 .
- [24] Hodgkin, A. L., and A. F. Huxley. 1945. Resting and action potentials in single nerve fibres. J. Physiol. London 104:176–195.
- [25] Meyer, H. 1899. Zur Theorie der Alkoholnarkose. Erste Mittheilung. Welche Eigenschaft der Anästhetica bedingt ihre narkotische Wirkung? Arch. Exp. Pathol. Pharmakol. 425:109–118.
- [26] Overton, C. E., 1901. Jena, Germany. English translation: Studies of Narcosis, Chapman and Hall, 1991, R. Lipnick, Ed. Studien über die Narkose. Verlag Gustav Fischer.
- [27] Overton, C. E., 1991. Studies of narcosis. Chapman and Hall. English version of ’Studien der Narkose’ from 1901.
- [28] Campagna, J. A., K. W. Miller, and S. A. Forman. 2003. Mechanisms of actions of inhaled anesthetics. N. Engl. J. Med. 384:2110–2124.
- [29] Kaufmann, K., 1989. Action potentials. http:// membranes.nbi.dk/ Kaufmann/ pdf/ Kaufmann_book4_org.pdf, Caruaru.
- [30] Kaufmann, K., 1989. Lipid membrane. http:// membranes.nbi.dk/ Kaufmann/ pdf/ Kaufmann_book5_org.pdf, Caruaru.
- [31] Kobatake, Y., I. Tasaki, and A. Watanabe. 1971. Phase transition in membrane with reference to nerve excitation. Adv. Biophys. 208:1–31.
- [32] Singer, S. J., and G. L. Nicolson. 1972. The fluid mosaic model. Science 175:720–731.
- [33] Kinnunen, P. K. J., and J. A. Virtanen, 1986. A qualitative, molecular model of the nerve pulse. Conductive properties of unsaturated lyotropic liquid crystals. In Modern Bioelectrochemistry (Gutmann, F., and H. Keyzer, editors), Plenum Press, New York, 457–479.
- [34] Tasaki, I. 1999. Evidence for phase transition in nerve fibers, cells and synapses. Ferroelectrics 220:305–316.
- [35] Cohen, L. B., R. D. Keynes, and D. Landowne. 1972. Changes in light scattering that accompany the action potential in squid giant axon: potential dependent components. J. Physiol. London 224:701–725.
- [36] Heimburg, T., and A. D. Jackson. 2006. The thermodynamics of general anesthesia. arXiv:physics/0510106 .
- [37] Heimburg, T. 1998. Mechanical aspects of membrane thermodynamics. Estimation of the mechanical properties of lipid membranes close to the chain melting transition from calorimetry. Biochim. Biophys. Acta 1415:147–162.
- [38] Ebel, H., P. Grabitz, and T. Heimburg. 2001. Enthalpy and volume changes in lipid membranes. i. the proportionality of heat and volume changes in the lipid melting transition and its implication for the elastic constants. J. Phys. Chem. B 105:7353–7360.
- [39] Mitaku, S., and T. Date. 1982. Anomalies of nanosecond ultrasonic relaxation in the lipid bilayer transition. Biochim. Biophys. Acta 688:411–421.
- [40] Halstenberg, S., W. Schrader, P. Das, J. K. Bhattacharjee, and U. Kaatze. 2003. Critical fluctuations in the domain structure of lipid membranes. J. Chem. Phys. 118:5683–5691.
- [41] Träuble, H., M. Teubner, and H. Eibl. 1976. Electrostatic interactions at charged lipid membranes. i. effects of ph and univalent cations on membrane structure. Biophys. Chem. 43:319–342.
- [42] Petrov, A. G., 1975. Flexoelectic model for active transport. In Physical and chemical basis of information transfer, Plenum Press, New York, 111–125.
- [43] Petrov, A. G., and V. S. Solokov. 1986. Curvature-electric effect in black lipid membranes. Eur. Biophys. J. 139–155.
- [44] Petrov, A. G., and P. N. R. Usherwood. 1994. Mechanosensitivity of cell membranes. Eur. Biophys. J. 23:1–19.
- [45] Raphael, R. M., A. S. Popel, and W. E. Brownell. 2000. A membrane bending model of outer hair cell electromotility. Biophys. J. 78:2844–2862.
- [46] Kharakoz, D. P. 2001. Phase-transition-driven synaptic exocytosis: A hypothesis and its physiological and evolutionary implications. Biosci. Rep. 210:801–830.
- [47] Johnson, F. H., and E. A. Flagler. 1950. Hydrostatic pressure reversal of narcosis in tadpoles. Science 112:91–92.