Long-term power-law fluctuation in Internet traffic
Abstract
Power-law fluctuation in observed Internet packet flow are discussed. The data is obtained by a multi router traffic grapher (MRTG) system for 9 months. The internet packet flow is analyzed using the detrended fluctuation analysis. By extracting the average daily trend, the data shows clear power-law fluctuations. The exponents of the fluctuation for the incoming and outgoing flow are almost unity. Internet traffic can be understood as a daily periodic flow with power-law fluctuations.
1 Introduction
The Internet is one of the most important modern infrastructures for daily communication. On the contrary to the importance of the Internet, it has no global centers for controlling the global structure and the data transmission. It is namely an autonomous growing network. Complex properties in various autonomous growing networks have been studied in the viewpoints of small-world and scale-free properties. The structural and transport properties of the Internet and services such as the world wide web (WWW) also have been attracting scientific interests from the viewpoints of statistical physics[1, 2].
Internet traffic had been thought to be modeled by a Poisson process, because hosts are assumed to send data packets randomly. The validity of this assumption has clearly lost on the basis of various experimental measurements[3]. Power-law properties of Internet traffic have been investigated instead. Csabai investigated a time series of round trip time (RTT) for two weeks and observed its self-similarity[4]. Takayasu, Takayasu and Sato observed a time series of RTT and packet density fluctuations of three days long for discussing power-law properties of Internet packet flow[5]. In smaller time scales than one second, on the other hand, Internet traffic was reported to be almost white noise[6].
The Internet is a man-made communication system. So the traffic on the Internet is affected by human social activities. It may contain daily periodicity corresponding to periodicities of activities in human societies. To avoid effects of social periodic activities, researches on Internet traffic mentioned above focus their attentions to smaller time-scales than a day. The existence of power-law correlations longer than several days is also interesting in itself.
Components of the Internet, for example, Ethernets, routers and the transport control protocol (TCP), have exclusion and queuing mechanisms. The Ethernet protocol has the carrier sense multiple access/collision detective (CSMA/CD) mechanism[7], which requires the binary exponential back-off (queuing) algorithm for hosts connecting to an Ethernet. A router has a finite size of queue for forwarding packets using the Internet protocol (IP). TCP contains a congestion control mechanism to change the flow rate. TCP also requires a sender to re-send packets for fail-safe data transmission. These queuing effects are pointed to be a key feature of power-law behavior observed in the Internet[8, 9].
We can also observe power-law fluctuations in vehicle traffic. Vehicle traffic in an expressway also has exclusion and queuing mechanisms. A traffic lane and the finiteness of car length have exclusion effects on traffic flow. The density fluctuation in traffic flow, such as traffic jam, propagates upstream by the exclusion effect. The simplest model of traffic flow is a cellular automaton (CA) model, such as Wolfram’s rule 184 CA[10], which includes the exclusion effect. Some models of traffic flow reproduce power-law behavior[11, 12, 13]. In observations of real expressway traffic, Mush and Higuch observed fluctuations within smaller time-scale than several hours[14].
Expressway traffic is non-stationary flow consisting of correlations with various time scales. Traffic flow also contains daily periodicity reflecting human social activities. One of methods for analyzing non-stationary time series is the detrended fluctuation analysis (DFA)[15, 16]. By extracting the average daily periodicity, power-law fluctuations in expressway traffic are found to be extended longer than several months using DFA[17].
The purpose of this paper is to investigate large time-scale behavior of Internet traffic. We analyze Internet packet flow passing through a network gateway observed using a multi router traffic grapher (MRTG) system[18]. Applying DFA method on the data, the long-range correlation will be discussed.
The organization of this paper is as follows. DFA is described briefly in § 2. We analyze Internet packet flow observed using MRTG. Section 3 describes the observed data and the result using DFA. As in our previous work on vehicle traffic, a modified data is defined by extracting the daily average flow from the raw data. The modified data is analyzed in § 4. Section 5 is devoted to summary and discussion.
2 Detrended Fluctuation Analysis
The detrended fluctuation analysis (DFA) is one of methods for analyzing non-stationary time series. It was first developed for analyzing the long-range correlation in deoxyribonucleic acid (DNA) sequences[15, 16]. The method has been applied to various time series with non-stationarity for analyzing their power-law properties. The theoretical properties of the method have also been discussed[19, 20].
The simplest form of the method is described as follows. Consider to analyze a raw temporal data (). First, the profile of the raw temporal data () is defined as the accumulated deviation from the average
| (1) |
where is the temporal average value of the raw data .
The entire time sequence of the profile of length is divided into non-overlapping segments of length . The local trend in the -th segment is defined by fitting the raw profile in the segment. We here employ the linear least-squares method to fit the profile. This is called first-order DFA.
The detrended profile is defined as the deviation of the original profile from the local trend
| (2) |
The standard deviation of the detrended sequence is defined as the mean square of the detrended profile
| (3) |
By analyzing the dependence of the standard deviation on the segment length , we find the long-range correlation in the non-stationary time sequences. If the standard deviation behaves as a power of the segment length
| (4) |
the power spectrum of the time sequence also obeys the power-law
| (5) |
3 Analysis of data
We observe Internet packet flow at the gateway of Saga University to Kyushu University, where we connect our university local area network (LAN) to the science information network (SINET), the Japanese backbone network for academic organizations[21]. The bandwidth of the line is 100 Mbps. Data of packet flow is obtained as a five-minute average value using MRTG. The data set consists of MRTG packet data observed from September, 2005 to May, 2006.
The period where the data are collected, includes the end of the second semester in 2005 school year. And some parts of data are lost because of troubles in the network system and the MRTG system. Namely the data has various types of non-stationarity and defects.
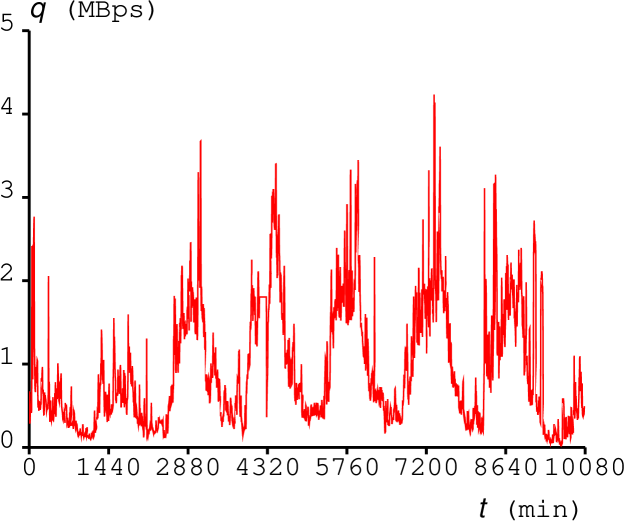
Figure 1 shows a sample data of the packet flow for one week observed using MRTG. Daily periodic behavior (1440 minutes) can be found clearly corresponding to activities in our university. The data also contains weekly periodic behavior, which can be found in the profile (Fig. 2).
We apply the DFA method on the time sequence of the packet flow . First the profile is defined by
| (6) |
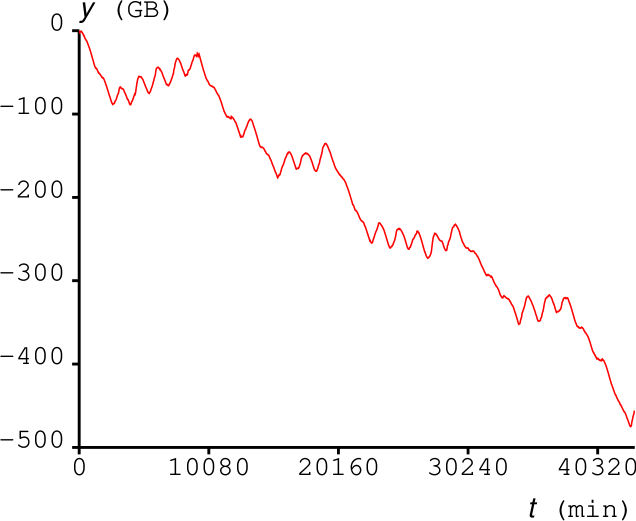
The profile represents the accumulated packet fluctuation around the average. The profile shown in Fig. 2 is 30 days long. We can recognize weekly periodicity (10080 minutes). The inactivity of network use in weekends appears as steep decrease of the curve.
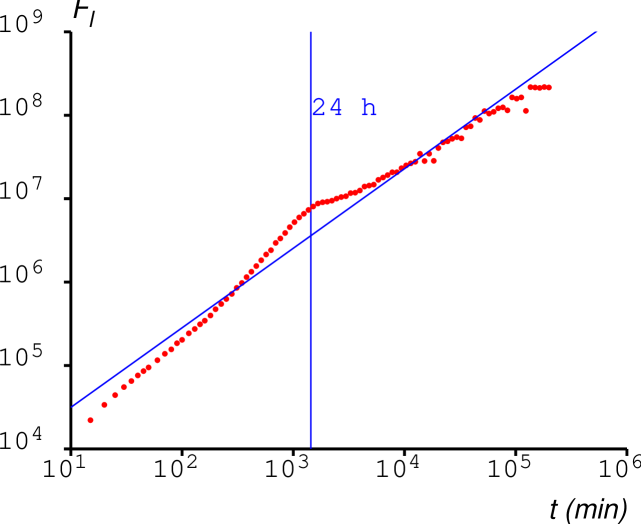
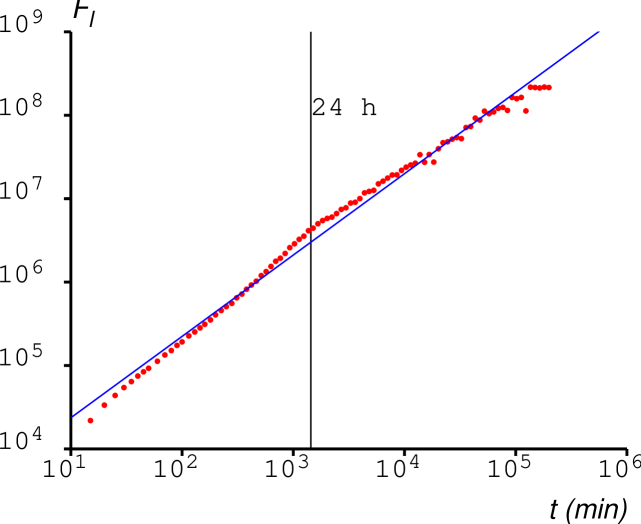
By applying the DFA method, the dependence of the standard deviation on the segment length of local trends is obtained as shown in Fig. 3. The result seems to be divided into two regions of different exponents. Two regions are connected at a bending point of the curve at one day long.
The feature appeared in Fig. 3 is similar to that observed in the DFA analysis of expressway vehicle traffic[17]. The curve of the standard deviation has a bending point, which corresponds to the daily periodicity of the traffic. This bending appeared in the curve of is a typical feature of periodic time series with power-law fluctuations[22]. The bending point corresponds to the dominant periodicity in the time series. Namely the Internet traffic observed at the gateway seems to be a daily periodic time sequence with power-law fluctuations.
The DFA analysis of Internet traffic has been reported by Fukuda, Nunes Amaral and Stanley[23]. They have observed a shorter time sequence than a day to avoid effects of daily periodicity reflecting network user’s activities. They have found power-law fluctuations in the Internet traffic. Our research extends the DFA analysis of Internet traffic for longer period than one month.
4 Modified Data and Analysis
We will confirm, in this section, that the observed Internet traffic consists of daily periodicity with power-law fluctuations. We apply the same procedure applied in our previous analysis of expressway vehicle traffic[17].
First we define the daily trend using the same method for analyzing vehicle traffic as in the previous work on vehicle traffic. The daily trend is defined by
| (7) |
where and is the number of days in the data. Then the packet flow is replaced with the modified packet flow
| (8) |
The profile for the modified packet flow is defined in the same way as in eq. (6)
| (9) |
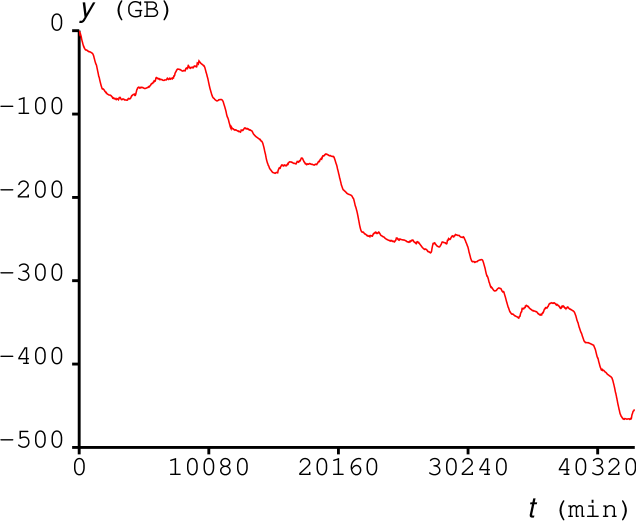
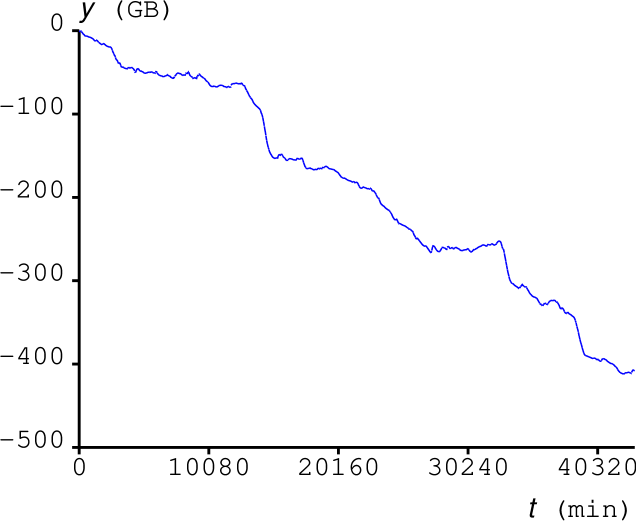
The profile for the modified flow is shown in Fig. 4. It does not show daily periodicity no longer. We still recognize weekly periodic behavior in the modified profile .
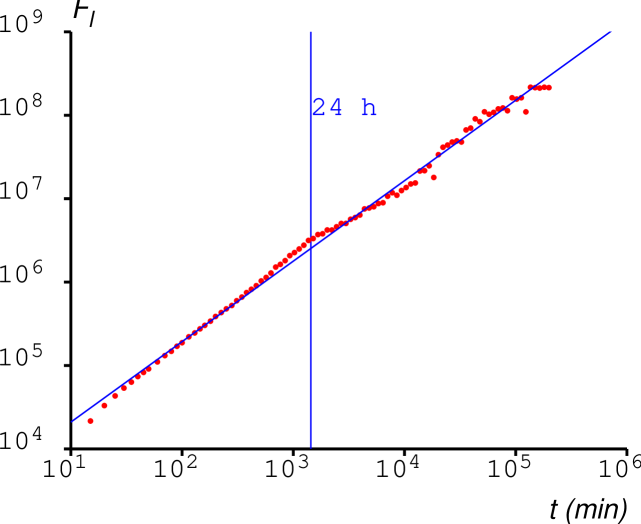
The standard deviation eq. (3) for the modified flow is evaluated (Fig. 5). The bending point at a day long almost disappears. The power-law fluctuation property is clearly shown. Namely Internet packet flow is a daily periodic one with power-law fluctuations. This property is not restricted in smaller time scale than a day as observed previous works. It extends to longer time scale than a month.
The exponent of the fluctuation shown in Fig. 5 is . It means that the power spectrum behaves with . Namely, Internet traffic contains fluctuations.
The modified packet flow , which is defined by extracting daily average periodicity from the original packet flow , still has weekly periodicity as shown in Fig. 4. We finally discuss the effects of weekly periodicity remaining in on the standard deviation shown in Fig. 5.
We can defined a new modified packet flow by extracting the remaining weekly periodicity in using the same procedure employed in eq. (8). The profile of the sequence, whose daily and weekly average periodicity is extracted, is shown in Fig. 6. The profile seems not to contain any periodicity. The standard deviation corresponding to the profile in Fig. 6 is shown in Fig. 7. There are no new features in comparison with Fig. 5. The exponent equals to that in Fig. 5. Namely the weekly periodicity is not important to discuss the long-range correlation. This supports that the packet flow is a daily periodic one with power-law fluctuations.
5 Summary and Discussion
The Internet has been attracting scientific interests because of its complex and autonomous properties. The assumption that Internet traffic obeys a Poisson distribution, has lost its validity. Researchers have been revealing scale-free properties of the Internet in various features. This study analyzes the time sequence of Internet packet flow observed using MRTG and discuss the power-law properties.
We employ the detrended fluctuation analysis (DFA) to analyze the long-range correlation in the observed data of Internet flow. The result shows the typical feature of periodic behavior with power-law fluctuations. It also shows the dominant periodicity is one-day long.
To confirm that Internet packet flow is a mixuture of daily periodic motion and power-law fluctuations, we apply the same method employed for analyzing the expressway vehicle traffic in our previous work. The modified packet flow data is defined by extracting the average daily periodicity from the raw data. By DFA applied on the modified data, the power-law fluctuation is clearly observed in longer time scale than a month.
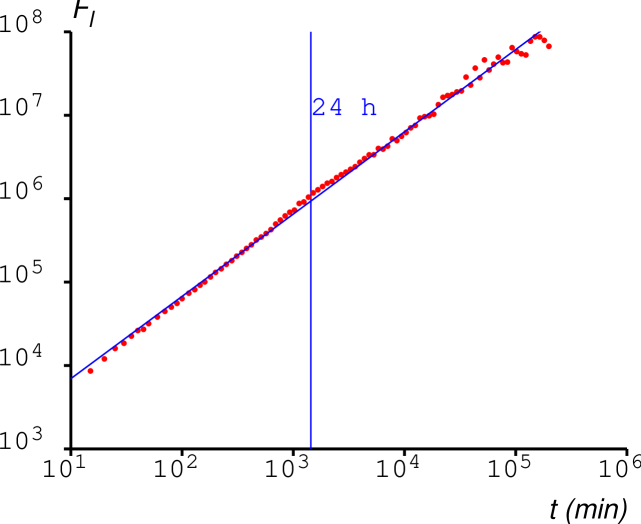
We analyzed the incoming packet flow into Saga University. The amount of the outgoing packets is two or three times smaller than that of the incoming flow. The property of the power-law fluctuation is the same as that of incoming flow. By DFA applied on the modified outgoing packet flow, the standard deviation behaves in the same way as for the incoming packet flow (Fig. 8). The power-law fluctuation seems to be general in Internet flow.
Exclusion and queuing mechanisms discussed in § 1 will affect power-law properties in small time-scales. Random fluctuations in shorter time-scales than a second pile up by exclusion and queuing effects in network systems. And those effects generate power-law fluctuations in times-scales of hours. The Internet also contains various exclusion and queuing mechanisms with longer time-scales than a day. A sendmail system, for example, has such mechanisms. First a user sends his e-mail messages to the sendmail server of his organization. The server tries to deliver the message to the server of message’s destination. If the message is not delivered to the destination, the server tries to re-send it after 15 or 30 minutes. The server will keep undelivered messages for one week and repeat to try to send them. If a queued message finally fails to be sent after one week, the server generates a message of an undelivered event for the sender of the message. These queuing mechanisms with long time-scales will be effective to generate power-law fluctuations with long time-scales. And the retrying behavior in the sendmail system also affects the performance of computer and network systems and generates long-range correlation.
The power-law fluctuations longer than a month, however, seems difficult to be discussed depending only on network mechanisms. Exclusion and queuing mechanisms in human activities may be important for power-law properties of the Internet. In human activities, we also have finite queue to handle jobs. We postpone some jobs depending on their importance. The delay of one’s job causes avalanches of delays in subsequent jobs scheduled by others. The Internet is one of the main communication tools of modern working environment. So finite queues in human activities affect the long-range correlation in the Internet. Anyway we need some simple models of network services, human activities, and their interaction.
The scale-free properties in the global structure of the Internet will be another origin of the power-law fluctuations in Internet traffic. We observe the outgoing packet flow also shows power-law fluctuations. The structure of our university LAN is not scale free. It is a simple hierarchy with a few layers. So we need to study how the global scale-free structure of the Internet affects the power-law properties of packet flow at a peripheral gateway.
Acknowledgments
A part of this work is financially supported by a Grant-in-Aid No. 18500215 from the Ministry of Education, Culture, Sports, Science and Technology, Japan.
References
- [1] R. Pastor-Satorras and A. Vespignani: Evolution and Structure of the Internet (Cambridge U. P., Cambridge, 2004).
- [2] L. Kocarev and G. Vattay ed.: Complex Dynamics in Communication Networks (Srpinger-Verlag, Berlin, 2005).
- [3] V.Paxson and S. Floyd: IEEE/ACM Trans. Networking, 3 (1995) 226.
- [4] I. Csabai: J. Phys. A: Math. Gen. 27 (1994) L417.
- [5] M. Takayasu, H. Takayasu and T. Sato: Physica A 233 (1996) 824.
- [6] V. J. Ribeiro, Z.-L. Zhang, S. Moon, C. Diot: Computer and Network 48 (2005) 315.
-
[7]
http://grouper.ieee.org/groups/802/3/. - [8] M. Takayasu, A. Tretyakov, K. Fukuda and H. Takayasu: in D. E. Wolf ed., Traffic and Granular Flow ’97 (Springer, Berlin, 1998) 57.
- [9] K. Fukuda, H. Takayasu and M. Takayasu: Physica A 287 (2000) 289.
- [10] S. Wolfram: Rev. Mod. Phys. 55 (1983) 601.
- [11] M. Takayasu and H. Takayasu: Fractals 1 (1993) 860.
- [12] S. Yukawa and M. Kikuchi: J. Phys. Soc. Jpn. 65 (1996) 916.
- [13] S. Tadaki, M. Kikuchi, Y. Sugiyama and S. Yukawa: J. Phys. Soc. Jpn. 68 (1999) 3110.
- [14] T. Musha and H. Higuchi: Jpn. J. Appl. Phys. (1976) 15 1271.
- [15] C.-K. Peng, S. V. Buldyrev, S. Havlin, M. Simons, H. E. Stanley and A. L. Goldberger: Phys. Rev. E49 (1994) 1685.
- [16] C.-K. Peng, S. Havlin, H. E. Stanley and A. L. Goldberger: Chaos 5 (1995) 82.
- [17] S. Tadaki, M. Kikuchi, A. Nakayama, K. Nishinari, A. Shibata, Y. Sugiyama and S. Yukawa: J. Phys. Soc. Jpn. 75 (2006) 034002.
-
[18]
http://oss.oetiker.ch/mrtg/. - [19] J. W. Kantelhardt, E. Koscielny-Bunde, H. H. A. Rego, S. Havlin and A. Bunde: Physica A295 (2001) 441.
- [20] D. Vjushin, R. B. Govindan, R. A. Monetti, S. Havlin and A. Bunde: Physica A302 (2001) 234.
-
[21]
http://www.sinet.jp/. - [22] K. Hu, P. Ch. Ivanov, Z. Chen, P. Carpena and H. E. Stanley: Phys. Rev. E64 (2001) 011114.
- [23] K. Fukuda, L. A. Nunes Amaral and H. E. Stanley, Europhys. Lett. 62 (2003) 189.