Homophily, Cultural Drift and the Co-Evolution of Cultural Groups
Abstract
In studies of cultural differentiation, the joint mechanisms of homophily and influence have been able to explain how distinct cultural groups can form. While these mechanisms normally lead to cultural convergence, increased levels of heterogeneity can allow them to produce global diversity. However, this emergent cultural diversity has proven to be unstable in the face of “cultural drift”- small errors or innovations that allow cultures to change from within. We develop a model of cultural differentiation that combines the traditional mechanisms of homophily and influence with a third mechanism of “network homophily”, in which network structure co-evolves with cultural interaction. We show that if social ties are allowed to change with cultural influence, a complex relationship between heterogeneity and cultural diversity is revealed, in which increased heterogeneity can reduce cultural group formation while simultaneously increasing social connectedness. Our results show that in certain regions of the parameter space these co-evolutionary dynamics can lead to patterns of cultural diversity that are stable in the presence of cultural drift.
Homophily - the principle that “likes attract” - is a prominent explanation for the persistence of cultural diversity. More precisely, homophily is the tendency of people with similar traits (including physical, cultural, and attitudinal characteristics) to interact with one another more than with people with dissimilar traits. There are three reasons why homophily is such a powerful force in cultural dynamics, where ”culture” is defined as a set of individual attributes that are subject to social influence1 . Psychologically, we often feel justified in our opinions when we are surrounded by others who share the same beliefs - what Lazarsfeld & Merton2 call value homophily3 4 ; we also feel more comfortable when we interact with others who share a similar cultural background, i.e., status homophily2 5 6 7 8 . Both of these reasons are forms of choice homophily9 10 , where patterns of interaction are driven by preferences for similarity. The third reason, induced homophily 9 10 , emerges not from individual choice but from influence dynamics that makes individuals more similar over time.
While homophily has been studied empirically as an important factor in the formation and differentiation of social groups 7 ,8 ,11 , there are relatively few formal models that show how homophily functions to create and preserve social differentiation 1 12 13 . This is because in addition to the principle of choice homophily, social scientists also observe the principle of social influence: the more that people interact with one another, the more similar they become. This influence process produces induced homophily, in which the disproportionate interaction of likes with likes may not be the result of a psychological tendency, but rather the result of continuous interaction9 . When choice homophily (hereafter ”homophily”) and social influence are taken together, the explanation of cultural diversity poses something of a paradox: “if people who are similar to one another tend to become more alike in their beliefs, attitudes, and behavior when they interact, why do not all such differences eventually disappear?” 1 .
While the processes of homophily and influence can produce global convergence, Axelrod1 shows that they can also act as local convergence mechanisms, which produce emergent social cleavages that lead to global polarization. Thus, the answer to the paradox is that as homophily increases, some groups of people do indeed converge on their cultural characteristics; yet, if there is enough heterogeneity in the population, this similarity amongst group members can also make them even more dissimilar from the members of other groups3 14 . Ultimately, this can produce cultural groups that are so dissimilar from one another that their members cannot interact across group boundaries. This shows not only that the simple combination of homophily and social influence can produce and sustain patterns of global diversity 1 , but also that the development of cultural barriers between groups can arise from a process of social self-organization in which emergent differences becomes significant enough to prevent inter-group contact, even without enmity across group lines.
Building on Axelrod1 , researchers have found that several factors affect the emergence of cultural diversity, for example globalization and international communication15 , cognitive optimization in social groups16 , and cultural drift17 18 , i.e., random changes in individual traits. Cultural drift raises the question of whether the above explanation of cultural diversity will hold if actors are permitted to make errors or to develop innovations1 . Surprisingly, Klemm et al17 18 found that if noise is introduced at a low rate (allowing cultural traits to change randomly with a small probability), the basic dynamics of the homophily and influence model will drive the population away from cultural diversity and towards cultural homogeneity111Kennedy16 finds a similar result when homophily is eliminated from the cultural diffusion model. He shows that when interactions are not constrained by homophily, social influence dynamics leads to a homogenous state with a single global culture. What is more surprising is that even with homophily cultural drift will inevitably drive the system to a global monoculture.. This happens because the introduction of random shocks perturb the stability of cultural regions, eroding the borders between the groups. This allows the system to find a dynamical path away from the metastable configuration of coexisting cultural domains, towards the stable configuration of a global monoculture222Klemm et al 17 18 also found that if noise acts at high rates, it overwhelms the dynamics of the model and leads to a state in which distinct cultural regions never form. In this “disordered noise regime” cultural diversity persists, but only as a random pattern of continuously changing traits.. If there is a possibility that small errors or innovative changes will alter even a few individuals’ traits, the mechanisms of homophily and influence will be unable to sustain cultural diversity in the long run. Thus, we are faced with the question of whether global monoculture is an inevitable outcome in the presence of cultural drift.
The present article takes up this revised form of Axelrod’s question by developing a model that demonstrates conditions under which local dynamics of homophily and influence can produce and maintain cultural differentiation even under the noisy conditions of cultural drift. Other recent attempts to solve the problem of cultural diversity under drift either fix certain cultural characteristics19 or introduce xenophobia into the dynamics13 . We preserve the basic homophily and imitation dynamics developed by Axelrod1 . The key development in our approach is the specification of homophily. While both choice and induced homophily have been primary mechanisms for understanding how distinct cultural groups can form1 12 19 20 , most research in this tradition places an emphasis upon the changing distribution, or clustering, of traits over time. However, recent research shows that network dynamics - the changing patterns of social interaction over time - may play an equally important role in understanding the effects of homophily on group formation10 . Following this line of research, we introduce “network homophily” via the co-evolution of individual traits and network structure21 22 23 . Unlike previous research on cultural diffusion, the network of social interactions is not arbitrarily fixed1 2 4 , but rather it evolves in tandem with the actions of the individuals26 21 as a function of changing cultural similarities and differences6 7 10 27 . Following Klemm et al. 17 18 24 25 we use the level of heterogeneity in the population as a control parameter, which allows us to map the space of possible co-evolutionary outcomes, and thereby to show how network structure and cultural group formation depend upon one another. These results allow us to address the question of how stable cultural groups can be maintained in the presence of cultural drift.
I A Co-evolutionary Model of Cultural Dynamics
We use an agent-based model1 in which each actor has its individual attributes defined as a vector of cultural features; each feature represents a different kind of taste or behavior (e.g., language, religion, music choice, clothing,…), and takes its value from a range of possible traits. Thus, the state of an actor i is a vector of cultural features , where each corresponds to a cultural trait assigned from the range of integers between and . The length of the vector represents the social complexity of the population, i.e., the larger is, the greater the number of cultural characteristics that are attributable to each individual27 . The number of traits, , represents the heterogeneity of the population27 . The larger is, the larger the number of possible traits that a given feature can have, corresponding to a greater number of cultural options in the society.
The initial state consists of agents located in a two dimensional square lattice with von Neumann neighborhoods1 28 . The results of the co-evolutionary model are not sensitive to the choice of the initial network configuration, however we begin with the von Neumann lattice structure for easy comparison with previous work1 17 18 29 . Each actor is randomly assigned cultural traits. Agents are neighbors if they are connected by a direct link in the network, where the weight of this link is determined by their cultural similarity, defined below. The dynamics of the model are defined by the following rules:
-
1.
Select an agent at random from the population. Call the ’active’ agent. From among ’s neighbors, select a random neighbor and call this agent the ’partner’.
-
2.
Calculate the overlap, or cultural similarity, between and as the number of features on which i and j have the same trait:
-
3.
If and share some features in common, but are not yet identical, i.e., , then and interact with probability .
-
4.
Agent interacts with agent by choosing a random feature such that and do not already overlap, i.e., . The active agent then sets its trait at feature to match its partner’s trait at feature , i.e., .
-
5.
If , removes from his network of social ties , and randomly selects an agent , where , , and adds to its social network.
Rules 1-4 define the basic homophily and influence model. Actors who are similar are more likely to interact. Further, interaction makes actors who are similar become even more similar, increasing the weight of their tie and the likelihood of future interaction. However, if cultural influence processes create differentiation between two neighbors such that they no longer have any traits in common, creating zero overlap in their cultural features and giving them a tie of zero weight, they still remain fixed as network neighbors. Rule 5 incorporates network homophily dynamics into the model by allowing agents to drop ties to members of their social networks with whom they have a link of zero weight. Together, rules 1-5 use the co-evolution of social structure and individual traits22 to model the dynamics of cultural change.
II Model Dynamics
In the absence of co-evolutionary network dynamics (rules 1-4 only), the system can evolve either toward complete homogeneity or toward cultural diversity, depending on the level of heterogeneity, , and the number of cultural features, 1 29 . In the limit of large , for regular lattices, random networks and small world networks there is a well defined transition: for a fixed , there is a critical value of , , that corresponds to the transition from global monoculture to cultural diversity24 25 29 . Thus, a single parameter - the heterogeneity in the population - controls the dynamics of whether the population evolves toward multiculturalism or toward a global monoculture. This transition is sharp, going from complete monoculture to widespread diversity on either side of the critical value25 . In Figure 1, the transition is shown by the dramatic change in the average size (normalized by ) of the largest cultural domain, , as increases 333Averages reported throughout the paper are ensemble averages over 100 realizations with different random initial conditions.. When , the largest cultural domain approximates the size of the entire population , indicating little or no cultural diversity444 is determined as the value of for which the fluctuations in the ensemble values of is maximum. However, for increased heterogeneity guarantees that the largest cultural domain is only a small fraction of the population (). Correspondingly, when is small, the number of distinct cultural groups is large.
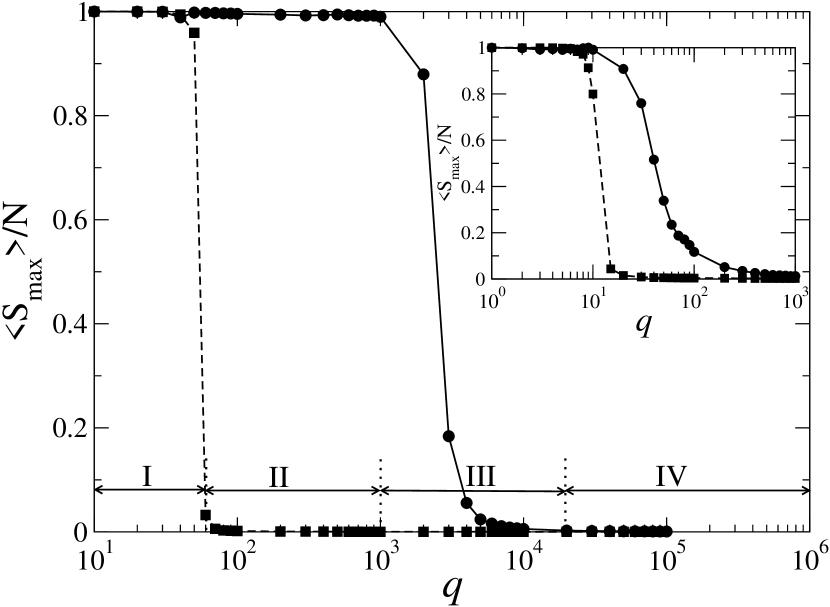
How does the introduction of co-evolution (rule 5) affect this transition from global monoculture to multiculturalism? Figure 1 shows that while the qualitative results are the same for fixed and dynamic networks, introducing network dynamics has the quantitative effect of increasing the critical value of q. Thus, there is a large range of values of q for which multiculturalism is achieved in a fixed network, while co-evolutionary dynamics lead to a monocultural state555Figure 1 shows results for 17 24 and . Results are qualitatively similar, but the transition for in a co-evolving network occurs for lower values of ..
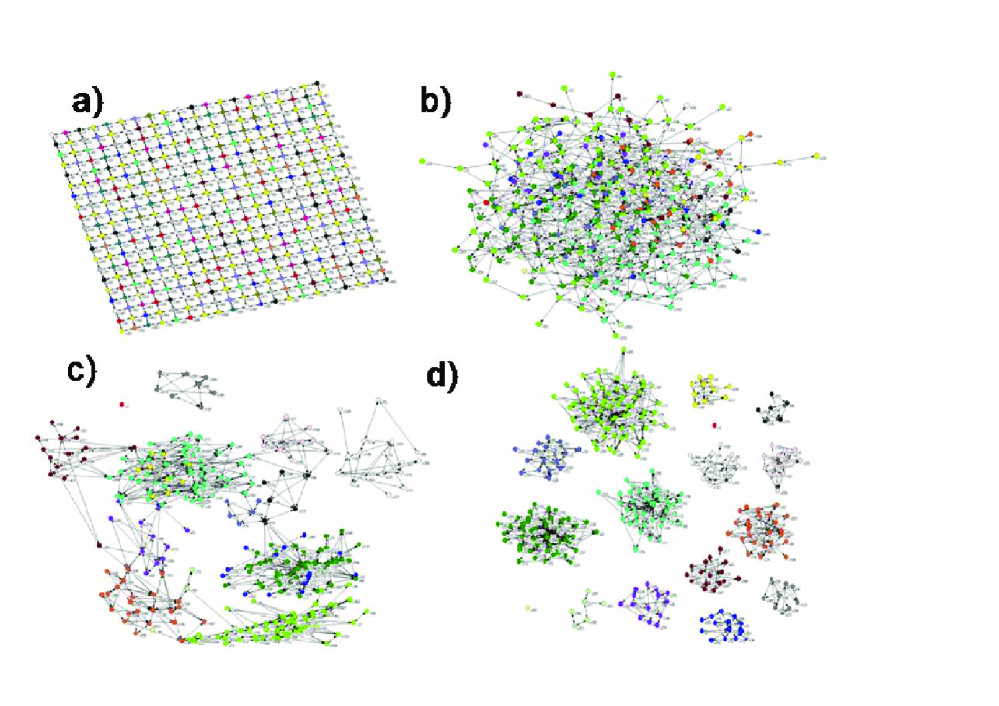
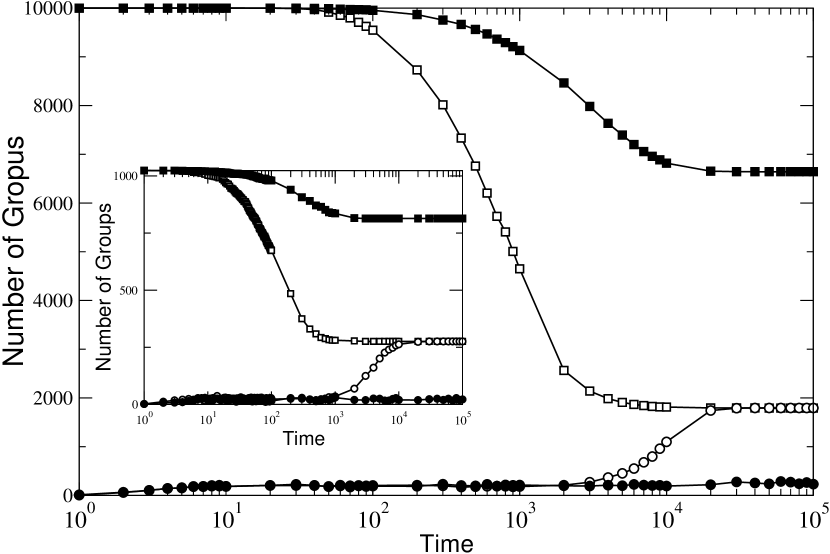
The co-evolutionary dynamics do not only affect the critical value of , they also dramatically alter the structure of the social network. Depending on the value of , the network can evolve from a regular lattice into a complex connected random network, or can break apart into multiple components. This latter point is quite important, for it means that while cultural diffusion on the fixed network produces physical boundaries that define the cultural regions, the dynamic network can self-organize into culturally distinct physical groups. This process of self-organization is illustrated in Figure 2. Beginning with a regular lattice (Figure 2a), the system first loses its original structure (Figure 2b), then forms into culturally homogenous regions (Figure 2c), which ultimately become culturally homogenous components (Figure 2d). The colors of the nodes indicate unique cultural groups, which change over time due to the influence process.
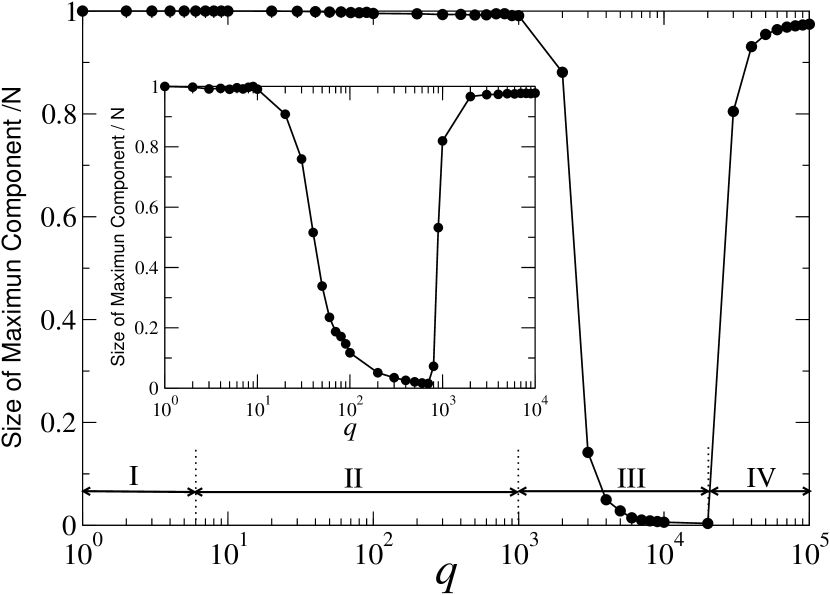
These network dynamics are surprisingly dependent upon the level of heterogeneity in the population, as shown in Figures 3 and 4. Figure 3 illustrates the effects of increasing on the size of the largest network component, or physical group, that is produced by the co-evolutionary process. Initially, increasing causes component size to decrease; however, for higher levels of there is a transition above which component size reverses its trend and increases sharply. Figure 4 shows the effects of on the number of distinct cultural and physical groups. This figure also indicates a sharply curvilinear effect of increasing . In both figures, these co-evolutionary outcomes are divided into four distinct regions of the parameter space:
-
•
Region I) values of ( for and for ) where a global monocultural state is reached in a fixed network.
-
•
Region II) values for which a fixed network attains cultural differentiation (shown in Figure 1), while a co-evolving network produces a global monocultural state.
-
•
Region III) values of for which multicultural states are produced in both a fixed network and in a co-evolving network, and the number of cultural and physical groups coincide asymptotically in time in a co-evolving network.
-
•
Region IV) values of , where corresponds to a threshold value ( for , for ) above which the number of cultural and physical groups no longer coincide.
Region I is the simplest case since there is insufficient heterogeneity to allow cultural differentiation. There are too few cultural options for cultural diversity to be achieved. In region II ( for and ), there is sufficient heterogeneity to allow cultural diversity to emerge in the fixed network. However, in the co-evolutionary model, the population remains connected in a single component. Since actors in the dynamic network are able to find paths around local borders by forming new ties, cultural groups break down and the entire population forms a global monoculture. As q increases, we approach region III, in which the dynamic network breaks into multiple components666For finite systems (finite ), the transition between regions II and III is not sharply defined and is identified with a narrow range of values of for which a change in the average co-evolutionary outcome is found.. In Figure 3, region III (approximately for and ) corresponds to values of for which there is a gradual decrease in the average size of the largest physical group. In Figure 1, this region corresponds to a gradual decrease in the average size of the largest cultural group. Thus, as the size of the largest component decreases, so does the size of the largest cultural domain. In Figure 4, this region is also shown to correspond to the values of for which there is a gradual increase of the average number of physical and cultural groups. So, as the network breaks apart into multiple components, it also forms into more cultural groups.
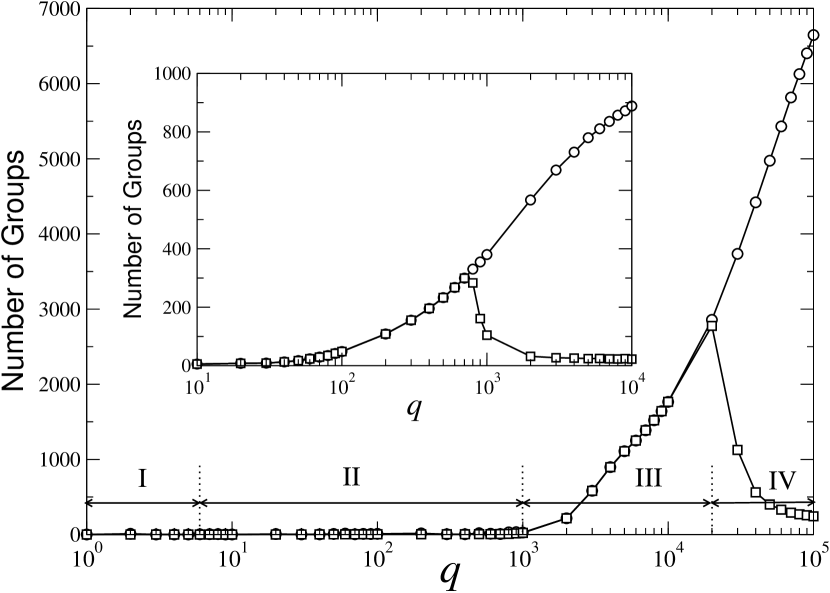
Figure 3 also shows that the trend of decreasing component size, observed in Region III, is non-monotonic in . Above (Region IV), the size of the largest component increases sharply. By contrast, Figure 1 shows no corresponding change in the size of the largest cultural group, which continues to decrease for . Thus, in region IV, the dynamics of cultural group formation de-couple from the dynamics of network formation. In regions I-III the number of cultural groups matches the number of physical groups, indicating that each component corresponds to a different cultural domain, however Figure 4 shows that in region IV the number of cultures continues to increase, while the number of network components starts to decrease.
Thus, represents a transition in the dynamics of cultural evolution past which social structure does not determine the formation of cultural groups. This is certainly anomalous, since from the definition of our dynamical model, physical and cultural groups are expected to coincide asymptotically. Figure 5 sheds light on this anomalous result by examining the time evolution of network groups (circles) and cultural groups (squares) for values of above (solid) and below (empty) . First, we observe that both above and below , the dynamics of network evolution (physical group formation) is slower than the dynamics of cultural group formation. For , the number of cultural groups (empty squares) stabilizes at approximately , but the number of physical groups (empty circles) does not finally converge until . For , the trend is similar, with cultural groups (solid squares) stabilizing at around , however the number of physical groups (solid circles) fails to converge.
This failure of the network to converge highlights the primary difference between the behavior of the system above and below . As heterogeneity increases, there is an excess of cultural possibilities, and it becomes less likely that any two actors will have any traits in common. Above , the large number of cultural possibilities overwhelms actors in a finite system, making it difficult for them to find any overlapping traits with one another. As the size of becomes of the order (system size times number of features), the number of possible traits is so much larger than the number of instantiated traits at any given time that the probability of individuals having any cultural overlap approaches zero. The consequence is that co-evolutionary dynamics result in actors continuously breaking links and searching for new partners in the network, without ever reaching a stationary configuration.
Holding the system size and the number of features constant, we can thus identify how heterogeneity controls the dynamics of cultural co-evolution. For , the social network remains a single component and the cultural patterns converge on global monoculture. For , the network breaks off into components that correspond to distinct cultural groups. Finally, for even greater values of heterogeneity (), network evolution and cultural evolution decouple, as the size of the largest component increases dramatically while cultural groups fragment into ever smaller - ultimately idiosyncratic - patterns of traits.
III Cultural Drift and Co-evolution
This analysis of the co-evolutionary dynamics suggests that in the region of parameter space where nontrivial multicultural states survive in a co-evolving network, the co-evolutionary cultural processes of homophily and influence may in fact stabilize the co-existence of distinct cultural regions even in the presence of continuous stochasticity. Following Klemm et al. 17 18 , we add cultural drift to the evolutionary dynamics by adding noise in the form of continuous random shocks, as defined by the following rule:
-
With probability , perform a single feature perturbation. A single feature perturbation is defined as randomly choosing an agent from the population, ; randomly choosing one of ’s features, ; then randomly choosing a trait from the list of possible traits, , and setting .
Depending on whether the rate of perturbation is less than or greater than the time scale on which the homophily and influence dynamics operate, the system will either be slightly perturbed on a regular basis (small noise rate), or the system will be constantly flooded with noise (large noise rate) and unable to reach any kind of equilibrium. In fixed networks, there is a critical value of the noise rate above which noise dominates the behavior of the system17 . We are here interested in the small noise rate limit (), which tests the stability of cultural diversity in the presence of cultural drift.
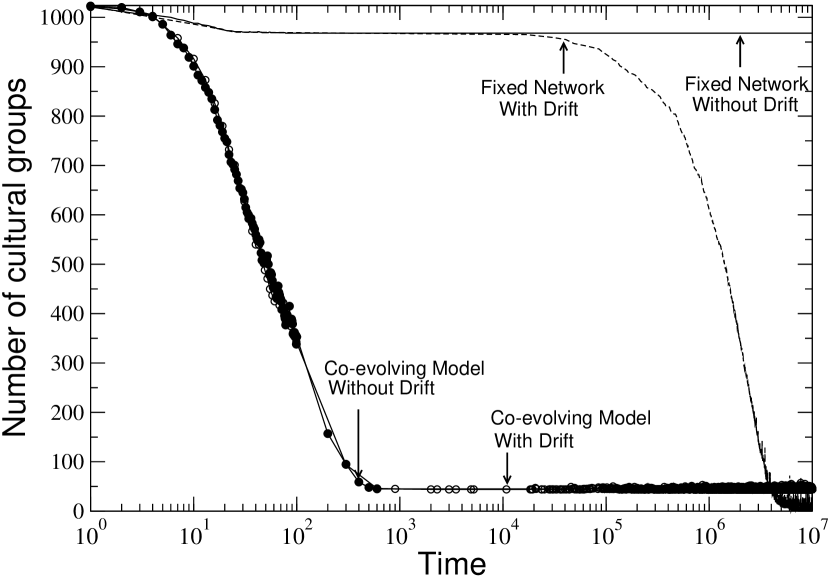
As a benchmark for comparison, Figure 6 shows the effects of cultural drift in region II for a fixed network and for a co-evolutionary model. For a fixed network (Figure 6a), we observe that without cultural drift (, solid line) the system stabilizes in a multicultural state for the whole duration of the simulation. However, cultural drift (, dashed line) drives the system towards a monocultural state, where17 18 . It is worth noting that this monocultural state is not fixed, as perturbations take the system in random excursions away from, and then back to, any of the equivalent monocultural states. As a new trait percolates through the network, the size of the largest cultural group drops as more people adopt the new trait. However, as even more people adopt the trait, the size of the largest group increases again until cultural uniformity is restored. For a co-evolving network (Figure 6b) we observe that after an initial transient the system orders itself in a monocultural state. This happens in the same time scale with noise (dashed line) and without noise (solid line). As in the fixed network, cultural drift causes random excursions from the final monocultural state, only to return to another one.
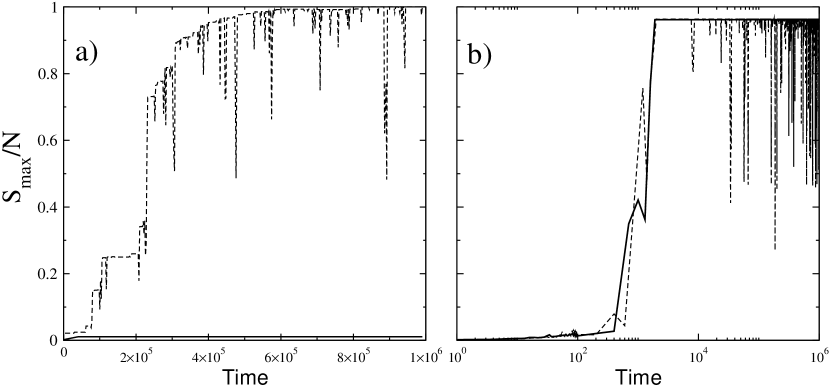
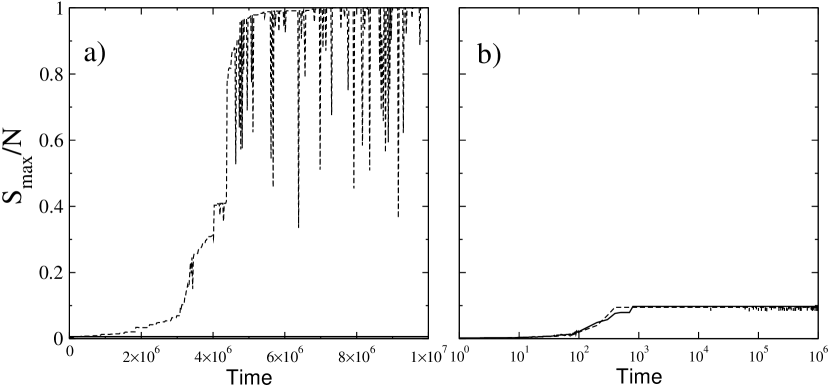
A more interesting effect is shown in Figures 7a and 7b, which corresponds to region III. For the fixed network (Figure 7a), the results are the same as in region II: without noise (solid line) the system stabilizes with high levels of heterogeneity, but with noise (dashed line) the system reaches a homogeneous state. As before, noise-induced excursions away from monoculture give rise to changes in the cultural make-up of the group, but the system always returns to a monocultural state. For the co-evolving network (Figure 7b), we observe that in the absence of cultural drift (solid line) the co-evolution model quickly finds a stable state and then remains in that state for the rest of the simulation. When cultural drift is added to the co-evolution model (dashed line), not much happens. The model with noise reaches a stable state in about the same time, and with of about the same size, as it does without noise. Small perturbations occasionally propagate through the groups, causing shifts in their cultural identities. However, the network structure, the number of physical groups, and the composition of the groups remains unchanged. Figure 8 shows the number of cultural groups corresponding to Fig.7. As expected, the fixed network without noise (solid line) stabilizes with a large number of cultural groups, but when noise is added (dashed line) the number of cultural groups drops to one. Conversely, for the co-evolving network both without noise (solid circles) and with noise (open circles), diverse cultural groups stabilize in about the same time and remain in tact throughout the simulation. While cultural drift may cause slight changes in the internal culture of the groups, either through perturbations occurring, then dying out, or through perturbations successfully propagating through the cultural groups, the membership of the cultural groups remains distinct. Without cross-cutting27 ties between these groups, there are no opportunities for new cultural exchanges to incite cross-border interaction between cultural groups. Their isolationism guarantees that they can maintain their cultural distinctiveness, dynamic though it may be, even in the face of persistent cultural drift.
To understand why cultural drift does not cause cultural groups to break down, it is necessary to recall that groups will only break down if they form links to other groups. However, new links are only made when existing ties are dropped. Thus, the stability of groups in the dynamic model hinges on the low likelihood that an actor will drop a social tie, which is equivalent to the likelihood of having zero overlap with a fellow group member. Once groups have formed, the local processes of homophily and influence create cultural consensus within the group. Thus, for an actor to have zero-overlap with one of its neighbors, a sequence of perturbations must occur such that an actor goes from complete overlap to zero overlap. A lone perturbation on one feature will leave the altered actor with a very high level of similarity with its neighbors. Thus, a single perturbation will result in either the new cultural feature reverting to its original state (if the altered actor is influence by its neighbor), or the new cultural feature being adopted by a neighbor (if the altered actor influences its neighbor). In both cases, the dynamics of homophily and influence guarantee that the local group will achieve cultural consensus on the newly introduced feature, either through its elimination or its adoption.
In order for similarity between neighbors to decline, an actor with a new cultural feature must keep the cultural feature without it either being adopted or eliminated, while a second perturbation occurs, either to the originally altered actor or to one of its neighbors. This second perturbation must occur on a separate cultural feature, and must lessen the overlap between the two neighbors. Once again, no influence can take place, otherwise their similarity will increase, leading toward the absorption or elimination of the new traits. This sequence of perturbations must occur, without interruption by the processes of local influence, F times in order for two culturally identical neighbors to develop zero overlap. The probability of this occurring is roughly , or the chance that a single agent will be perturbed times in a row on a different feature each time. The probability is even lower if we consider that none of these perturbations can match any of the neighbors’ current traits. For the systems we have been studying () with , the chances of such an event are less than one in . Furthermore, for the noise levels used here and elsewhere17 18 to represent cultural drift, the model dynamics operate at a much faster timescale than do the perturbations (on average, all actors are activated ten times between each global perturbation), making the probability that such a sequence of perturbations could occur before homophily and influence dynamics would recover cultural consensus infinitesimally small. Thus, at least during time scales that are quite large as compared with the timescale of cultural convergence (approximately ), multicultural states in co-evolutionary systems are robust against cultural drift.
IV Conclusion
Our study of cultural differentiation introduces network homophily into the dynamics of cultural interaction. The co-evolution of network structure and cultural traits reveals a complex relationship between heterogeneity and the emergence of diverse cultural groups, indicating four qualitatively distinct regions of the parameter space. In regions I and II, the network remains connected, and both fixed and co-evolutionary dynamics lead to an absence of diversity in the presence of noise. However, in region III cultural groups can form and stabilize even in the presence of continuous stochastic shocks. Physically distinct cultural components form because increasing diversity creates zero overlap between neighbors, causing actors to drop these ties and segregate into discrete cultural groups. The ’flip side’ of this social detachment process is the formation of social units - homophilous clusters - that become culturally well-integrated social structures. ”This tendency for network relations to form between those who have similar social characteristics is known as the ’homophily principle.’ Since individuals close to one another on a dimension of social space are similar, homophily implies that ties are local in social space.” 11 .
In region III, the physical space of the initial lattice network is rearranged until all ties are ”local in social space”. This process produces an emergent social landscape in which discrete social clusters correspond to distinct ”trait groups”. Consistent with the results of Popalieraz and McPherson11 , the interaction of homophily and influence produces a niche structure whereby peripheral members are either absorbed into the core beliefs of the social group (by influence), or are forced out of the social group (by zero overlap). It is significant, however, that these social niches are not produced through competition or selection pressure11 , but through the mechanisms of homophily and influence in a co-evolutionary process. Thus, even in the absence of selection pressures, a population can self-organize into stable social niches that define its diverse cultural possibilities.
As heterogeneity increases, q approaches the threshold at which it enters region IV. In region IV, the abundance of cultural options overwhelms the population, permitting some ”anomic”30 actors to develop unlikely combinations of cultural features that prevent them from interacting with anyone. While some actors are able to form into homophilous clusters, the anomic actors perpetually add and drop ties. When , the largest component in the network consists of this disenfranchised group of actors who are unable to establish memberships in any of the homophilous social clusters. With increasing heterogeneity, the number of anomic actors increases, as does the size of this component, until the entire population forms a single network that is simply a buzz of adding and dropping ties with no mutual influence or lasting relationships. These very high levels of heterogeneity are empirically unrealistic in most cases, however they warn of a danger that comes with increasing options for social and cultural differentiation, particularly when the population is small, or there is modest cultural complexity. Unlike cultural drift, which causes cultural groups to disappear through growing cultural consensus, a sudden flood of cultural options can also cause cultural groups to disappear; but instead of being due to too few options limiting diversity, it is due to excessive cultural options creating the emergence of highly idiosyncratic individuals who cannot form group identifications or long term social ties. This suggests that, in addition to previous findings that increased heterogeneity facilitates the maintenance of cultural diversity, under certain conditions limiting cultural opportunities may also facilitate the preservation of diverse cultural groups.
DMC gratefully acknowledges support from the NSF through Cornell’s IGERT program in non-linear dynamics, and through grant SES-0432917. The rest of us acknowledge financial support from MEC(Spain) trough project CONOCE2( FIS2004-00953)
References
- (1) Axelrod R (1997) J. Conflict Res. 41: 203-226.
- (2) Lazarsfeld P and. Merton R K (1954). Friendship as a social Process: A Substantive and Methodological Analysis, in Freedom and Control in Modern Society, Morroe B, Theodore A, and Page CH, (Van Nostrand, New York) eds 18-66.
- (3) Knoke D (1990) Political Networks: The Structural Perspective (Cambridge Univ. Press, N.Y.).
- (4) Huston TL, Levinger G (1978) Ann. Rev. Psychol. 29:115-56.
- (5) Shrum W, Cheek NH Jr, Hunter SM (1988) Sociol. Educ. 61:227-39.
- (6) Marsden PV (1987) Am. Sociol. Rev. 52:122-313.
- (7) Marsden PV (1988) Social Networks 10:57-76.
- (8) Fischer CS (1977) Networks and Places: Social Relations in the Urban Setting. (Free Press, N.Y.).
- (9) McPherson J M, Smith-Lovin L (1987) Am. Sociol. Rev. 52:370-79.
- (10) McPherson J M, Smith-Lovin L and Cook J (2001) Ann. Rev. Sociol. 27:415-44.
- (11) Popielarz P and McPherson JM (1995) Am. J. Sociol. 101:698-720.
- (12) Mark N. (1998) Am. Sociol. Rev. 63:3.
- (13) Macy M W, Kitts J Flache A, and Benard S (2003) Polarization in Dynamic Networks: A Hopfield Model of Emergent Structure in Dynamic Social Network Modeling and Analysis, (National Academy Press).
- (14) Duncan OD, Haller A O, Portes A. (1968) Am. J. Sociol. 74:119-37.
- (15) Greig J M (2002) J. Conflict Res. 46: 225-243.
- (16) Kennedy J (1998) J. Conflict Res. 42: 56-76.
- (17) Klemm K, Eguíluz V M, Toral R, and San Miguel M (2003). Phys. Rev. E 67, 045101R:1-4.
- (18) Klemm K, Eguíluz V M, Toral R, and San Miguel M (2005) J. Econ. Dyn. Control 29: 321-334.
- (19) Durrett R and Levin S A (2005) J. Econ. Behav. Organ. 57(3): 267-286.
- (20) Mark N (2003) Am. Sociol. Rev. 68:3-319.
- (21) Lazer D (2001) J. Math. Sociol. 25:69-108.
- (22) Eguíluz V M, Zimmermann M G, Cela-Conde C J, San Miguel M, (2005) Am. J. Sociol. 110:977-1008.
- (23) McPherson JM, Popielarz P, Drobnic S (1992) Am. Sociol. Rev. 57:153-70.
- (24) Klemm K, Eguiluz V M, Toral R and San Miguel M (2003) Phys. Rev. E 67, 026120:1-6.
- (25) Klemm K, Eguiluz, V M, Toral R and San Miguel M (2003) Physica A 327:1-5.
- (26) Macy, M. W. (1991) Am. J. Sociol. 97:808-843.
- (27) . Blau, P. M, and J E Schwartz (1984) Crossing Social Circles (Academic Press, Orlando).
- (28) . Centola D, Robb W, and Macy M W (2005) Am. J. Sociol. 110(4):1009-40.
- (29) Castellano C, Marsili M, and Vespignani A (2000) Phys. Rev. Lett. 85:3536-3539.
- (30) Durkheim (1897) Suicide (The Free Press,N.Y. reprint , 1997).