Mathematical Models of Progressive Collapse and the Question of How Did the World Trade Centers Perish
Abstract
We derive discrete and continuous class of mathematical models that describe a progressive collapse in a fictional one-dimensional structure, where we consider plastic and elastic types of collisions. We examine static (collapse initiation lines, derived from the ultimate yield strength of the structural steel) and dynamic (duration of collapse, computed using mathematical models) features of events that comprised the collapse in WTC 1 and 2. We show that , the dynamic and static aspects of the collapse are mutually consistent and weakly dependent on the class or type of mathematical model used, and , that the NIST scenario, in which the buildings collapse after a sequence of two damaging events (airplane impact and subsequent ambient fires), is inconsistent with respect to the structural strength of the buildings. Our analysis shows that the force that resisted the collapse in WTC 1 and 2 came from a single structural element, the weaker perimeter columns, while the second structural element, the stronger core columns, did not contribute.
We derive continuous model to examine the collapse of WTC 7 and, again, find consistency between the static and dynamic features of collapse. We show that the collapse of WTC 7 to the ground is inconsistent with the FEMA/NIST scenario, by which the collapse was due to gradually worsening conditions in the building. Instead, we find that for the conditions in the building to change, from being compromised by heat to being on the verge of collapse, yet another damaging event is necessary, the magnitude of which is greater than that of the heat.
We discuss two non-obvious inconsistencies between the mathematical models of progressive collapse based on the NIST scenario, and the practical realizations of collapse in WTC 1 and 2: , the average avalanche pressure is 3 orders of magnitude smaller than the pressure the vertical columns are able to withstand, and , the intact vertical columns can easily absorb through plastic deformation the energy of the falling top section of the WTCs. We propose collapse scenario that resolves these inconsistencies, and is in agreement with the observations and with the mathematical models.
pacs:
45.70.Ht 45.40.Aa 45.20.dfI Introduction
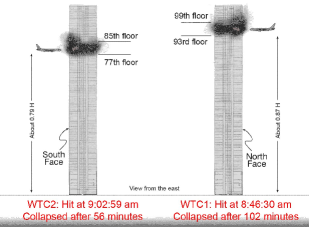
On September 11th, 2001, World Trade Centers (WTC) 1 and 2 were each hit by a commercial airplane. Approximately 56 minutes after being hit WTC 2 collapsed to the ground in what appears to be a single-front avalanche, which started in the upper half of the building and reached the ground floor in s. WTC 1 followed the similar destiny some 50 minutes later, where its collapse lasted s. In 2002, Federal Emergency Management Agency (FEMA) published a WTC performance study FEMA 403/2002 (2002) that concluded that the buildings were built properly. National Institute for Standard and Technology (NIST) followed with its own report on collapse in 2005 NIST National Construction Safety Team (2005). The NIST report agreed with the FEMA findings that the buildings did not have design flaws. It dealt mainly with the conditions throughout the impacted floors and how the damage from the impact and subsequent fires could have compromised the load carrying capabilities of the central core of the building in the impact zone.
In this report we use mathematical models of progressive collapse with the structural parameters of the buildings to examine the consistency between static and dynamics features of collapse. Here, under the static features we assume the conditions in the building on the verge of collapse, while under the dynamic we assume the observed duration of collapse as calculated using the mathematical model of progressive collapse.
The report is organized as follows. In Sec. II we present the mathematical models of progressive collapse, where we introduce two classes (discrete and continuous) and two types (elastic and plastic) of models. We briefly discuss the underlying physics and how the structural parameters enter each class of the models. In Sec. III we discuss the structural parameters of WTC 1 and 2 and introduce their two main load-bearing structures, the weaker perimeter columns (PCs) and the stronger core columns (CCs). In Sec. IV we discuss the NIST scenario of collapse, and show how it is inconsistent with the static features of collapse (collapse initiation lines) unless one neglects the contribution of CCs. In Sec. V we present our conclusions, while in Sec. VI we discuss some less obvious assumptions. One group assumptions is hidden behind the one-dimensional formulation of progressive collapse, while the other behind, so-called, rigidity assumption, by which the range of elastic/plastic deformation of a column does not spread beyond the stretch of a single storey. In Appendix A we present mathematical model of collapse of WTC 7 and analyze it in the same way as it was done for WTC 1 and 2.
II Mathematical Models of Progressive Collapse
The World Trade Centers 1 and 2 were complex three-dimensional structures, yet it appears that the progressive collapse in each of them was one-dimensional: an avalanche formed at the top of the impact zone and propagated to the ground. Based on that fact, we describe two classes of the mathematical models that were proposed for description of the progressive collapse of the buildings: continuous and discrete. An assumption, both models critically depend on, is that the avalanche front - a fictional plane that moves with the velocity of the avalanche and through which the building underneath joins the avalanche - maintained its shape (flatness, being parallel to the ground) for the whole duration of collapse.
Less important assumptions are those regarding the loss of mass and momentum and the rigidity. As for the losses, in the case of a massive building, such as the WTCs, one could expect lateral (material leaking on the sides) and longitudinal (significant variation in resistive force along the avalanche front prevents formation of a sufficiently compacted layer that would be able to crush strong vertical columns in its path). The rigidity assumption, on the other hand, requires that the interaction between the avalanche and the building is localized only to the point of contact, and not any further into the building beneath. In our exposition of the mathematical models we thus assume no losses of any kind, and a reasonable rigidity in the building, all of which contributed to the apparent one-dimensionality of the avalanche propagation.
II.1 Continuous Models
For the purpose of our models we assume that the avalanche propagates along the -axis, where the positive direction is along the direction of Earth’s gravity. The building in which the avalanche propagates thus initially stretches from 0 (top) to H (bottom), and its longitudinal mass density is described by , where is the total mass of the building.
In the continuous class of mathematical models of progressive collapse, the avalanche at position consists of two objects moving together: the top section, and the avalanche front. The top section is the part of the building initially stretching from 0 to , where is the point at which the avalanche started. The avalanche front is a zero-size object that contains all the mass the avalanche has collected during its fall. The total mass of the avalanche is thus the mass of the top section and the mass of the avalanche front, and is given by . The destruction of the building occurs at the interface between the avalanche front and the stationary part of the building, where all the transfer of mass and momentum between the two occurs.
We consider the perfectly inelastic (plastic) collisions between the avalanche front and the building first. Here, the rate of change of momentum of the avalanche follows from elementary Newtonian dynamics, and is given by
| (1) |
where is the velocity of the avalanche. In Eq. (1) the term comes from the average resistive force produced by the building. It measures how does the building oppose its own destruction by the avalanche, and is intimately related to, so called, the yield strength of the structural members that provide the vertical support to the building. The term is the usual gravitational force, where is Earth’s gravity. In this formulation the resulting equation resembles that of a falling water drop Edwards et al. (2001); Krane (1981) or a falling chain. Keiffer (2001); Thornton and Marion (2004)
The collisions between the avalanche front and the building can also be considered as perfectly elastic. This assumption leads to the Lagrangian formalism, which requires that all relevant energies be expressible in terms of a small set of configuration coordinates and their time derivatives (generalized velocities). For this particular problem position of the avalanche, , and its velocity, , are the most obvious choice. The relevant energies necessary for Lagrangian are as follows: is the kinetic energy, while is its potential energy. Additionally, we need energy associated with the structure of the building, , as a result of which the resistive force appears. In Lagrangian formulation the equation of motion follows from , where is the Lagrangian:
| (2) |
A practical physical realization of such system is a standard textbook problem Wong and Yasui (2005); Thornton and Marion (2004) of a falling chain. Please note, Eq. (2) can also be derived from Eq. (1) by considering not only a mass transfer but also a transfer of momentum. Thorpe (1962); Tiersten (1969)
Eqs. (1) and (2) can be jointly written as
| (3) |
where we introduce an additional parameter, elasticity, , which describes the type of collisions between the building and the avalanche front, of which plastic and elastic collisions are just the extremae, and , respectively. One can envision obtaining the value of by fitting the actual progression of the collapse in time to that predicted by the model Eq. (3).
To simplify the analysis of progressive collapse further we assume that the building is homogeneous height-wise, i.e., . Finally, we convert Eq. (3) to dimensionless form where we use as the unit of length the height of the building , and as the unit of time the free fall time from height , . The position of the avalanche in time is described as a solution of the following ordinary differential equation:
| (4) |
where prime denotes the differentiation with respect to dimensionless time . We elaborate on the initial conditions and later, while we discuss the resistive force next in the context of the discrete models.
II.2 Discrete Models
In the discrete models the building is represented by a periodic structure of stacked stories, Bažant and Verdure (2006) where each storey consists of a floor and a number of vertical columns which keep the stories at their positions , where is the floor number, while is the total number of floors in the building. The height of each storey is .
Just like in one-dimensional continuous model Eq. (3), the avalanche in discrete model propagates only in vertical direction. Let us assume that the consuming of a storey by the avalanche comprises of three phases, resistive, free fall and adsorption, where each phase takes a definite amount of fractional floor height, for resistive, for free fall, and for adsorption. Obviously, . The fractional height is sometimes called the compaction ratio. Bažant and Zhou (2002) During first two phases the avalanche moves without acquiring the mass, where the resistance of the vertical columns is and , respectively. After dropping by the fractional height the avalanche makes a discontinuous jump by and adsorbs the compacted storey in the process. The progressive collapse of the -th storey of mass is described by the following set of dimensionless equations:
| (5a) | |||
| (5b) |
where , with being the floor number of the current avalanche position. Here, is the velocity of the avalanche at the beginning of the storey, while is how long it took the avalanche to transverse the storey. In Eq. (5b) we introduce a parameter in the same way it appears in the continuous model (3),
| (6) |
where is the average velocity of the compacted storey at the moment it is adsorbed by the avalanche, the velocity of which is , see Eq. (5a).
In Eqs. (5b) and (6) one can see that the rigidity assumption put forth by Bazant et al.bazant2000 is expected to hold, at best, only for the height scales greater than the storey height, but not for smaller. The compaction of the storey by the avalanche begins the moment the avalanche enters the storey, and by the time the avalanche reaches the position some of the storey’s mass is already moving with the velocity of the avalanche , so in fact .
II.3 Resistive Force: discrete vs. continuous
The resistive force is the force the building opposes its own destruction by the avalanche. Bazant et al.Bažant and Verdure (2006) call it the “crushing force,” and for the most part of their calculation they assume that its magnitude is a constant with respect to height. For our investigation we relax that assumption by allowing to vary with height in a simple linear fashion,
| (7) |
where is the total mass of the building, and is the scaled height. As we will see later, when we discuss the load-bearing capacity of the structure of WTC 1 and 2, this will turn out to be more accurate description.
Let us now discuss the resistive force within the discrete (floor) model. We posit that the building is rigid, i.e., that the floor that avalanche is currently penetrating sits on an infinitely strong structure. With that assumption the interaction between the building and the avalanche is localized to the floor of contact between the two and not beyond. Now, as the avalanche enters the storey it first encounters the resistive force from the vertical columns, call it . Over the fractional length the vertical columns maintain ultimate yield force under compression. In other words, for the first phase of floor destruction the fractional distance corresponds to the yield strain , while corresponds to the ultimate yield force.
Assuming that avalanche has passed the fractional distance , the columns fail. The failure mode of the column is debatable: if the columns are compressed by the avalanche than they fail by buckling. However, if the avalanche front consists of crushed material, so that the ends of the vertical columns facing the avalanche are free, then the failure mode may be bending, as well. Either way, we assume that during this phase the column does not offer any resistance. In other words, for the fractional distance of the avalanche falls freely, .
The last phase of propagation occurs when the avalanche reaches the fractional distance of , that is, it compacts the storey. We assume that then the position of the avalanche makes a discontinuous jump from to 1 (bottom of the current storey) and adsorbs the mass of the storey as discussed earlier, see Eq. (5b).
The resistive force that enters the continuous models is related to in the discrete model via the energy argument. By that argument the energy over the fractional length is the same in both models, yielding
| (8a) | |||
| (8b) |
As we have two descriptions of the resistive force, we choose the discrete as the primary. Thus, whenever we talk about the parameters of the building we always assume those entering the discrete model, thus . If we use continuous models for what ever reason then we imply that the nominal, or discrete, values were converted to via Eq. (8) before commencing the computations.
A question may arise if the two models for the same nominal values of and give the same or, at least, similar results. The question is not so much relevant from the computational point of view: recursive relations (5) comprising the discrete model are actually simpler to numerically implement than the ODE comprising the continuous model (4). On the other hand, the continuous model allows us to use a number of theoretical tools (Lagrangian formalism, energy analysis, & c.). The main difference between the models is in the distance the avalanche propagates. In the continuous model the avalanche covers the full height of each storey, . In the discrete model, on the other hand, in each storey a section of fractional length is excluded from propagation, so the effective height per story is . For the quantity we are interested in, which is the duration of collapse or collapse time, we expect both models to be similar for the following reason. The collapse time depends on the velocity and the distance as . When we change from discrete to continuous model the path increases but so does the velocity as there is more energy available. In the lowest order of approximation the two effects are thus expected to counteract each other. In fact, we use the spread between the two models as a measure of uncertainty when determining and that yield desired (observed) collapse time.
On the other hand, by comparing plastic () to elastic case () the following is obvious: given the collapse time is shorter in elastic than in plastic case. This difference, as is common knowledge, comes from the energy dissipation inherent in plastic model. In spirit of “no-energy-and-momentum-left-behind,” by which we try to neglect as many losses as possible to obtain the lower estimates on collapse times, we assume for most of the computations that follow.
II.4 Bazant’s model
Bazant et al.Bažant and Verdure (2006) proposed the following mathematical model to describe the progressive collapse in World Trade Center 2,
| (9) |
where, as before, is the position of the avalanche front and is the average floor “crushing” force. Additionally, the resistive force that enters the computations is to be halved along the whole length of the building due to the “heat” effects (see p.15 on-line edition, top paragraph). Finally, for the most part of their presentation the authors assume that the computational value for the parameters of the resistive force are and (for crushing energy of GNm, m, where the total mass of the building is kg). Based on their modeling the authors concluded (sic!) that there was nothing unusual in the way the building collapsed.
The rest of this paper is to show that the alternative interpretation is possible. As already discussed, the scaling of kinetic term on the right-hand-side in Eq. (9) is unnecessary to equate the discrete to the continuous model. In fact, this procedure is equivalent to boosting the force that accelerate the avalanche by a factor of . Similarly, the model Eq. (9) is non-conservative to embody rigidity assumption against which, the reader might recall, we argued. Finally, no attempts were made on authors’ behalf to correlate the information about the status of the building to the values of the parameters that enter the model. Heat argument that the authors used to halve the magnitude of the resistive force in the whole building is in direct contradiction with the NIST report, which explicitely states that no temperatures higher than 200oC were measured anywhere in the building below the impact zone.
Overall, it appears that the authors tried to compensate for slowness of their non-conservative model by boosting the energy and arbitrary halving the strength of the building. For these reasons, we exclude Bazant’s model from the analyses that take the rest of the paper.
III Structural parameters of the World Trade Centers
World Trade Centers 1 and 2 were designed as the external tubular frame around the strong central core. Wikipedia (2006a) Tubular frame consisted of 236 perimeter columns (PC), while the central core consisted of 51 core columns (CC), all from structural steel of nominal strength 36-100 KSI. These provided load-bearing support to the whole structure, while the combination of steel trusses and concrete panels stretching between the two groups of columns provided actual floors for occupants to dwell on. We recall that the destruction is determined by the ultimate, rather than the nominal strength of the vertical columns.
PCs, the external dimensions of which were 14”-by-14”, were made of structural steel the yield strength of which varied from nominal 36 KSI (ultimate 58 KSI) and thickness ” at the top of the building to nominal 100 KSI (ultimate 110 KSI) at the bottom.NIST National Construction Safety Team (2005) The thickness of the steel plates at the bottom, to the best of author’s knowledge, is not yet publicly available. CCs were made of structural steel which varied from nominal 36 KSI (ultimate 58 KSI) at the top to nominal 42 KSI (ultimate 60 KSI) at the bottom. Neither the dimensions or the thickness of the steel plates used for CCs, to the best of the author’s knowledge, are yet publicly available. The NIST report NIST National Construction Safety Team (2005) claims that there were two types of CCs: “standard” and “massive,” where the four “massive” columns, one at each core’s corner, “together provided 20% of load-bearing capacity of the core.” This was recently proven to be misleading:9-11 Research (2007) information released to the public shows that of 51 CCs at least 16 (along two longer sides) were of external dimensions 22”-by-55” and of thicknesses up to 5”. To obtain the values for our models we proceed as follows. For each structural element, the PCs and the CCs, we find the scaled ultimate yield force , at the top () and at the bottom (). The parameters and are then obtained using
| (10a) | |||
| (10b) |
For the PCs we assume that the thickness of the plates at the bottom was ”, yielding
| (11) |
where kg is the estimated mass of the building, while is gravity.
As for the CCs, we do base our expectations on the following: all 51 column were of dimensions 22”-by-55”, while their thickness and strength varied from 1” and nominal 36 KSI (ultimate 58 KSI) at the top, to 5” and nominal 42 KSI (ultimate 60 KSI) at the bottom. This yields,
| (12) |
Please note, the assumption of all 51 columns being the same appears to be corroborated by the floor plans: NIST National Construction Safety Team (2005) all CCs appear to have the same footprint. Also, while this estimate is purely hypothetical, it turns out that, it is also irrelevant for the analysis of collapse that follows.
We observe that from Eqs. (11) and (12) the ultimate safety factor of the WTCs is . This is a reasonable estimate considering the dimensions of the buildings and the other safety requirements that entered the structural calculation (ability to withstand hurricane winds and an airplane impact).
From the properties of structural steelBeer and E.R. Johnston (1981) it is known that the yield strain under tension and compression are fairly similar, and is . In our model this is represented by , which we take to be . The value of compaction limit we take from Bazant,Bažant and Verdure (2006) , which leaves . From there, in the continuous model are related to in the discrete values as,
| (13) |
IV Failure of the NIST scenario
As is known, WTCs 1 and 2 were subjected to two damaging events, as a result of which the buildings eventually collapsed in s (WTC 1), and s (WTC 2). The first event was an airplane collision in which some of the vertical columns were cut or otherwise compromised. We label that event with a letter , for Mechanical. The second event was a gradually developing heat damage from ambient and jet-fuel fires. We label that event with a letter , for Heat. Both types of damage were delivered to each building only in the primary or impact zone, while the secondary zone (below the primary) was left intact. We note that the primary zone in WTC 1 spread over floors to , while in WTC 2 it spread between the floors and . Both buildings had the same number of floors .
Let us now formulate, what we call, the NIST scenario for the collapse of WTC 1 and 2. For that we need to define first the primary zone damaging event or NIST():
Definition: A primary zone damaging event, NIST(), is an incident as a result of which the nominal strength of the resistive force in the primary zone of the building, , is reduced by a factor with respect to the value in intact building, .
This is written as,
| (14) |
where , for . The NIST scenario regarding the collapse of WTC 1 and 2 is thus formally expressed as,
Definition: A NIST scenario of collapse, or NIST(), is a sequence of two primary zone damaging events to which a building is exposed: , with , and , with . As a result of the first event, NIST(), the building does not collapse. It collapses only after the second primary zone damaging event, NIST(), where the duration of collapse is known to be .
Let us estimate factors and , as they are essential for the NIST scenario. The NIST report NIST National Construction Safety Team (2005) documented the damage to the primary zone fairly well. WTC 1 suffered frontal hit, and after the aircraft penetrated the building it exploded inside. We assume that for WTC 1 we have
| (15) |
that is, we assume that the aircraft destroyed 50% of the PCs and of the CCs. WTC 2, on the other hand, was hit in the corner. Parts of the airplane flew through the building and most of the fuel exploded outside the building. We thus assume that for WTC 2 we have
| (16) |
that is, we assume that the aircraft destroyed 25% of the PCs and the CCs. As for the heat damage, it is reportedNIST National Construction Safety Team (2005) that the temperatures of up to 600oC were measured at some of the locations in the primary zone. As is known, at that temperature the structural steel loses approximately one-half of its strength. We thus have
| (17) |
for both buildings.
Now that we have and for each building, we recall that the collapse initiation occurred at the top of the primary zone, at position , where for WTC 1, , and for WTC 2, . This allows us to construct the collapse initiation lines. The collapse starts at point because the yield force of the compromised building, , is not sufficient to resist the weight of the building above,
| (18) |
Please observe, the collapse initiation lines are derived from static properties of the buildings, thus they do not depend on the mathematical model used to describe the dynamics of collapse.
The collapse initiation lines according to the NIST scenario of collapse are as follows:
-
•
0-damage line:
(19) -
•
M-damage line:
(20) -
•
M+H-damage line:
(21)
where , for WTC 1 and 2, respectively. Please note, in Eqs. (19)-(21), and represent the intact building parameters. Obviously, these lines limit and the buildings could have had. E.g., the buildings do not collapse originally, thus their and are somewhere above the 0-damage line, Eq. (19). Similarly, the building does not collapse after an -event, thus and are somewhere above the -damage line, Eq. (20). On the other hand, the buildings do collapse after a combined -event, thus and are somewhere between the -damage line and the damage line, Eq. (21).
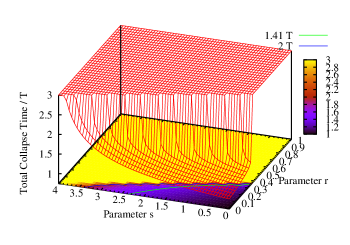
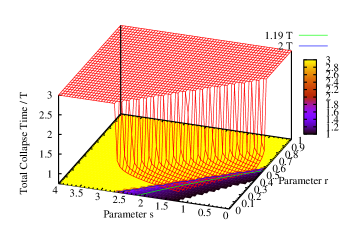
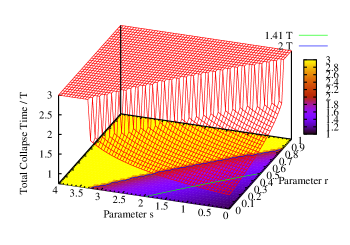
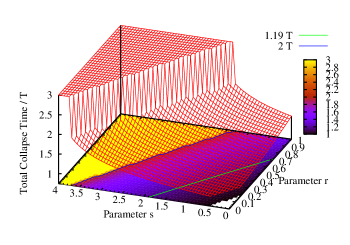
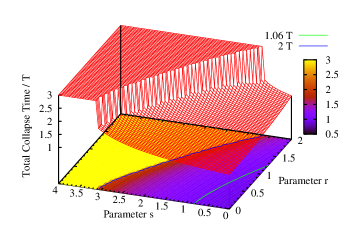
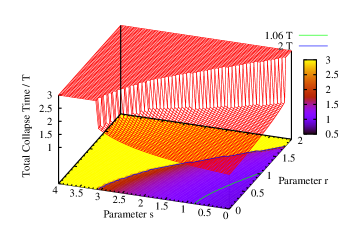
Now we use the mathematical models of progressive collapse and calculate the collapse duration lines and , for , where we assume that the avalanche started at the top of the primary zone, , with zero velocity, . The total collapse times are scaled with the free fall time s, from the height of the building, m, so that ( s, for WTC 2) and ( s, for WTC 1). In our mathematical models we use , as this provides the shorter collapse times than . We show in Fig. 2 collapse time as a function of building parameters and in each building for the scenario.
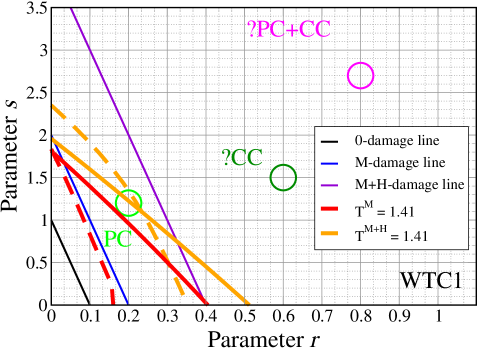
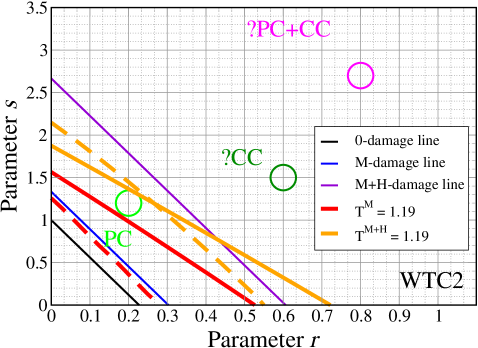
In Fig. 3 we plot the collapse duration lines (from discrete and continuous model) for and scenarios, the collapse initiation lines and the points that correspond to the known ultimate yield strength of the perimeter columns (PCs), the guessed ultimate yield strength of the core columns (CCs, with question mark), and the guessed ultimate yield strength of both (CC+PC, with question mark). We observe that the position of the of the collapse duration lines, , varies somewhat with respect to the class of the model (discrete or continuous), but the difference is not critical. In fact, we use this spread to estimate the approximate range of that yield the observed collapse time .
For the -event (mechanical damage from the airplane impact), we observe that the respective collapse initiation line overlap with the collapse duration lines. On its own, the overlap implies that the spontaneous collapse of the building as a result of mechanical damage only is not impossible. However, because and corresponding to the -event are well below the estimated strength of the PCs The PCs in each building’s secondary zone appear to have been non-compromised prior to collapse, so this must be a minimum resistive force the building could have provided. Thus, we conclude that the buildings survived the -event, which in fact they did.
For the event (heat damage that followed mechanical damage), in the expected range of parameters ( and above that of PCs) the collapse initiation line does not overlap with the collapse duration lines. This can be interpreted in two ways: first one is that the collapse was not spontaneous, while the second is that the reduction of strength due to heat damage was smaller than presumed, that is, . We observe that, if the latter were the case, by decreasing , the lines for the event (collapse initiation and duration) move toward the same lines for the event. However, the collapse duration lines move “slower” than its -damage line, so for some the two can overlap.
More importantly, we find that the and of the PCs are located in the region bounded by the collapse duration lines. This means that in each building the collapse initiation and duration are consistent with the NIST() scenario being applied to the PCs only, while the stronger core columns (CCs) are not present at all. This in turn implies that the NIST scenario is incomplete: the collapse of the buildings to the ground requires yet another damaging event, the sole purpose of which is a destruction of the CCs in the secondary zone. We label this damaging event the “wave of massive destruction” (WMD), because of its catastrophic nature. Interestingly, the avalanche we have discussed so far can only appear in its wake, and is thus a result of the WMD rather then the other way around.
V Conclusion
We have determined the static and the dynamic features of a progressive collapse in the WTCs using the structural properties of the building and the mathematical models of the avalanche propagation. We have formally expressed the destruction scenarios proposed by NIST as a sequence of damaging events in the primary (or impact) zone of each building, which leave the secondary zone (below) intact. We have shown that the static and dynamic features of collapse are mutually consistent. On the other hand, we have demonstrated that the NIST scenarios are inconsistent with the structural parameters of the building. More precisely, the features of the avalanche propagation (initiation and duration) indicate that in their final moments the buildings did not have the core columns (CCs). We conclude that the buildings did not perish because of combined mechanical and heat damage to their primary zones, but because of yet another catastrophic event: a wave of massive destruction (WMD) that destroyed the CCs, following which the buildings collapsed to the ground.
VI Discussion
A physical situation where a building is being pushed to the ground by the impact of its top section, where its structural strength comes from a few vertical elements, is implausible. Consider the following:
-
1.
Destruction of vertical columns: Floor plans of the WTCs show floors shaped as flat rectangular doughnuts. The perimeter columns (PCs) are on the outside, while the core columns (CCs) are on the inside. Each floor consists of a concrete surface supported by trusses stretching between the vertical columns. If we thus think of the avalanche front as being made of the floor material, we see that the avalanche front does not stretch horizontally far enough to reach the PCs and CCs. In the proposed model of collapse, however, it is implied that the avalanche front is wide enough to reach both columns, and provides sufficient pressure at the edges so that the vertical columns fail. These assumptions are well hidden in the one-dimensional formulation of our mathematical models: all the pressures are integrated over the perpendicular cross section of the building, and only then the equations of motion are derived.
Consider the average pressure created by the avalanche at the bottom of the primary zone, , which is given by
(22) Here, is an approximate length of the side of the building. We get KSI for WTC 1, and KSI for WTC 2, which is three orders of magnitude smaller than nominal 36-100 KSI (ultimate 58-110 KSI) the vertical columns were able maintain while yielding in plastic deformation. Bazant et al.Bažant and Verdure (2006) argued that an avalanche propagating through the primary zone would get sufficiently compacted so that it could provide necessary pressure. We see two insurmountable problems with this suggestion. First, the avalanche front can only “grow” thicker - it cannot expand laterally in such a fashion that would allow its edges to be strong enough to crush the vertical columns. Second, for compaction to happen the floor material has to be compressed between two solid surfaces, and we see that there are no such surfaces on either end of the avalanche front. In fact, the strength of the vertical columns will redirect the avalanche (which now consists only of destroyed floor material) to the region in-between the columns. The formation of such avalanche is promoted by the relative weakness of the floors, the resistive force of which is ,Lew et al. (2003) per each floor, as compared to the resistive force of the intact vertical columns, .
-
2.
Rigidity assumption: The NIST report claims that the collapse started because the vertical columns could not absorb the energy of the falling top section of the building. NIST National Construction Safety Team (2005) By design, all vertical columns were continuous structures that stretched from the ground floor to the top of the building. Lateral support was added to them to prevent them from buckling under load, so that they would behave as “short columns.” For our models we assumed that the vertical columns are indeed short columns: under compression they maintain their ultimate strength until the yield strain is reached. The rigidity assumption enters here as the location where the fracture occurs - at (according to Bazantet al.Bažant and Verdure (2006)) or near the interface between the avalanche and the vertical column. However, this is a slow compression of the column (the velocity of the source of compression is much smaller than the sound velocity in the steel) so the stress has time to propagate throughout the whole column causing the strain to do the same. As a result, the fractional distance should be applied to the full length of the column (, the height of the building) and not to the storey height . Actual yield strain can be estimated from the yield force, , where a local contribution to the yield strain, , is reversely proportional to the local yield force, , in accord with the uniform distribution of deformation energy. This gives
(23) Here, the limiting case of gives , in which case . Calculation with intact parameters, and , gives (, for WTC 1 ) and (, for WTC 2). We leave as an exercise to the reader to show that these distances are sufficient to stop the fall of the top section even if one makes a radical assumption that the avalanche propagated through the primary zone without resistance ().
Solution: In the elastic case ) the velocities at the exit of the primary zone are found from the energy conservation, and (for , one would use as an integral of motion, where is the momentum of the avalanche). Let be the length needed to stop the fall, and let and for the intact secondary zone, as before. Then, is given by
(24) We find for WTC 1, and for WTC 2, which are considerably smaller then their yield strains ’s. Thus, contrary to the NIST claim, the total plastic deformation of the intact vertical columns in the secondary zone was more than sufficient to arrest the fall of the top section.
From our discussion so far it follows that , the secondary zones of both WTC 1 and WTC 2 were not intact - in agreement with the hypothetical WMD destroying the CCs discussed earlier, and , the destruction of the remaining vertical columns (PCs) was either not through compression, or there had to be a mechanism present that would pull the PCs inwards and into the path of the avalanche.
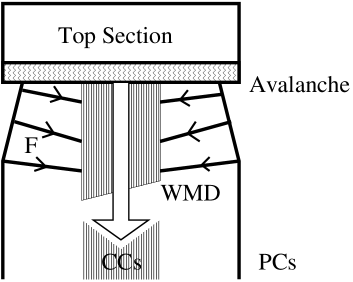
This said, let us propose a consistent hypothetical model of an avalanche. The avalanche is created by severing the core columns (CCs) at some distance from the primary zone. This makes the avalanche consist of the intact top section, the intact CCs of which penetrate the secondary zone, and so give it an overall wedge-like appearance. As a result of weight redistribution, the avalanche now interacts only with the perimeter columns (PCs) from the top of the primary zone down to the level at which the CCs were severed from the secondary zone CCs. The avalanche’s CCs pull the secondary zone PCs inwards, and so compromise them, while the intact top section finishes the PCs as it goes down. In this way, the avalanche never encounters the rigidity of the whole building, just of its small section, as discussed earlier. Furthermore, the pulling action is realized with the intact floor structure in the secondary zone, through the tension of the floor trusses. As is known, the tension yield of the floor trusses is much greater then their shear yield force. From the outside, it appears as if the avalanche starts at the weakest point of the remaining structure: the compromised PCs in the primary zone. By propagating so, the avalanche sees mostly the resistive force of the PCs in the secondary zone, and some friction from the penetration of avalanche CCs into the floor structure of the secondary zone. The compromising of the secondary zone CCs continues so that the next severing point is always ahead of the avalanche: otherwise, the avalanche’s CCs might interfere with the severing, which if prevented would result in a slowing down of the avalanche. The process continues until the avalanche reaches the ground floor. We show the schematic of such collapse in Fig. 4.
Appendix A Collapse of WTC 7

World Trade Center 7 was a building of height m and had total number of stories. It perished together with WTC 1 and 2, where its collapse lasted at most s.
A.1 Mathematical Models
We use Bazant et al.’sBažant and Verdure (2006) term “crush-up” to describe the collapse sequence shown in Fig. 5. Assuming closed system, all the relevant energies can be described in terms of position of the top of the building, . The mass of the moving part is , where is the mass distribution in the building. For brevity, we assume that is a constant, where is the height of the building and is its total mass. The kinetic energy is then , while the potential energy is , where the first term comes from the part of the building still standing, while the second term comes from the collapsed part of the building at rest at height . On the other hand, the structural energy is . As was done before, the equations of motion are derived from the Lagrangian . The equation of motion for the dimensionless position in dimensionless time , where s is the free-fall time, is given by
| (25) |
where is the position of the avalanche front. The parameters of the building in the continuous model, , are related to the discrete (nominal) values of the building , as before, and , cf. Eqs. (8) and (13). Assuming in Eq. (25) yields Bazant et al.’s modelBažant and Verdure (2006) without their boost factor.
We observe that , in Eq. (25) the parameter depends on the external circumstances of the collapse, and , as the acceleration diverges. This divergence comes from the fact that as the building gets shorter, it maintains non-zero resistive force. As this is not the case in an actual building, we fix that problem by recognizing that the acceleration of vanishing building cannot be greater than . The equation of motion we are thus solving reads
| (26) |
As we have shown for WTC 1 and WTC 2, mathematical models of progressive collapse are fairly robust regarding their discrete or continuous and plastic or elastic nature. For the brevity of presentation, we base all our results on the analysis of continuous models. We use the spread between plastic and elastic model to find the range of that yields the observed collapse time.
A.2 Failure of the NIST/FEMA scenario
We formulate the NIST/FEMA scenario regarding the collapse of WTC 7 as follows:FEMA 403/2002 (2002); NIST National Construction Safety Team (2005) The conditions in the building gradually worsened throughout the whole height because of the heat from unattended fires. Eventually the building failed, where the avalanche front was formed between the floors and .
As the actual structural parameters of WTC 7 are not available, to the best of our knowledge, we base the following analysis on known properties a building of such proportions typically has, namely, its total factor of safety: for intact building we take this to be 3.5, just like WTC 1 and 2. Thus, and in the intact building are somewhere on the line . We observe that due to prolonged heat from unattended ambient fires the structural strength of steel can be reduced by at most factor of , corresponding to 600oC. However, as the heat damage is a function of maximal temperature of the fires rather than their duration, we take for more conservative value of . Thus, and in WTC 7 following the heat damage are above the line (=3.5/1.5).
Consider now that the avalanche front in WTC 7 formed at the floor , at the height , where . This allows us to construct the (static) collapse initiation line,
| (27) |
The parameters in the damaged building have to be below the collapse initiation line, Eq. (27), for building to collapse. We check the consistency of static and dynamic features of collapse as before, by computing the collapse duration times from elastic () and plastic () mathematical model (26), where we use standard initial conditions, . We show the collapse duration as a function of and in Fig. 6, where we also plot two contours, and .
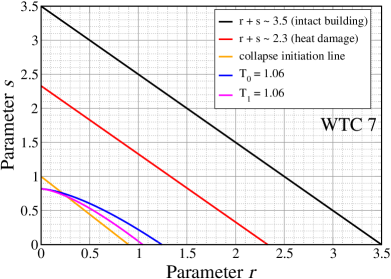
Our findings are summarized in Fig. 7 where we show possible and of WTC 7 together with its collapse initiation and the duration line. There can be seen that the collapse initiation line (orange) is well below the line that describes the building damaged by heat (red). We note that both of these lines are derived from the static properties of the building. On the other hand, the collapse duration line (pink and blue, for elastic and plastic model, respectively) overlaps with the collapse initiation line (orange), meaning that the two are mutually consistent. If the NIST/FEMA scenario were accurate description of transition to collapse then the collapse initiation line had to coincide with the heat damage line. Instead, judging by the gap between the two lines, there had to exist yet another damaging event as a result of which the building collapsed.
References
- FEMA 403/2002 (2002) FEMA 403/2002, World Trade Center Building Performance Study: Data Collection, Preliminary Observations, and Recommendations (Federal Emergency Management Administration, Washington D.C., 2002).
- NIST National Construction Safety Team (2005) NIST National Construction Safety Team, NIST NCSTAR 1 - Final Report on the Collapse of the World Trade Center Towers (U. S. Government Printing Office, Washington D.C., 2005).
- Edwards et al. (2001) B. F. Edwards, J. W. Wilder, and E. E. Scime, Eur. J. Phys. 22, 113 (2001).
- Krane (1981) K. S. Krane, Am. J. Phys. 49, 113 (1981).
- Keiffer (2001) D. Keiffer, Am. J. Phys. 69, 385 (2001), R. Chicón, Am. J. Phys. 71 (9), 951-952 (2001).
- Thornton and Marion (2004) S. T. Thornton and J. B. Marion, Classical Dynamics of Particles and Systems (Brooks/Cole, Belmont CA, 2004), chap. 9, 5th ed.
- Wong and Yasui (2005) C. W. Wong and K. Yasui, Am. J. Phys. 74, 490 (2005).
- Thorpe (1962) J. P. Thorpe, Am. J. Phys. 30, 637 (1962).
- Tiersten (1969) M. S. Tiersten, Am. J. Phys. 37, 82 (1969).
- Bažant and Verdure (2006) Z. P. Bažant and M. Verdure, J. Eng. Mech. ASCE (2006), in press.
- Bažant and Zhou (2002) Z. P. Bažant and Y. Zhou, J. Eng. Mech. ASCE 128, 2 (2002).
- Wikipedia (2006a) Wikipedia, World trade center — wikipedia, the free encyclopedia (2006a), [Online; accessed 1-November-2006], http://en.wikipedia.org/wiki/World_Trade_Center.
- 9-11 Research (2007) 9-11 Research, The core structures (2007), [Online; accessed 1-August-2007], http://911research.wtc7.net/wtc/arch/core.html.
- Beer and E.R. Johnston (1981) F. Beer and J. E.R. Johnston, Mechanics of Materials (McGraw-Hill, Inc., New York, 1981), Ch. 1, 10; App. B.
- Wikipedia (2006b) Wikipedia, Collapse of the world trade center — wikipedia, the free encyclopedia (2006b), [Online; accessed 1-November-2006], http://en.wikipedia.org/wiki/Collapse_of_the_World_Trade_Center.
- Lew et al. (2003) H. S. Lew, R. Bukowski, N. Carino, and D. Duthinh, Analysis of building and fire codes and practices (NIST, U. S. Department of Commerce, 2003), released as a part of Federal Building and Fire Safety Investigation of the World Trade Center Disaster.