Hydrophobic and Ionic Interactions in Nano-sized Water Droplets
Abstract
A number of situations ranging from protein folding in confined spaces, lubrication in tight spaces, and chemical reactions in confined spaces require understanding water-mediated interactions. As an illustration of the profound effects of confinement on hydrophobic and ionic interactions we investigate the solvation of methane and methane decorated with charges in spherically confined water droplets. Free energy profiles for a single methane molecule in droplets, ranging in diameter () from 1 to 4 nm, show that the droplet surfaces are strongly favorable as compared to the interior. From the temperature dependence of the free energy in nm, we show that this effect is entropically driven. The potentials of mean force (PMFs) between two methane molecules show that the solvent separated minimum in the bulk is completely absent in confined water, independent of the droplet size since the solute particles are primarily associated with the droplet surface. The tendency of methanes with charges (Mq+ and Mq- with , where is the electronic charge) to be pinned at the surface depends dramatically on the size of the water droplet. When nm, the ions prefer the interior whereas for nm the ions are localized at the surface, but with much less tendency than for methanes. Increasing the ion charge to makes the surface strongly unfavorable. Reflecting the charge asymmetry of the water molecule, negative ions have a stronger preference for the surface compared to positive ions of the same charge magnitude. With increasing droplet size, the PMFs between Mq+ and Mq- show decreasing influence of the boundary due to the reduced tendency for surface solvation. We also show that as the solute charge density decreases the surface becomes less unfavorable. The implications of our results for the folding of proteins in confined spaces are outlined.
1 Introduction
Hydrophobic interactions are presumed to be the dominant force in the folding of proteins and the assembly of oligomeric structures 1, 2. The nature of hydrophobic interactions in proteins has been clarified using experiments which measure the free energy of transfer of amino acid side chains from a reference solvent to water 3. Indeed, understanding the nature of hydrophobic interactions between small ( nm) solutes has given a qualitative perspective on the major forces that render proteins (marginally) stable 1. Interactions between small hydrophobic solutes have long served as model systems in describing the balance of forces that stabilize proteins and peptides. The distance dependent potential of mean force (PMF) between solutes, such as methane, are quantitatively understood 4, 5, 6, 7. The PMF is a measure of the effect of the solvent (water) on the mutual interaction between hydrophobic solutes. The PMF between two methanes has a primary minimum at nm 4, 8 that roughly corresponds to the distance of closest approach in the gas phase. In addition, there is a secondary solvent-separated minimum at nm in which the two methane molecules are separated by a water molecule 4. The barrier separating the two minima represents, perhaps, the desolvation penalty that needs to be paid to squeeze out water molecules so that a stable hydrophobic core can be created in the protein folding process 9, 10.
Although the nature of hydrophobic forces between small solutes in bulk water is understood, relatively little is known about their interactions in confined droplets. The nature of water-mediated interactions between amino acids in nanopores affects the stability of confined proteins 11, 12, 13, 14, 15. Several experiments have shown that the stability of the folded state, compared to the situation in the bulk, increases upon confinement 16, 17, 18, 19. In many cases the confinement-induced stability is adequately explained in terms of entropic destabilization of the unfolded states 11, 12, 13. However, one can envision scenarios in which alterations in hydrophobic interactions in confined water can also destabilize the folded state 20. The alteration in the properties of confined water are also important in the context of lubrication in thin films 21 and colloid science. Thus, in a number of applications the role highly confined water plays in affecting solvation of hydrophobic and charged species is important.
Motivated by the above considerations, we have calculated PMFs between two methane molecules in confined spherical water droplets ranging in diameter from nm. Interestingly, we find that for all values of the confining diameter , the solvent-separated minimum is completely destabilized because methane molecules are pinned to the boundary of the sphere. In order to describe the competition between charged residues, which would prefer to be fully solvated, and hydrophobic interactions, we have also calculated PMFs between Mq+ and Mq-. Here, one of the methane molecules has a positive charge while the other carries a negative charge. The extent of destabilization of the secondary minimum in the confined space depends critically on the magnitude of the charges, and the ionic radius. The possible implications of our results for protein stability in confined geometries are briefly outlined.
2 Methods
Models: We use Metropolis Monte Carlo 22 simulations to study the energetics of aqueous solvation of methane molecules and the model ions Mq+ and Mq- in confined spherical water droplets. The droplet diameter () ranges from 1.0 to 4.0 nm, and are bounded by hard walls. The potential energy at the wall is large enough ( kJ/mol) that it confines the system to the desired volume. To simulate confinement effects we do not use periodic boundaries. Electrostatic and Lennard-Jones interactions are evaluated without a cutoff. We use the TIP3P model for water 23 and a unified atom representation for methane 24. The Lennard-Jones (LJ) parameters for these interactions are listed in Table 1. Model ions are created by adding charges of magnitude or to the methane spheres, where is the electronic charge 25. In order to assess the importance of charge density in affecting solvation we also study, for the 3 nm droplet, ions M*q+ and M*q- with and twice the volume of the methane sphere. The parameters for their LJ interactions with water oxygens are given in Table 1. Simulations are performed at constant number of molecules , total volume and absolute temperature , and thus sample the canonical ensemble. The simulations are carried out at 298 K and a water density of 997 kg/m3. We also simulated the nm droplet at a temperature of 328 K with one methane, at the same water density.
The number of water molecules , in each droplet, is calculated by assuming that the effective volume available to the water is
where is the number of solute molecules in the droplet and , is the excluded volume due to each solute. With the experimental water density of 997 kg/m3 at 298 K and 1 atm pressure, we get the number of water molecules listed in Table 2.
Simulation details: We performed canonical ensemble Monte Carlo simulations with ranging from 0 to 2 and the appropriate number of waters (Table 2). Each system was equilibrated for at least 107 Monte Carlo steps. Trial moves consisted of a random translation for both solute and solvent molecules and an additional random rotation for solvent molecules only. These were accepted according to the Metropolis criterion 22.
The free energy of a single methane is calculated as a function of its radial distance from the center of the droplet using umbrella sampling. The PMFs between two methane molecules and Mq+ and Mq- confined in these droplets are evaluated using the same technique. We calculated the PMFs using the weighted histogram analysis method (WHAM) 26 with code from Crouzy et al. 27.
We used harmonic biasing potentials, , where is the center of each window and the spring constant is chosen to be 5 kcal/(mol-Å2) 28. Window centers are 0.1 nm apart in all calculations. Data sets consist of data points in every window. Each such data set is added to the previous ones and the WHAM equations 26 are iterated to a tolerance of 27. The calculations are considered to have converged if the addition of the last data set, with at least data points in each window, does not change the final PMF significantly. Typically, between 2.107 and 5.107 Monte Carlo steps are required to achieve convergence.
We adapted a standard method to calculate the radial distribution functions , for the confined water. An inner sphere of radius nm (0.2 nm for the smallest droplets) was defined in each case and the ’s were averaged for all the waters inside this inner sphere. The normalization is therefore accurate up to a distance of , where is the radius of the droplet. These functions go to 0 at a distance of , unlike the case of bulk water where they converge to 1 for large .
Excess chemical potentials , for TIP3P water were evaluated using Bennett’s method of overlapping histograms 29, 30, 31. The histograms of water insertion and removal (binding) energies required for this calculation were collected in simulations with two methanes in each droplet with no biasing potential applied to the methanes.
3 Results and discussion
We first characterize the equilibrium properties of water confined to a sphere to discern the role of the boundary. The boundary should predominantly affect the layer of water molecules close to the surface.
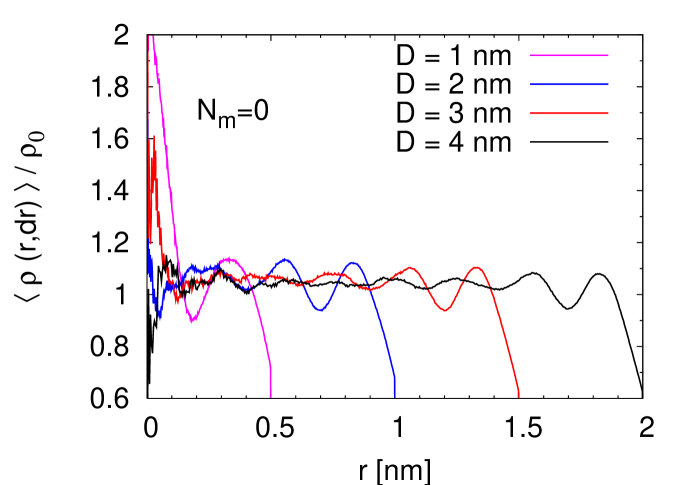
Density profiles of confined water: Water density profiles without methanes, which measure the local density divided by the average density , in the droplet ( where is the total volume of the droplet) are shown in Fig. 1. Remnants of layering, that are expected in the presence of the walls, are apparent. Three layers can be seen for the droplets with , 3 and 4 nm that become progressively less well defined as the droplet size increases. The hard walls confining the droplets induce a narrow region at the surface in which the water density is substantially depleted - at the walls, the density is of the average density, . This results in the scaled density being far from the walls (Fig. 1). Confinement in a droplet perturbs the water structure and the perturbation becomes progressively weaker as the droplet size increases. In the nm droplet the local density is spatially different from the average density at all values of , the distance from the droplet center.
Radial distribution functions for the confined water (Figs. S.1 and S.2 in Supporting information) are identical to those for bulk TIP3P water 23 in all important respects. Confinement causes the ’s to go to 0 at a distance . In the case of the 3 and 4 nm droplets the ’s are greater than 1 for , the range in which there are no oscillations in the functions and the normalization holds. This is due to the fact that the scaled density (Fig. 1) is greater than 1.
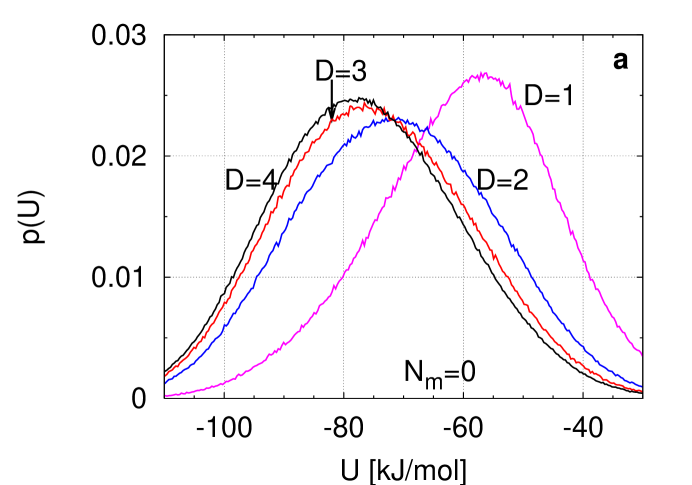
Fig. 2a shows the binding (or removal) energy distributions for all water molecules in droplets of different sizes. The binding energy is the potential energy required to remove a water molecule from the spherical droplet. As the droplet size increases, the peak of the distribution shifts to larger negative values of . i.e. the waters inside become more strongly bound. The distribution for the 4 nm droplet is almost identical to that for bulk TIP3P water 30. By this measure, the largest droplets in this study are substantially bulk-like.
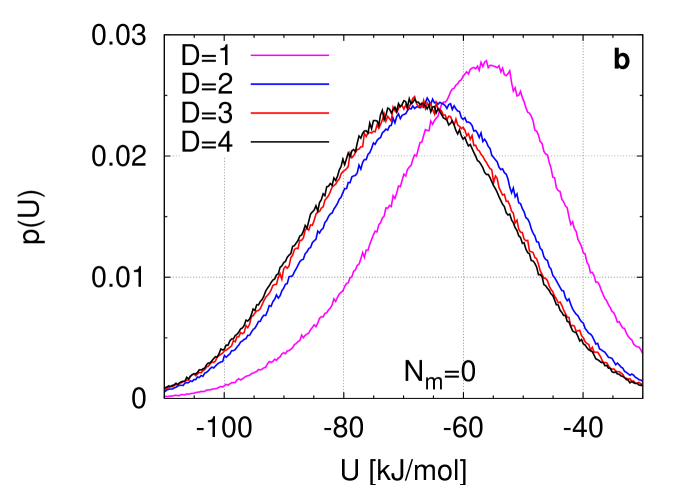
Fig. 2b shows the same quantity evaluated for only the waters in the first layer (defined to be 0.2 nm thick) closest to the droplet surface. The distributions in Figs. 2a and b are virtually identical for the nm droplet. Thus, for small droplets there is essentially no distinction between “surface” waters and water molecules in the interior. For the nm droplet, the two distributions in Figs. 2a and b are similar but not identical. The distribution for the surface waters in Fig. 2b peaks at kJ/mol, while the corresponding one evaluated for all the waters in the droplet (Fig. 2a) peaks at kJ/mol - a difference of , where is Boltzmann’s constant.
For larger droplets with and 4 nm, the surface waters are substantially more loosely bound than those in the interior. We also note that the distributions for the surface waters (Fig. 2b) in the 3 and 4 nm droplets coincide with each other. i.e. even though the 4 nm droplet is more bulk-like than the 3 nm droplet (Fig. 2a), their surfaces are energetically identical.
Fig. S.3 (Supporting information) shows the probability distributions of for surface and interior water molecules for droplets of different sizes. Here, is the angle between the dipole moment of each water molecule and the position vector for its oxygen atom (the origin being at the center of the droplet). Orientations of the interior water molecules are almost isotropic. However, surface waters are preferentially oriented with their dipole moments nearly orthogonal to the droplet radius 32. This implies that a typical water molecule at the surface has one hydrogen atom pointing away from the bulk, in the process sacrificing its ability to donate one hydrogen bond. This conclusion agrees with the results of earlier molecular dynamics (MD) simulations of Lee et al. 33 who probed the behavior of water near a hydrophobic wall.
The -dependent excess chemical potentials of TIP3P water are calculated from overlapping histograms of water insertion and removal energies (see Fig. S.4, Supporting information). As expected, decreases monotonically as increases and approaches the value for bulk TIP3P water (-25.3 kJ/mol) 31. However, even at nm differs significantly from the bulk value. It is clear that in equilibrium with bulk water, none of these cavities will have an average bulk density kg/m3. The presence of the depleted region near the droplet surface implies that the average density inside will be less than when the droplet is in equilibrium with bulk water.
Introduction of methane molecules into the droplets results in some layering in the water around them. Fig. S.5 (Supporting information) shows methane-oxygen radial distribution functions. i.e. probability distributions of methane-oxygen distances , divided by , where is the distance between them and is the droplet radius. Two water layers can be seen around the methanes.
Solvation of methane: Fig. 3a shows the free energy of a single methane molecule as a function of its distance from the center in droplets of different diameters. The position dependent free energy is evaluated using a harmonic biasing potential to localize the methane molecules at different values of , the distance from the droplet center. Each value for corresponds to a shell concentric with the droplet boundary. The final unbiased probability distributions (evaluated by WHAM, as described earlier) are scaled by before taking the logarithm and multiplying by to obtain the free energy. Thus, these profiles do not include the contribution to the entropy.
In droplets of all sizes the surface is more favorable for the methane than the interior by kJ/mol ( at 298 K) 34. This value is similar to the free energy difference of a methane at a water liquid-vapor interface 35, 36. In the largest and the most bulk-like droplet, the free energy difference of kJ/mol is close to the hydration free energy of a methane molecule calculated from simulations and experiment 35. This supports our view of the droplet surface inducing a vapor-like state of low density with broken hydrogen bonds 37. In the 2, 3 and 4 nm droplets, the free energy rises steeply from the minimum at the surface and reaches its interior value within 0.4 nm of the droplet surface and stays constant in the droplet interior. The region with the steep gradient in the free energy coincides almost exactly with the first layer of water in each droplet (Fig. 1). In the smallest droplet ( nm), there is no interior region; the free energy changes continuously over the whole distance.
The preference of the methane for the droplet surface over the interior can be understood in terms of the disruption in the water hydrogen bond network at the surface. The presence of broken H-bonds at the surface implies that the solvent has to pay a smaller entropic cost in solvating the methane if it is confined to the surface. In other words, there is less entropy lost in reordering the hydrogen bonds in the immediate vicinity of the non-polar solute. We attribute the larger free energy differences in 2 and 3 nm droplets to the greater distortion in water structure and greater surface curvature in these droplets. Our interpretation that methane prefers being localized at the surface is consistent with the observation that even in bulk water small hydrophobic solutes occupy regions in which water has the largest number of unsatisfied hydrogen bonds 34.
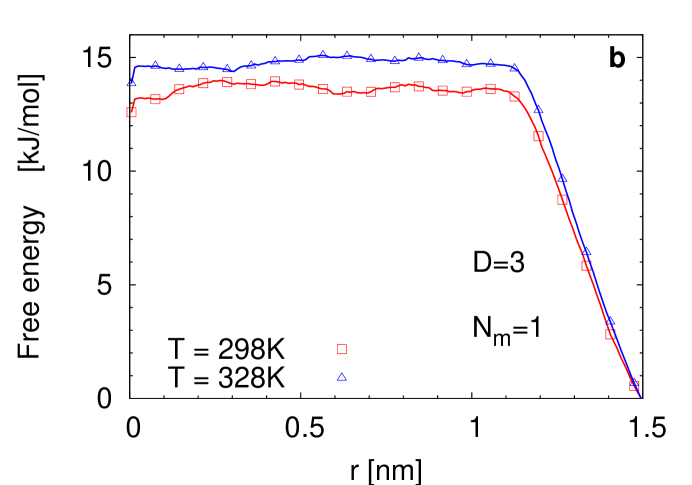
From the temperature dependence of the free energy difference in the nm droplet, we infer that at K the surface is more favorable by about 1.2 kJ/mol compared to K (see Fig. 3b). Estimates for (12.4 kJ/mol at K) and (-1.8 kJ/mol) show that the surface free energy is entropically dominated. Both the entropy and the enthalpy are favorable at the surface of the droplet for methanes.
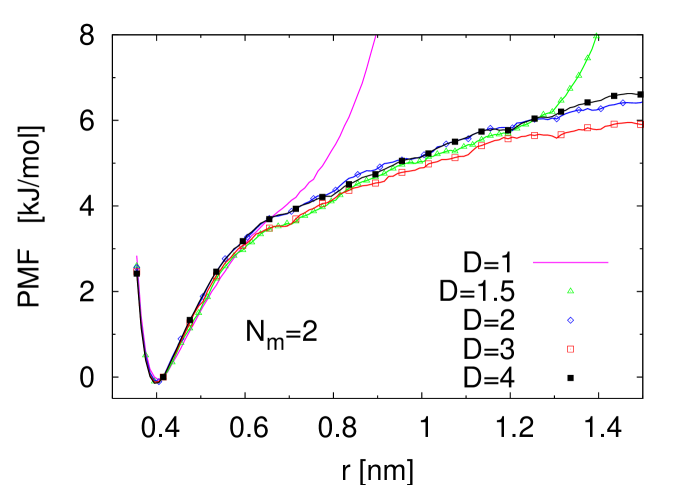
Potentials of mean force between methanes: Since the methane molecules are confined to the surface of the water droplets, their mutual solvent mediated interaction will reflect the disruption in the water structure due to the confining walls. Fig. 4 shows the potentials of mean force (PMFs) for two methane molecules in droplets at various values. Compared with bulk water 8, these show an increased tendency for the methanes to associate. These profiles show only a single minimum at contact. Somewhat surprisingly, we find that the secondary, solvent separated minimum that appears in the bulk profile is completely absent, even when nm. The absence of the solvent separated minimum in the nm droplet, which is entirely due to the presence of boundaries, is intriguing because the properties of water are bulk-like in all crucial respects. The solvent separated minimum in the bulk corresponds to configurations where the methanes are separated by a single water molecule that is hydrogen bonded to other waters. In the immediate vicinity of the confining surface, where water-water hydrogen bonds are disrupted, such configurations are strongly unfavorable. The preference for being pinned at the surface is consistent with a view that a methane is likely to be localized in regions with maximum unsatisfied hydrogen bonds. In confined water droplets this situation is readily realized at the boundary.
A striking feature of Fig. 4 is that the calculated PMFs are independent of the size of the droplet. This is because the methanes approach each other along the surface which is energetically similar in all the droplets (Fig. 2b).
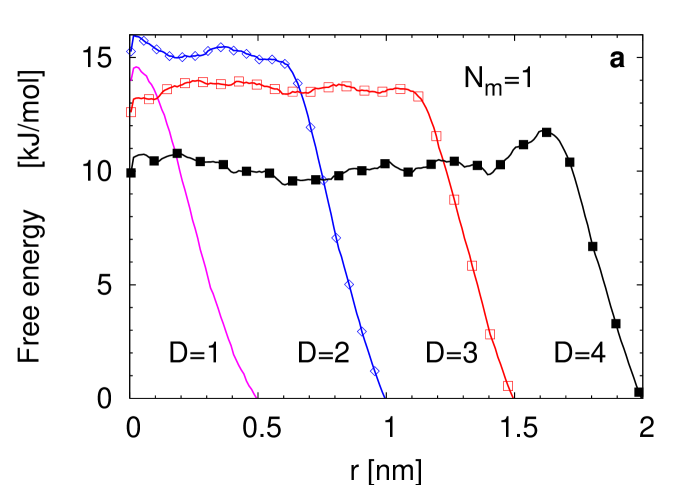
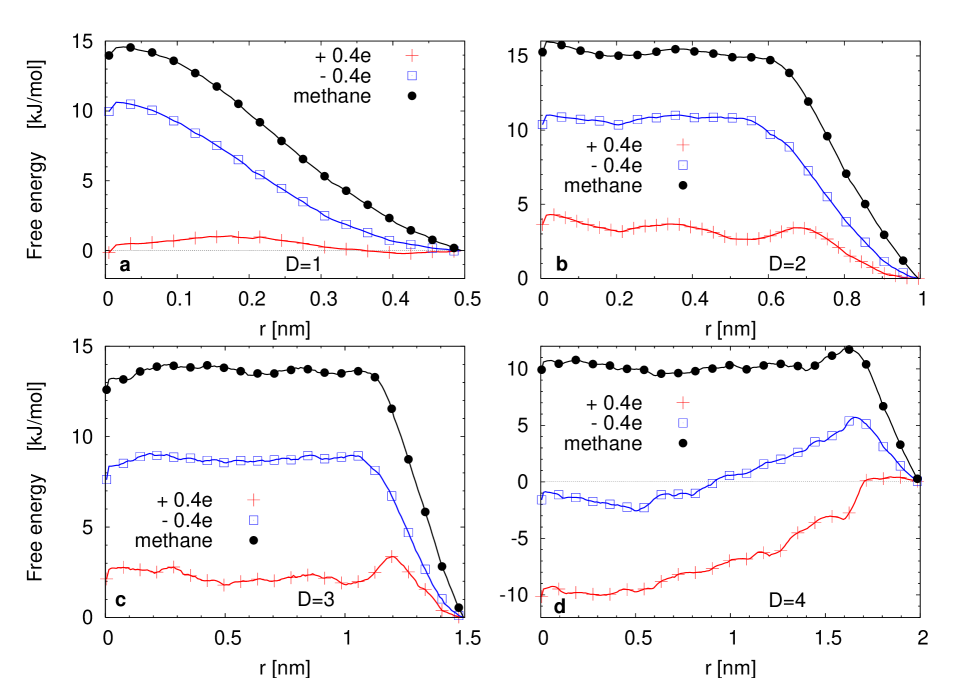
Charged solutes: The interaction between charged solutes Mq+ and Mq- is interesting because of the competing preferences for surface (due to excluded volume) and the interior (due to solvation of charges). Such a situation naturally arises in proteins in which we expect that the charged backbone and polar and charged residues prefer to be solvated in bulk water while hydrophobic residues prefer the surface. It is likely that in confined systems the relative tendency towards surface localization and solvation in the interior of the droplet would depend on the magnitude of . The presence of charges on the solutes will reduce the tendency for surface solvation by making the interior of the droplet enthalpically more favorable. The magnitude of will determine the extent to which ions will be solvated. In Fig. 5 we plot the free energy of Mq+ and Mq- with as a function of their radial position in droplets of different sizes. The free energy profiles show a reduced preference for the surface for ions of either sign compared to methane.
There is a dramatic dependence of the free energy profiles of charged ions on . This finding differs from the behavior of methane which is always found at the surface (Fig. 5). For nm the ions are more likely to be localized near the surface when (see Figs. 5a-c). For the largest droplet (Fig. 5d), the interior which is almost completely bulk-like, is more favorable for both positive and negative ions. The penetration of the ions into the droplet interior increases with decreasing curvature of the droplet surface, in accord with the findings of Stuart et al. for the chloride ion 38. Just as in bulk water 39 there is an asymmetry between the behavior of cations and anions. As increases, the enthalpy gain due to the solvation of the ions is greater than the entropy loss due to ordering of water molecules around this solute. The enthalpy-entropy interplay depends on . In addition, the magnitude of the effect depends on whether the ion is positively or negatively charged. For example, for in (Fig. 5d), Mq- is only marginally more stable in the interior of the droplet compared to the surface. On the other hand, Mq+ is strongly solvated in the interior. Anions have a stronger tendency for surface solvation than cations with the same charge magnitude. Localization of negative ions at the surface enables interaction of water molecules with unsatisfied hydrogen bonds.
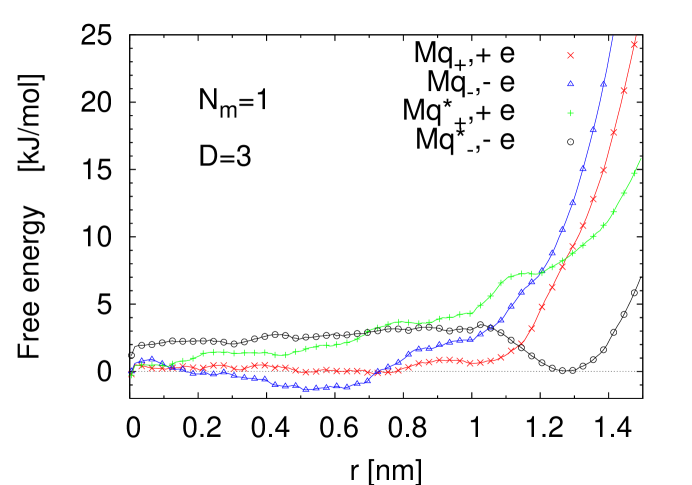
Solute charge density determines the extent of interior solvation: On general theoretical grounds it can be argued that charge density ( where is the volume of the solute) determines hydration of ions. In the case of confined water charge density should determine the preference of the ions for the surface compared to the interior. In order to probe the effect of charge density on ionic interactions we also examined Mq+/- and M*q+/- with (Fig. 6) in a nm droplet. The latter have twice the volume and therefore half the charge density of the former. Both Mq+ and Mq- have a strong (enthalpic) preference for the interior over the surface of the droplet, with the free energy difference being of the order of . Molecular dynamics simulations with a non-polarizable force field 40 have obtained similar values for the the free energies of sodium and chloride ions in water near hydrophobic or purely repulsive surfaces and also at a water liquid-vapor interface. For M*q+ and M*q-, the surface is much less unfavorable compared to Mq+ and Mq- respectively. The profile for M*q- shows that the anion preferentially resides 0.2 nm below the droplet surface, but the barrier to penetrate the droplet interior is only on the order of . Clearly, the solute charge density is important, not just the magnitude of the charge. Whether a solute molecule is solvated at the surface or in the interior depends on the balance between solute-solvent and solvent-solvent interaction energies 41. Decreasing the charge density increases the tendency for surface solvation.
The asymmetry in the solvation of cations and anions in water droplets, along with the charge density dependence can also explain the differences in the solvation of sodium and halide ions in water clusters and slabs 41. Sodium and fluoride ions were found to be solvated in the interior while the larger halides had a propensity for surface solvation in the order Cl Br I-. The tendency for surface solvation in these ions apparently correlates with their polarizabilities 41, but also their charge densities and the sign of the charge. The current results readily explain this trend even without considering polarizability. From our results it is clear that decreasing charge density increases the tendency for surface solvation. For a given charge density, anions have a greater preference for the surface than cations.
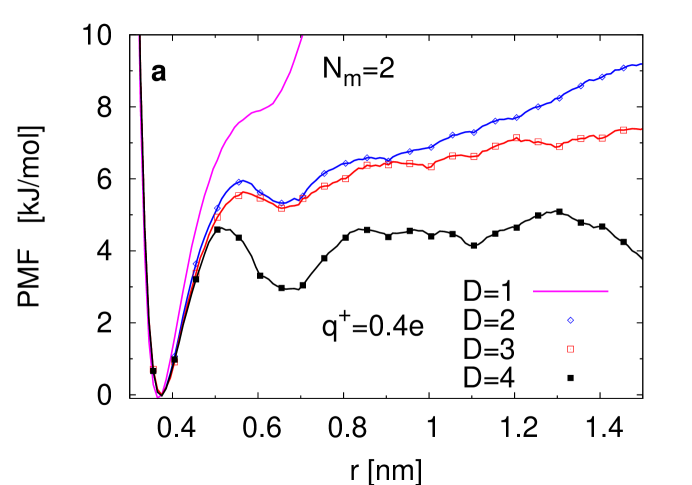
Thus, the presence of electric charge on a solute molecule drives it away from the surface region where solvent hydrogen bonds are broken. Positive ions have a much reduced preference for surface solvation compared to negative ions. This is also reflected in the PMFs between Mq+ and Mq- charge magnitude 0.4 which are plotted in Fig. 7a. As the size of the water droplet increases, the interior becomes increasingly bulk-like and for the largest droplet, the profile is very similar to that for two methanes in bulk water, with a solvent separated minimum at a separation of nm. In the 2 and 3 nm droplets, the secondary minimum is destabilized by kJ/mol relative to the 4 nm droplet, reflecting the greater role of confinement.
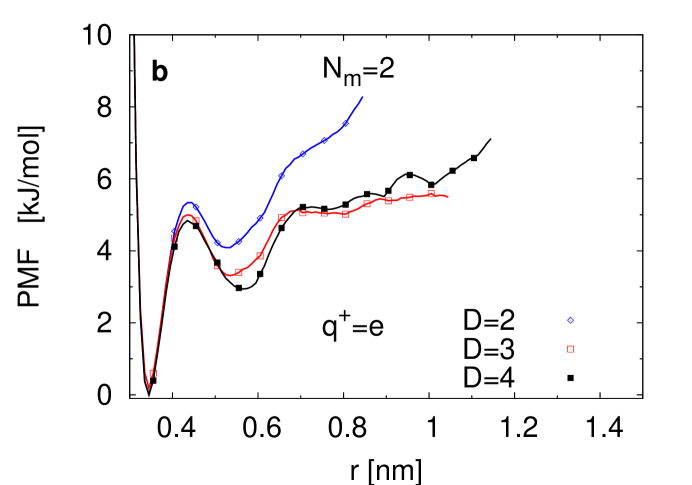
Fig. 7b shows the PMFs between Mq+ and Mq- of charge magnitude . In the 3 and 4 nm droplets, the profiles are virtually identical. This is not surprising since these ions are strongly driven away from the surface even in droplets of 3 nm diameter. The secondary minimum is slightly less favorable (by 0.5 ) in the 2 nm droplet reflecting the effect of confinement.
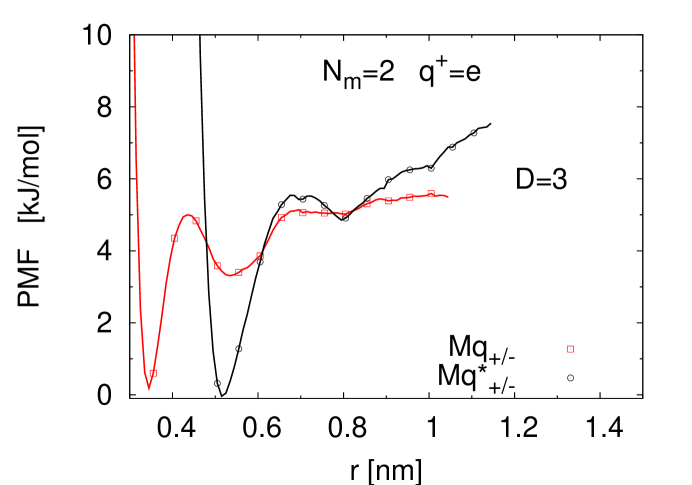
Fig. 8 compares the PMFs between Mq+ and Mq- and M*q+ and M*q- (), in the 3 nm droplet. As M*q+ and M*q- are driven closer to the surface, as a result of the the reduced charge density, the secondary, solvent separated minimum in the PMF becomes shallower.
4 Conclusions
Our results show that methane molecules confined in spherical water droplets have a strong preference for the surface, thereby maximizing the solvent entropy. This effect is due to the extensive disruption of water hydrogen bonds caused by the confining walls. The PMF between two methane molecules confined in these droplets reflects the disruption in solvent structure caused by the confinement. These profiles show only a single minimum at contact; the secondary, solvent separated minimum seen in bulk water is completely absent. Confinement by non-polar walls increases the tendency of hydrophobic solutes to associate. Similar behavior will occur in the presence of non-polar surfaces immersed in bulk water. Since surfaces (confining or otherwise) are almost always present in practical situations, we expect the PMF of Fig. 4 to reflect methane-methane interactions in such cases. The addition of charges to the methanes reduces their preference for surface solvation. Correspondingly, the PMF between Mq+ and Mq- becomes progressively less influenced by the bounding surfaces as the droplet size and the magnitude of charge increase. The balance between interior solvation and preference for the surface is determined by the charge density of the solute. As the solute charge density decreases the boundary of the droplet becomes less unfavorable. Our results show that the enhanced preference of the heavier halides for interfacial water can be fully rationalized in terms of decreased charge density.
The primary motivation for computing the PMF between Mq+ Mq- molecules is to understand the effect of confinement when both charged (or polar) and hydrophobic interactions are simultaneously present. Such is the case in proteins which are made up of hydrophobic () residues and polar and charged residues (). The results for Mq+ Mq- suggests confinement effects on the stability of the folded state depend on the subtle interplay between hydrophobic and charged interactions. Let and denote the energies of confinement-induced hydrophobic and polar interactions respectively. We predict that when then, under folding conditions, the native state should be entropically stabilized 11. In the opposite limit, , we expect destabilization of the folded state with respect to the bulk. When hydrophobic interactions dominate then it is likely that the polypeptide chain is pinned at the surface which invariably destabilizes the folded structure. These qualitative predictions are consistent with explicit simulations of poly-alanine models confined in carbon nanotubes 42. We find that in this case, which corresponds to , the helix is destabilized in the carbon nanotube.
The situation is complicated when as appears to be the case when . Stability of the confined polypeptide chains for which may depend on sequence and the precise interaction energetics between water, peptide and the walls 43, 20. It should be emphasized that conformational entropy of the polypeptide chain and the sequence will play a key role in determining the stability of proteins under confinement. The present study suggests, in accord with the conclusions reached elsewhere 20, that the diagram of states for polypeptide chains is complicated especially when .
It has been proposed 9, 10 that barriers in the folding process arise because water molecules that may be trapped between hydrophobic residues have to be squeezed out prior to the formation of the hydrophobic core. This conclusion is rationalized in terms of the PMF between methane molecules in bulk water, in which there is a barrier between the contact and solvent-separated minima. Such an explanation is likely not applicable for folding in nanopores because of the absence of the solvent-separated minimum between small hydrophobic species in confined water. Our results imply that barriers to protein folding in nanopores should be greatly reduced. If the native state is unaffected then the barrier reduction must arise because of confinement induced changes in the denatured states. The arguments given here show that alterations in the interactions between hydrophobic and charged species in confined water can lead to many sequence-dependent possibilities for folding in nanopores.
5 Acknowledgements
S. V. thanks Ed O’Brien and Margaret Cheung for useful discussions. We are grateful to John E. Straub for bringing Ref. 41 to our attention. This work was supported in part by a grant from the National Science Foundation through CHE 05-14056.
6 Supporting Information Available
Water-water radial distribution functions, probability distributions of water molecule orientations, water excess chemical potentials and methane-oxygen radial distribution functions. This material is available free of charge via the internet at http://pubs.acs.org.
References
- 1 Dill, K. A. Biochemistry 1990, 29, 7133-7155.
- 2 Liu, P.; Huang, X.; Zhou, R.; Berne, B. J. Nature 2005, 437, 159-162.
- 3 Tanford, C. Adv. Prot. Chem. 1970, 24, 1-95.
- 4 Pangali, C.; Rao, M.; Berne, B. J. Chem. Phys. 1979, 71, 2975-2981.
- 5 Pratt, L. R.; Chandler, D. J. Chem. Phys. 1977, 67, 3683-3704.
- 6 Pratt, L. R. Annu. Rev. Phys. Chem. 2002, 53, 409-436.
- 7 Chandler, D. Nature 2005, 437, 640-647.
- 8 Shimizu, S.; Chan, H. S. J. Chem. Phys. 2000, 113, 4683-4700.
- 9 Rank, J. A.; Baker, D. Prot. Sci 1997, 6, 347-354.
- 10 Cheung, M. S.; Garcia, A. E.; Onuchic, J. N. Proc. Natl. Acad. Sci. USA 2002, 99, 685-690.
- 11 Betancourt, M. R.; Thirumalai, D. J. Mol. Biol. 1999, 287, 627-644.
- 12 Zhou, H.-X.; Dill, K. A. Biochemistry 2001, 40, 11289-11293.
- 13 Klimov, D. K.; Newfield, D.; Thirumalai, D. Proc. Natl. Acad. Sci. USA 2002, 99, 8019-8024.
- 14 Takagi, F.; Koga, N.; Takada, S. Proc. Natl. Acad. Sci. USA 2003, 100, 11367-11372.
- 15 Jewett, A. I.; Baumketner, A.; Shea, J. E. Proc. Natl. Acad. Sci. USA 2004, 101, 13192-13197.
- 16 Eggers, D. K.; Valentine, J. S. J. Mol. Biol. 2001, 314, 911-922.
- 17 Ravindra, R.; Zhao, S.; Gies, H.; Winter, R. J. Am. Chem. Soc. 2004, 126, 12224-12225.
- 18 Campanini, B.; Bologna, S.; Cannone, F.; Chirico, G.; Mozzarelli, A.; Bettati, S. Prot. Sci. 2005, 14, 1125-1133.
- 19 Bolis, D.; Politou, A. S.; Kelly, G.; Pastore, A.; Temussi, P. A. J. Mol. Biol. 2004, 336, 203-212.
- 20 Cheung, M. S.; Thirumalai, D. J. Mol. Biol. 2006, 357, 632-643.
- 21 Raviv, U.; Klein, J. Science 2002, 297, 1540-1543.
- 22 Metropolis, N.; Rosenbluth, A. W.; Rosenbluth, M. N.; Teller, A. H.; Teller, E. J. Chem. Phys. 1953, 21, 1087-1092.
- 23 Jorgensen, W. L.; Chandrasekhar, J.; Madura, J. D.; Impey, R. W.; Klein, M. L. J. Chem. Phys. 1983, 79, 926-935.
- 24 Kalra, A.; Hummer, G.; Garde, S. J. Phys. Chem. B 2004, 108, 544-549.
- 25 Wallqvist, A.; Covell, D. G.; Thirumalai, D. J. Am. Chem. Soc. 1998, 120, 427-428.
- 26 Kumar, S.; Bouzida, D.; Swendsen, R.; Kollman, P.; Rosenberg, J. J. Comp. Chem. 1992, 13, 1011-1021.
- 27 Crouzy, S.; Smith, J. C.; Baudry, J.; Roux, B. J. Comp. Chem. 1999, 20, 1644-1658.
- 28 Roux, B. Comp. Phys. Comm. 1995, 91, 275-282.
- 29 Bennett, C. H. J. Comput. Phys. 1976, 22, 245-268.
- 30 Hummer, G.; Rasaiah, J. C.; Noworyta, J. P. Nature 2001, 414, 188-190.
- 31 Vaitheeswaran, S.; Rasaiah, J. C.; Hummer, G. J. Chem. Phys. 2004, 121, 7955-7965.
- 32 Pratt, L. R.; Pohorille, A. Chem. Rev. 2002, 102, 2671-2692.
- 33 Lee, C. Y.; McCammon, J. A.; Rossky, P. J. J. Chem. Phys. 1984, 80, 4448-4455.
- 34 Matubayasi, N.; Levy, R. M. J. Phys. Chem. 1996, 100, 2681-2688.
- 35 Henin, J.; Chipot, C. J. Chem. Phys. 2004, 121, 2904-2914.
- 36 Ashbaugh, H. S.; Pethica, B. A. Langmuir 2003, 19, 7638-7645.
- 37 Wallqvist, A.; Levy, R. M. J. Phys. Chem. B 2001, 105, 6745-6753.
- 38 Stuart, S. J.; Berne, B. J. J. Phys. Chem. A 1999, 103, 10300-10307.
- 39 Lynden-Bell, R. M.; Rasaiah, J. C. J. Chem. Phys. 1997, 107, 1981.
- 40 Marrink, S.; Marcelja, S. Langmuir 2001, 17, 7929-7934.
- 41 Jungwirth, P.; Tobias, D. J. J. Phys. Chem. B 2002, 106, 6361-6373.
- 42 O’Brien, E.; Stan, G.; Brooks, B. R.; Thirumalai, D. Unpublished.
- 43 Sorin, E. J.; Pande, V. S. J. Am. Chem. Soc. 2006, 128, 6316-6317.
| [kJ/mol] | [nm] | |
|---|---|---|
| methane-methane | 1.23 () | 0.373 () |
| oxygen-oxygen | 0.64 () | 0.315 () |
| methane-oxygen | 0.887 () | 0.344 () |
| [nm] | |||
|---|---|---|---|
| 1.0 | 6 | 12 | 17 |
| 1.5 | 48 | - | - |
| 2.0 | 128 | 134 | 140 |
| 3.0 | 460 | 466 | 472 |
| 4.0 | 1107 | 1112 | 1118 |
7 Figure Captions
Fig. 1: Density profiles of water in droplets of different sizes. There is depletion of water close to the surface of the sphere. is the droplet diameter in nm and is the number of solute molecules.
Fig. 2: Probability distributions , of binding energies of water molecules. (a) The water molecules in the whole droplet are considered. (b) same as (a) except the distributions are computed using water molecules that are in the surface layer (oxygen atoms within 0.2 nm of droplet surface). Comparison of (a) and (b) shows that water molecules at the surface are loosely bound.
Fig. 3: (a) Free energy of a single methane molecule as a function of its distance from the droplet center. The clear preference for the surface is evident at all values of . (b) Temperature dependence of the free energy of a single methane molecule as a function of its distance from the center of a droplet of diameter 3 nm. The zero of the free energy scale for every droplet is at its surface, and only differences within each curve are relevant.
Fig. 4: Potentials of mean force between two methane molecules in droplets of different sizes. Just as in the bulk, there is a distinct primary minimum. However, the characteristic solvent separated minimum is absent even at nm. The curves are shifted vertically so that the zero of the free energy scale is at contact for the two methanes. Only differences within each curve are relevant.
Fig. 5: Free energies profiles for ions of charge magnitude 0.4 in droplets of diameter nm. Corresponding profiles for methane are included for comparison. At all values of there is an asymmetry, as in bulk water, between positive and negative charges. For the preference for surface localization depends dramatically on the value of (compare (a), (b), (c) with results in (d)). Each curve is referenced to the surface of its respective droplet as in Fig. 3.
Fig. 6: Free energies profiles for ions Mq+, Mq-, M*q+ and M*q- of charge magnitude . The starred ions have twice the volume and therefore half the charge density of the corresponding unstarred ion. Curves for Mq+, Mq- and M*q+ are referenced to the origin (droplet center) while that for M*q- is referenced to the minimum at 1.3 nm for clarity. As in Figs. 3 and 5, only differences within each curve are relevant.
Fig. 7: Potentials of mean force between Mq+ and Mq-. (a) The magnitude of the charge . The symbols correspond to different values of . (b) Same as (a) except . In this case, due to the tendency of the charges to be fully solvated the PMF has bulk characteristics even at nm. Curves are shifted vertically as in Fig. 4.
Fig. 8: Potentials of mean force between M*q+ and M*q- () in the nm droplet (in black). The corresponding curve for Mq+ and Mq- is shown in red for comparison. Curves are shifted vertically as in Figs. 4 and 7.
![[Uncaptioned image]](/html/physics/0609103/assets/x12.png)