Present address: ]Department of Physics, Yale University, New Haven, Connecticut 06520-8120, USA
Limit on the Temporal Variation of the Fine-Structure Constant
Using Atomic Dysprosium
Abstract
Over a period of eight months, we have monitored transition frequencies between nearly degenerate, opposite-parity levels in two isotopes of atomic dysprosium (Dy). These transition frequencies are highly sensitive to temporal variation of the fine-structure constant () due to relativistic corrections of large and opposite sign for the opposite-parity levels. In this unique system, in contrast to atomic-clock comparisons, the difference of the electronic energies of the opposite-parity levels can be monitored directly utilizing a radio-frequency (rf) electric-dipole transition between them. Our measurements show that the frequency variation of the 3.1-MHz transition in 163Dy and the 235-MHz transition in 162Dy are 9.06.7 Hz/yr and -0.66.5 Hz/yr, respectively. These results provide a value for the rate of fractional variation of of yr-1 (1 ) without any assumptions on the constancy of other fundamental constants, indicating absence of significant variation at the present level of sensitivity.
pacs:
06.20.Jr, 32.30.BvModern theories attempting to unify gravitation with the other fundamental interactions have renewed interest in experimental searches for temporal and spatial variation of fundamental constants. These theories allow for, or even predict, such variation, which would violate Einstein’s Equivalence Principle Uzan (2003). Recently, evidence for variation of over cosmological time scales was discovered in absorption spectra of light from quasars Webb et al. (2001); Murphy et al. (2003). The result in Ref. Murphy et al. (2003) corresponds to /yr assuming a linear shift over years. However, more recent measurements present sensitive results that are consistent with no variation Quast et al. (2004); Srianand et al. (2004). On a geological time scale of years, a test for variation of comes from analyses of fission products of a natural reactor in Oklo (Gabon). There is a discrepancy between earlier analyses Damour and Dyson (1996); Fujii et al. (2000), which are consistent with no variation, and the analysis in Ref. Lamoreaux and Torgerson (2004), where a variation was reported. However, a recent full Monte Carlo simulation of the reactor Gould et al. (2006) reports a result consistent with no variation at the level of /yr.
Observational measurements are difficult to interpret due to numerous assumptions and uncontrollable systematic uncertainties. Laboratory searches (see, for example, Refs. Bize et al. (2003); Marion et al. (2003); Fischer et al. (2004); Peik et al. (2004)), which probe variations on the time scale of years, are easier to interpret since they are repeatable, and systematic uncertainties can be studied by changing experimental conditions. The best laboratory limit of /yr was obtained from a comparison of a Hg+ optical clock to a Cs frequency standard Bize et al. (2003). This result assumes that other constants, in particular , do not vary in time not (a). Interestingly, evidence for variation of this parameter on astronomical time scale was recently reported in Ref. Reinhold et al. (2006). The best limit that is independent of assumptions regarding other constants was obtained by combining this result with a comparison of Yb+ optical clock and a Cs frequency standard Peik et al. (2004). This measurement gives /yr.
In this Letter, we report a limit on the temporal variation of that is independent of other constants. This result is based on observing, over a period of eight months, rf-transitions between nearly degenerate, opposite-parity levels in atomic dysprosium, as suggested in Ref. Dzuba et al. (1999a).
The energy of an atomic level can be expressed as
| (1) |
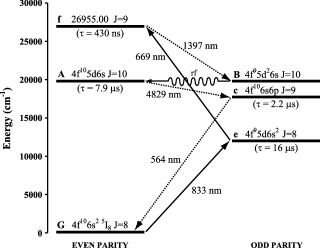
where is the present-day energy, is the present-day value of the fine-structure constant, and is a level dependent coefficient that determines the sensitivity to variations in Dzuba et al. (2003). A theoretical calculation has found that the -coefficients for the two nearly degenerate, opposite-parity levels in Dy (Fig. 1, levels and ) are large and of opposite sign Dzuba et al. (2003). For the even-parity level (level ), cm-1, while for the odd-parity level (level ), cm-1. Since explicit uncertainties are not quoted for these numbers, they are assumed to be exact in the determination of the result not (b).
Another parametrization of frequency and sensitivity factor is often used for atomic-clock comparisons, in which an electronic transition frequency is expressed as
| (2) |
where is the Rydberg constant expressed in units of frequency, is a dimensionless atomic structure factor independent of , and is a factor that includes all relativistic as well as many-body effects which depend on Prestage et al. (1995). The change in a transition frequency can be related to a fractional change in as
| (3) |
The expression is the sensitivity of a transition to variation in . Using this parametrization, the q-coefficients for atomic Dy can be recast (for ) to give , where is the energy of level or with respect to the ground state. This gives a sensitivity of 0.6 and for level and , respectively. These values are comparable, for example, to the sensitivity of -3.2 for the transition used in the Hg+ optical clock Dzuba et al. (1999b).
In atomic-clock comparisons, the observable quantity is the ratio of the two frequencies being compared. A unique aspect of the Dy system is that the direct observable quantity is the difference , due to the fact that an electric-dipole transition can be induced between the two levels using a rf electric field. The time variation of the transition frequency between levels and is
| (4) |
For instance, /yr implies Hz/yr.
There are several advantages to using the nearly degenerate levels in Dy. Because most of the transition frequencies are 1 GHz or smaller, direct frequency counting techniques can be used. This allows for the comparison of two electronic transitions without the need for optical frequency combs or transfer cavities. A preliminary analysis of statistical and systematic uncertainties shows that the measurement of the transition frequency and the control of the systematics at a mHz level is feasible, which corresponds to an ultimate sensitivity of /yr for two measurements separated by a year’s time Nguyen et al. (2004). A mHz resolution on a transition frequency of 1 GHz requires a relatively modest fractional stability of for the reference frequency standard. This also means that the results are insensitive to variation of the Cs reference frequency due to changes in the values of fundamental constants since the experimental upper limit on this relative variation rate is yr-1 (see, for example, Marion et al. (2003)). In addition, because the isotope shifts and hyperfine splittings are on the order of the transition frequencies, it is possible to work with multiple rf transitions corresponding to the same electronic transition, including, in particular, transitions with energy differences of opposite sign. Since the variation in only depends upon electronic energy levels not (c), the variation of these rf transitions should have equal magnitude but opposite sign. This correlation can be used to detect and eliminate certain systematics. Currently, we monitor two such transitions: the 3.1-MHz () transition in 163Dy and the 235-MHz () transition in 162Dy.
The population and detection scheme is shown in Fig. 1. The long-lived ( s Budker et al. (1994)) level is populated by three transitions. The first two transitions are driven with 833- and 669-nm laser light, while the third transition involves spontaneous decay. Atoms are transferred to level with rf electric field referenced to a Cs frequency standard. Level decays to the ground state in two steps. Fluorescent light at 564 nm from the second decay is used for detection.
The atomic beam is described in Ref. Nguyen et al. (1997). It is produced by an effusive oven operating at 1500 K. In addition to a multislit nozzle-array attached to the oven, two external collimators are used to collimate both the atomic beam and the oven light (in order to minimize the background due to scattered light from the oven). The resultant atomic beam has a mean velocity of 500 m/s and a full-angle divergence of 0.2 rad (1/-level).
The laser light at 833 and 669 nm is produced by a Ti:Sapphire ring laser and a ring dye laser with DCM dye, respectively. Since narrow-band continuous-wave lasers are inefficient at exciting atomic beams with weak collimation, an adiabatic passage technique is utilized to transfer the population to level (a description of this technique, as well as references to earlier work, are given in Ref. Nguyen et al. (2000)). Briefly, the beams are diverged with cylindrical lenses to match the atomic-beam divergence. Due to the Doppler effect, the atoms experience a frequency chirp in laser detuning which transfers the population to the excited state with high efficiency. The laser-light and rf-interaction region is enclosed by a magnetic shield. The residual field in the interaction region is 1 mG.
The rf-generation and detection system is discussed in Ref. Cingöz et al. (2005). The frequency modulated rf field is generated by a synthesizer referenced to a commercial Cs frequency standard which is compared to a second clock (Rb oscillator locked to a digital cellular network signal) to monitor its stability. The short term fractional stability of the clocks is , and it approaches in 10 minutes of integration. The modulation frequency is 10 kHz with a modulation index of 1. Since the rf-transition linewidth is 20 kHz, this modulation provides a fast sweep across the line shape, minimizing the effect of fluctuations such as those due to laser power drifts or density fluctuations of the atomic beam. The modulation is provided by the reference output of a lock-in amplifier which demodulates the signal from a photomultiplier tube used to detect the fluorescence. The line shape of the first- and second-harmonic outputs of the lock-in amplifier is, respectively, an odd function with zero crossing on resonance and an even function with a maximum on resonance. In order to reduce drifts further, the ratio of these two is used to measure the transition frequency, which is extracted by a two-step process described in detail in Ref. Cingöz et al. (2005).
There are several imperfections that affect the stability of our transition-frequency measurements. The largest effect is due to the combination of the residual magnetic field with the laser-light polarization imperfections. During normal operation, the polarizations of both laser beams are set to linear, which should lead to symmetrically populated magnetic sublevels. However, residual light ellipticity leads to atomic orientation, which, in the presence of the residual magnetic field, leads to asymmetric broadening of the line and causes apparent shifts Nguyen et al. (2004). In systematic studies where we deliberately used circularly polarized light, shifts in the transition frequencies as large as 160 Hz were observed. The linear polarizations of the laser beams are determined by calcite polarizers with extinction ratio outside the vacuum chamber. However, the beams must travel through optical windows and lenses utilized for adiabatic passage population technique (see above) before reaching the interaction region. A small amount of stress-induced birefringence on these lenses was discovered by deliberate misalignment of the laser beams. The amount of ellipticity depended upon where the beam sampled a lens. The residual systematic uncertainties due to this effect range from 2 to 5 Hz on different experimental runs with the smaller uncertainty corresponding to later runs in which the lens mounts were modified to relieve the stress.
In addition to the residual magnetic field, the magnetic shielding was inadvertently magnetized in the April 2006 runs during studies utilizing external magnetic-field coils. Since the amount of magnetization and the resultant shifts in the transition frequencies were unknown at the time, systematic uncertainties have been assigned by driving the magnetization to saturation and noting the maximum shift induced for both field polarities. The uncertainty due to this effect is 7.5 Hz. The shields were demagnetized at the beginning of each subsequent run.
Another important systematic uncertainty is due to the collisions of Dy atoms with the background gas in the vacuum chamber. Collisional shift rates for the rf transitions due to various gases were determined in Ref. Cingöz et al. (2005). The pressure in the vacuum chamber is Torr when the Dy oven is off. When the oven is turned on, the pressure rises to Torr, limited by H2 outgassing from the oven. In Ref. Cingöz et al. (2005), the observed shift rates for H2 were found to be consistent with zero. However, the pressure of other gases, such as N2, also increases at the level of Torr when the oven is turned on, and continually decreases and stabilizes after hours of continuous oven operation. The partial pressures are monitored with a residual gas analyzer (RGA), and the transition frequencies are corrected for the presence of N2, O2, H2, and Ar using the shift rates measured for each gas. The variation in the pressure of other gases such as H2O and CO2 are Torr or smaller, and no significant correlation between these pressure variations and the transition frequency is observed. The total correction is Hz at any time during each run. The results also include small uncertainties ( Hz) due to oven temperature variations, which may indicate a possible effect of Dy intra-beam collisions Cingöz et al. (2005).
Finally, there are systematic effects associated with rf electric-field inhomogeneities. The rf electrodes are fed by twisted-pair wires at one corner. Numerical simulations show that with this feed, at rf wavelengths comparable to the size of the electrodes ( cm), spatially varying amplitude and phase inhomogeneities become substantial. These inhomogeneities can lead to drifts in the transition frequency when they are combined with changes in the atomic beam velocity distribution. This effect was studied experimentally by deliberate detuning of the laser frequencies from the optical resonances. This leads to changes in the transverse velocity distribution of the excited atoms due to imperfect adiabatic passage. For the two transitions considered in this study, shifts of Hz for 1 MHz detuning in the laser frequencies were observed. To keep this effect at the 1 Hz level during the runs, the laser frequencies were periodically retuned ( every 2 minutes) to the center of their respective transitions. To check for slow variations in the beam velocity distribution due to other changes such as collimator clogging, this study was repeated several times over a two-year period, during which the oven was reloaded and collimators cleaned several times. No significant change in the size or dependence of the effect was observed.
All other systematics considered in Ref. Nguyen et al. (2004) were estimated to be smaller than 1 Hz for the specific conditions of the current experiment. Many of these systematics, such as AC Stark shifts and oven black-body radiation shifts, were studied experimentally by exaggerating certain imperfections and were found to be negligible.
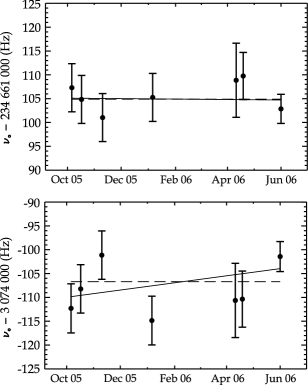
We have measured the two rf transition frequencies in the course of seven runs over eight months. Figure 2 shows the results of these measurements corrected for collisional shifts. Uncertainties are due both to statistical and aforementioned systematic uncertainties. Least-squares linear fit to the data points gives slopes of Hz/yr and Hz/yr for the 235-MHz and 3.1-MHz transitions, respectively. According to Eq. (4), these results correspond to yr-1 for the 235-MHz transition and yr-1 for the 3.1-MHz transition. As mentioned earlier, because the energy differences for these two transitions are of opposite sign, these two data sets can be combined to construct sum and difference frequency plots. The sum frequency slope, which should be insensitive to a variation in , is Hz/yr and consistent with zero. The difference frequency, which is twice as sensitive to a variation in as the individual frequencies, gives the final result of yr-1, consistent (1 ) with no variation at the present level of sensitivity.
In conclusion, we have presented the first result of a direct measurement of the temporal variation of with atomic dysprosium. This result is of comparable uncertainty to the present best laboratory result that is independent of other fundamental constants. However, in our case the interpretation does not require comparison with different measurements to eliminate dependence on other constants, and provides an alternative to measurements that utilize state-of-the-art atomic optical frequency clocks. The present uncertainty is dominated by systematic effects primarily due to polarization imperfections coupled to the residual magnetic field, collisional shifts, and rf electric-field inhomogeneities. A significant improvement is expected from a new apparatus under construction which will provide better control over these, as well as other, systematic effects expected to be important to achieve better than 1-Hz sensitivity. Ultimately, mHz-level sensitivity may be achievable with this method Nguyen et al. (2004).
We thank V. V. Yashchuk, D. F. Jackson Kimball, and D. English for valuable discussions. This work was supported in part by the University of California - Los Alamos National Laboratory CLC program, NIST Precision Measurement Grant, Los Alamos National Laboratory LDRD, and by grant RFP1-06-15 from the Foundational Questions Institute (fqxi.org).
References
- Uzan (2003) J.-P. Uzan, Rev. Mod. Phys. 75, 403 (2003).
- Webb et al. (2001) J. K. Webb et al., Phys. Rev. Lett. 87, 091301 (2001).
- Murphy et al. (2003) M. T. Murphy et al., Mon. Not. R. Astron. Soc. 345, 609 (2003).
- Quast et al. (2004) R. Quast et al., Astron. Astrophys. 415, L7 (2004).
- Srianand et al. (2004) R. Srianand, H. Chand, P. Petitjean, and B. Aracil, Phys. Rev. Lett. 92, 121302 (2004).
- Damour and Dyson (1996) T. Damour and F. Dyson, Nucl. Phys. B480, 37 (1996).
- Fujii et al. (2000) Y. Fujii et al., Nucl. Phys. B573, 377 (2000).
- Lamoreaux and Torgerson (2004) S. K. Lamoreaux and J. R. Torgerson, Phys. Rev. D 69, 121701(R) (2004).
- Gould et al. (2006) C. R. Gould, E. I. Sharapov, and S. K. Lamoreaux, Phys. Rev. C 74, 024607 (2006).
- Bize et al. (2003) S. Bize et al., Phys. Rev. Lett. 90, 150802 (2003).
- Marion et al. (2003) H. Marion et al., Phys. Rev. Lett. 90, 150801 (2003).
- Fischer et al. (2004) M. Fischer et al., Phys. Rev. Lett. 92, 230802 (2004).
- Peik et al. (2004) E. Peik et al., Phys. Rev. Lett. 93, 170801 (2004).
- not (a) In fact, recent theories predict that the fractional variation in is times larger than the fractional variation in [X. Calmet and H. Fritzsch, Eur. Phys. J. C 24, 639 (2002)].
- Reinhold et al. (2006) E. Reinhold et al., Phys. Rev. Lett. 96, 151101 (2006).
- Dzuba et al. (1999a) V. A. Dzuba, V. V. Flambaum, and J. K. Webb, Phys. Rev. Lett. 82, 888 (1999a).
- Dzuba et al. (2003) V. A. Dzuba, V. V. Flambaum, and M. V. Marchenko, Phys. Rev. A 68, 022506 (2003).
-
not (b)
The uncertainty of these numbers is expected to be
% (private communication with V. V. Flambaum). - Prestage et al. (1995) J. D. Prestage, R. L. Tjoelker, and L. Maleki, Phys. Rev. Lett. 74, 3511 (1995).
- Dzuba et al. (1999b) V. A. Dzuba, V. V. Flambaum, and J. K. Webb, Phys. Rev. A 59, 230 (1999b).
- Nguyen et al. (2004) A. T. Nguyen, D. Budker, S. K. Lamoreaux, and J. R. Torgerson, Phys. Rev. A 69, 22105 (2004).
- not (c) There are differences due to the hyperfine interaction and isotope shifts, but these are several orders of magnitude smaller.
- Budker et al. (1994) D. Budker, D. DeMille, E. D. Commins, and M. S. Zolotorev, Phys. Rev. A 50, 132 (1994).
- Nguyen et al. (1997) A. T. Nguyen, D. Budker, D. DeMille, and M. Zolotorev, Phys. Rev. A 56, 3453 (1997).
- Nguyen et al. (2000) A. T. Nguyen, G. D. Chern, D. Budker, and M. Zolotorev, Phys. Rev. A 63, 013406 (2000).
- Cingöz et al. (2005) A. Cingöz, A.-T. Nguyen, D. Budker, S. K. Lamoreaux, A. Lapierre, and J. R. Torgerson, Phys. Rev. A 72, 063409 (2005).