Scaling behavior of an artificial traffic model on scale-free networks
Abstract
In this article, we investigate an artificial traffic model on scale-free networks. Instead of using the routing strategy of the shortest path, a generalized routing algorithm is introduced to improve the transportation throughput, which is measured by the value of the critical point disjoining the free-flow phase and the congested phase. By using the detrended fluctuation analysis, we found that the traffic rate fluctuation near the critical point exhibits the -type scaling in the power spectrum. The simulation results agree very well with the empirical data, thus the present model may contribute to the understanding of the underlying mechanism of network traffics.
pacs:
89.75.Hc, 89.20Hh, 05.10.-a, 89.40.-aI Introduction
Complex networks can be used to describe a wide range of systems from nature to society, thus there has been a quickly growing interest in this area since the discoveries on small-world phenomena Watts and scale-free properties Barabasi . Due to the increasing importance of large communication networks upon which our society survives, the dynamical processes taking place upon the underlying structures such as traffics of information flow have draw more and more attentions from the physical and engineering communities. Previous studies on understanding and controlling traffic congestion on network have a basic assumption that the network has a homogeneous structure Li ; Leland ; Taqqu ; Crovella . However, many real communication networks, including the Internet Pastor and WWW Albert1999 , display the scale-free property. Therefore it is of great interest to explore how this highly heterogenous topology affects the traffic dynamics, which have brought a number of research works in recent years (see the review paper Tadic2006 and the references therein).
To improve the transportation efficiency on complex networks, Guimerá et al. presented a formalism that can deal simultaneously with the searching and traffic dynamics in parallel transportation systems Guimera . This formalism can be used to optimize network structure under a local search algorithm through the knowledge of the global information of whole network. By using a global and dynamical searching algorithm aimed at the shortest paths, Zhao et al. provided the theoretical estimates of the communication capacity Zhao2005 . Holme proposed a much intelligent routing protocol in which the packet can detour at obstacle thus guarantee much better performance than the traditional routing strategy which just waits at obstacle Holme2003 . Since the global information is usually unavailable in large-scale networks, Tadić et al. proposed a traffic model on a mimic WWW network Tadic2001 wherein only local information, is available. This work highlighted the relationship of global statistical properties and microscopic density fluctuations Tadic2002 ; Tadic2004 . In addition, Yin et al. Yin2006 ; Wang2006 investigated how the local routing protocol affects the traffic condition. The routing strategies for the Internet Echenique and disordered networks Braunstein are also studied.
Recent empirical studies on communication networks have found pervasive evidence of some surprising scaling properties. One example of such discoveries is that the traffic rates of a given link in the Internet (i.e. the number of packets or bytes traversing a given link per time unit) exhibit the self-similar (or fractal-like) scaling, and the multifractal scaling is also found over small time scales Crovella ; Leland1994 ; Paxson1997 ; Feldmann ; Yang2006 . These empirical studies describe pertinent statistical characteristics of temporal dynamics of measured traffic rate process and provide ample evidence that these traces are consistent with long-range correlated behavior. Faloutsos et al. concerned the autonomous system (AS) of the Internet and pointed out for the first time that the degree distribution of snapshots in the AS level follows a heavy-tailed function that can be reasonably approximated by power-law forms Faloutsos . Following these pioneering works, Percacci et al. found that the round trip time (RTT) or Internet delay time can also be characterized by a slow power-law decay Percacci . This finding implies that network inter-connectivity topology structure of Internet and transportation delay both have a highly heterogenous characteristic. Thus, the assumption of Poisson process, which had been a major traffic model with homogeneous network in the traditional traffic theory, has clearly lost its validity. This is also the very reason why in this article we use scale-free networks for simulations. Furthermore, the observation of a phase transition between the free-flow phase and the congested phase in the Internet traffic is demonstrated by Takayasu et al. through both the RTT experiment Takayasu1996 ; Fukuda1999 and packet flow fluctuation analysis Takayasu1999 ; Takayasu2000 . However, the -type scaling is only detected near the critical state Takayasu1996 ; Fukuda1999 ; Takayasu1999 ; Takayasu2000 .
In this article, we investigate a traffic model on scale-free networks, in which packets are routed according to the global topological information with a single tunable parameter . Instead of using the routing strategy based on the shortest paths, we give a generalized routing algorithm to find the so-called efficient path to improve the transportation efficiency that is measured by the value of the critical point disjoining the free-flow and the congested phases. Furthermore, by using the detrended fluctuation analysis, we investigate the statistic properties of traffic rate process (i.e. depicted by the number of packets per time unit) based on this traffic model, which is in good accordance with the empirical data.
II Model
In this paper, we treat all the nodes as both hosts and routers Guimera ; Zhou2006 . The model is described as follows: at each time step, there are packets generated in the system, with randomly chosen sources and destinations. It is assumed that all the routers have the same capabilities in delivering and handling information packets, that is, at each time step all the nodes can deliver at most packets one step toward their destinations according to the routing strategy. We set for simplicity. A packet, once reaching its destination, is removed from the system. We are most interested in the critical value where a phase transition takes place from free flow to congested traffic. This critical value can best reflect the maximum capability of a system handling its traffic. In particular, for , the numbers of created and delivered packets are balanced, leading to a steady free traffic flow. For , traffic congestion occurs as the number of accumulated packets increases with time, simply for that the capacities of nodes for delivering packets are limited. To characterize the phase transition, we use the following order parameter
| (1) |
where , with indicating average over time windows of width , and is the total number of packets in the network at time . Clearly, equals zero in the free-flow state, and becomes positive when exceeds .

Consider the routing under global protocol Yan2006 , where the whole structural information is available, and the fixed routing algorithm is the most widely used one for its obvious advantages in economical and technical costs Tanenbaum ; Huitema . Actually, the path with shortest length is not necessarily the quickest way, considering the presence of possible traffic congestion and waiting time along the shortest path. Obviously, nodes with larger degree are more likely to bear traffic congestion, thus a packet will by average spend more waiting time to pass through a high-degree node. All too often, bypassing those high-degree nodes, a packet may reach its destination quicker than taking the shortest path. In order to find the optimal routing strategy, we define the efficient path Yan2006 . For any path between nodes and as , denote
| (2) |
where denotes the degree of the node , and is a tunable parameter. The efficient path between and is corresponding to the route that makes the sum minimum. Obviously, recovers the traditionally shortest path length. As for any pair of source and destination, there may be several efficient paths between them. We randomly choose one of them and put it into the fixed routing table which is followed by all the information packets.
III Simulation and analysis
Some simulation and analytic results are presented in this section. Without particular statement, all the simulations are based on the Barabási-Albert (BA) networks Barabasi with average degree .
III.1 Phase transition
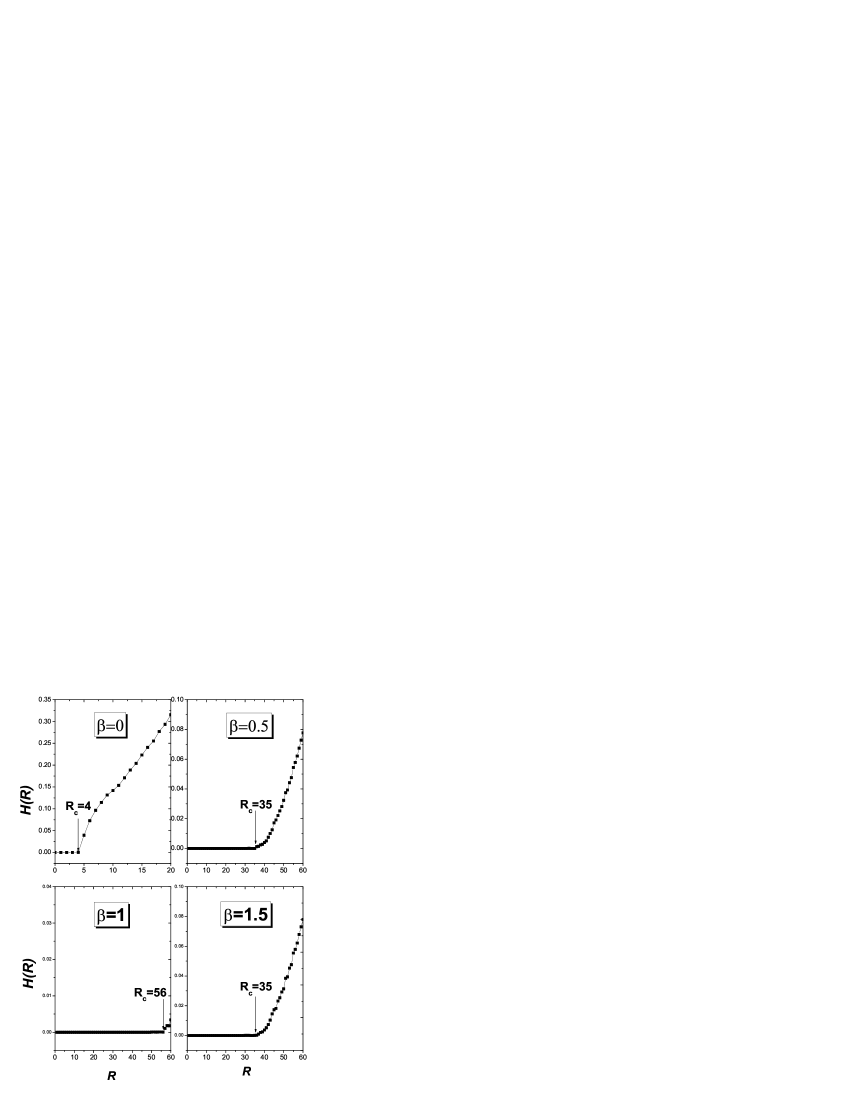
The packets handling and delivering capacity of the whole network is an index of performance in traffic system, which can be measured by the critical value . At the critical value , a continuous transition will be observation from the free-flow phase to the congested phase. Fig. 1 shows the order parameter versus with different , in which the obvious phase transitions occur. For different , it is easy to find that the capacities of systems are much different.
III.2 Optimal routing strategy
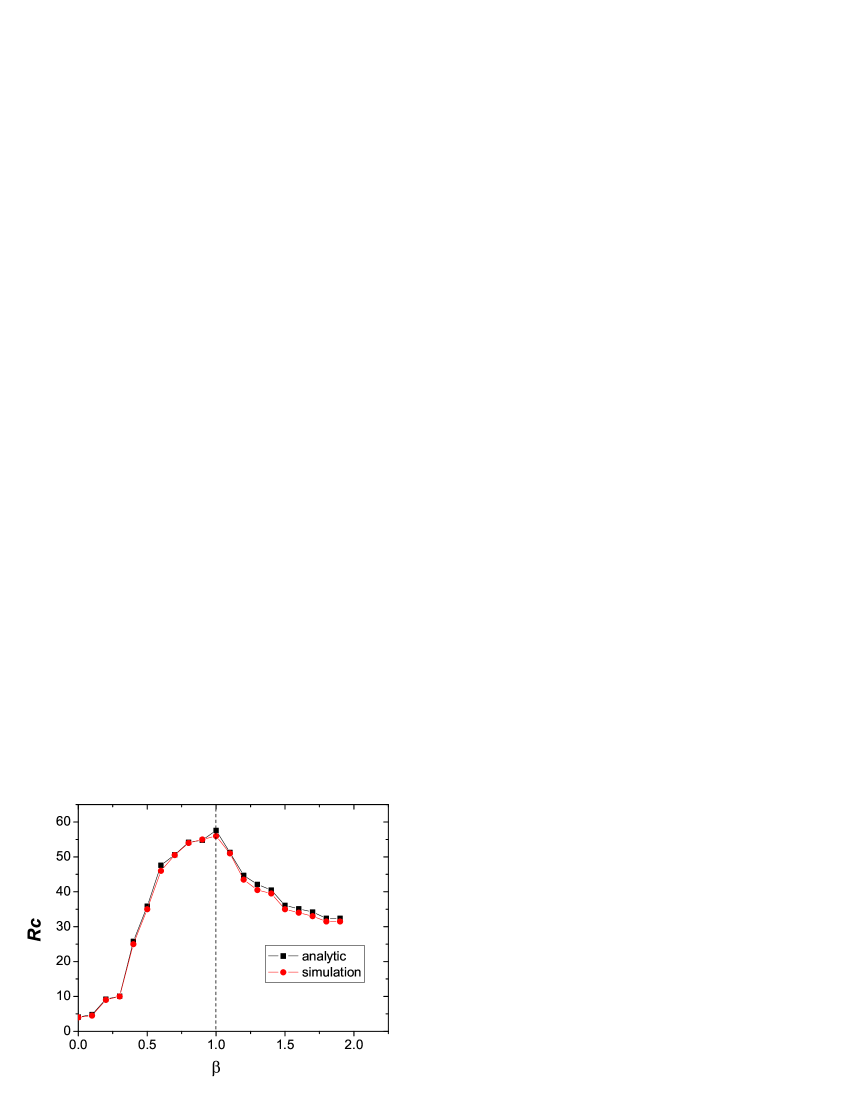
We select packet routing strategy through a tunable parameter , and the capacity of whole network are much different. A natural question arises: Which value of will lead to the maximal capacity of the network. In Fig. 2, we report the simulation results for the critical value as a function of on BA networks with the size and , which demonstrate that the optimal routing strategy is corresponding to and the size of BA network doesn’t affect the optimal value. In comparison with the traditional routing strategy (i.e. ), the capacity of the whole network is greatly improved more than 10 times without any increase in algorithmic complexity.

By extending the concept of betweenness centrality Newman2001 ; Note to efficient betweenness centrality ex , the analytic results can be obtained according to the Little’s law (One can find the concept of efficient betweenness and the details about the analytical approach in Refs. Guimera ; Zhao2005 ; Yan2006 ). The analytical results are also shown in Fig. 2, which agree very well with the simulations.
IV Detrended fluctuation analysis on the scaling behavior of the traffic rate process
IV.1 The critical phenomena of the traffic rate process
The empirical studies on communication networks confirm the existence of critical phenomena in traffic rate process Takayasu1999 ; Takayasu2000 . The Congestion duration length distribution obeys a power-law form with an approximate exponent -1 in critical state, which implies the self-similarity scaling exponent (Hurst exponent) . Actually, stands for an anti-persistent long-range correlated process in which a step in one direction is preferentially followed by a reversal of direction, while is interpreted as a persistent long-range correlated process in which a step in one direction is preferentially followed by another step in the same direction. A value of is interpreted as the ordinary diffusion (random walk), in which each step is independent of its preceding one.
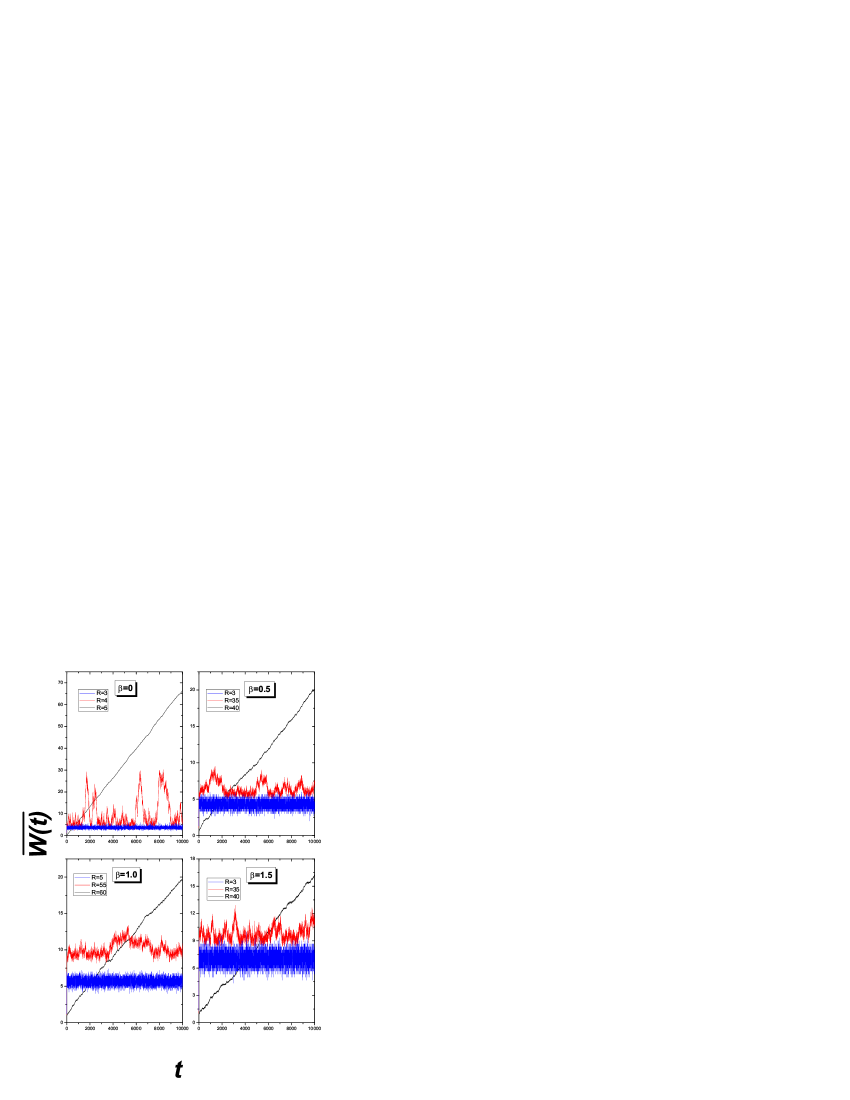
In Fig. 3, we report the average number of packets over all the nodes, , as a time series in free, critical and congested states, respectively. As time goes on, in the congested state will become too large to be plotted together with those in free and critical state. Therefore, each curve representing the congested state in Fig. 3 is anteriorly divided by a very large number. Those numbers are not the same for different simulations, and do not have any physical meanings, they are just used to make the figure more clear. The behaviors of in the free and congested states are very simple: In the former case, it fluctuates slightly around a very low value, while in the latter case, it increases linearly. However, the time series at the critical point is very complicated, we next detect its scaling property by using the detrended fluctuation analysis.
IV.2 Detrended fluctuation analysis
The empirical study on the self-similar scaling behavior of traffic rate process can be firstly found in pioneer references Leland1993 ; Erramilli . The autocorrelation function and power spectrum are widely used to analyse the the self-similar scaling behavior of data Park ; Holt ; Yao ; Karagiannis . However, it is shown that all the above methods don’t work very well for the effect of non-stationary, and are less accurate than the detrended fluctuation analysis (DFA) Peng1994 ; Peng1995 ; Liu1999 , which has now been accepted as an important time series analysis approach and widely used especially for financial and biological data DFA1 ; DFA2 ; DFA3 ; DFA4 ; DFA5 .
The DFA method is based on the idea that a correlated time series can be mapped to a self-similar process by an integration. Therefore, measuring the self-similar feature can indirectly tell us the information about the correlation properties Peng1994 ; Peng1995 . Briefly, the description of the DFA algorithm involves the following steps.
(1) Consider a time series , where is the length of this series. Determine the profile
| (3) |
where
| (4) |
(2) Divide profile into non-overlapping boxes of equal size .
(3) Calculate the local trend in each box of size by a least-square fit of the series, and the detrended fluctuation function is given as
| (5) |
(4) For a given box size , we calculate the root-mean-square fluctuation
| (6) |
and repeat the above computation for different box sizes (i.e. different scales) to provide a relationship between and . If the curve in a log-log plot displays a straight line, then obeys the power-law form with the slope of this line.
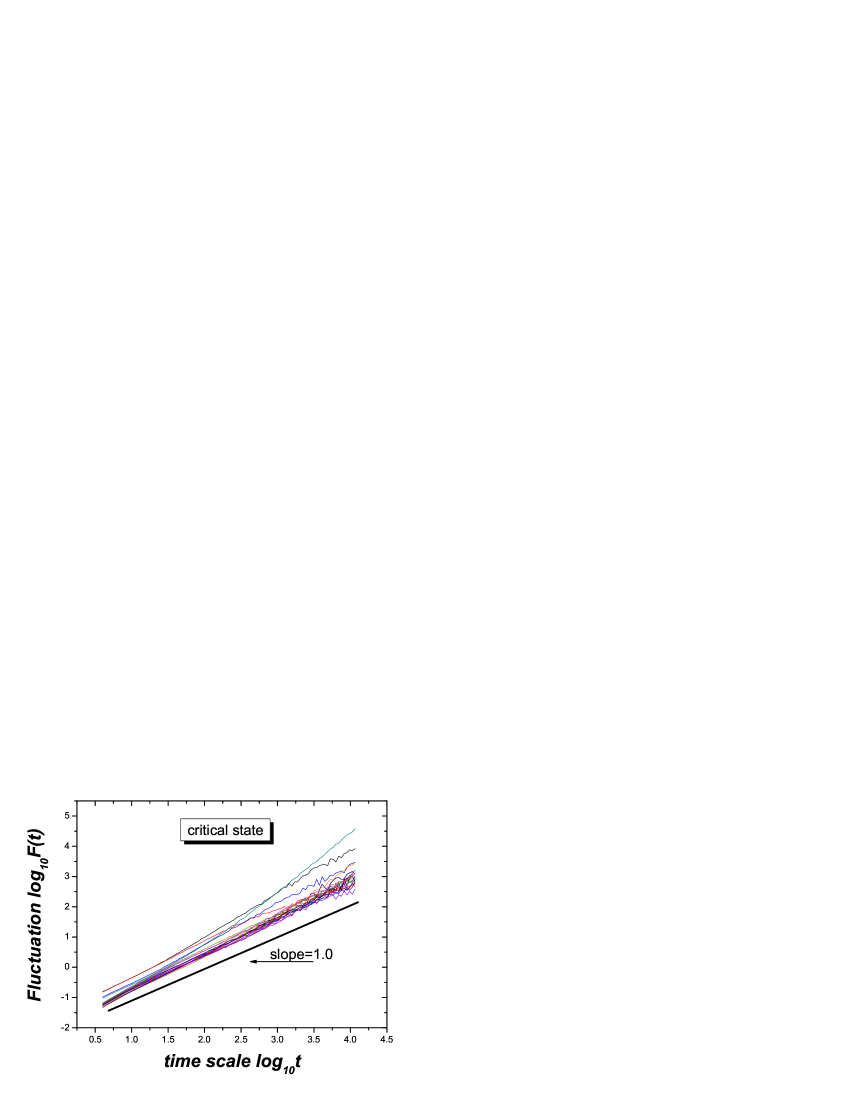
As shown in Fig. 4, the mimic traffic rate process also exhibits the self-similar scaling behaviors at the critical point of phase transition. The scaling exponents calculated with DFA for different are approximate , and the value of has almost no effect on . This value of implies the -type scaling in the power spectrum and the long-range correlated behavior in a wide range of scales. A very recent empirical study on the traffic rate process of a University Ethernet has demonstrated that the real Ethernet traffic displays a self-similarity behavior with scaling exponent ZhouPL2006 , which agrees well with the present result .
In order to confirm that the critical behavior only exists in the critical state (as is shown in some previuos empirical studies) Takayasu1996 ; Fukuda1999 ; Takayasu1999 ; Takayasu2000 , we analysis the traffic rate processes in the free-flow state. Fig. 5 suggests that traffic rate processes in free state are completely different from those in the critical state, which exhibit a very weak long-range correlated behavior with exponent . Clearly, if the transporting time of each packet is exactly the same as the path length (i.e. a packet does not need to wait at any nodes in the path from its source to destination), there should be no long-range correlation and the Hurst exponent will be . In the present model, even in the free-flow state, a packet may wait some time steps at some nodes before reaching to its destination. That is the reason leading to the weak long-range correlation. However, the waiting effect in the free-flow state is trifling for the Hurst exponent is close to 0.5.
V conclusion
In conclusion, we have proposed a traffic model based on packet routing strategy aiming at efficient paths instead of the shortest paths. This work may be useful for designing communication protocols for highly heterogeneous networks since the present strategy can sharply enhance the throughput without any increase in its algorithmic complexity. The traffic rate process generated by this model exhibits critical self-similar scaling behavior with exponent , which implies the -type scaling in the power spectrum and the long-range correlated behavior in a wide range of scales. The scaling behaviors of the present model is in good accordance with the empirical data, thus this model may have got hold of some key ingredients of the underlying mechanism of real traffic.
Acknowledgements.
This work was partially supported by the National Natural Science Foundation of China under Grant Nos. 70471033, 10472116, 10532060, 70571074 and 10547004, the Special Research Founds for Theoretical Physics Frontier Problems under Grant No. A0524701, and the Specialized Program under the Presidential Funds of the Chinese Academy of Science.References
- (1) D. J. Watts and S. H. Strogatz, Nature (London) 393, 440 (1998).
- (2) A.-L. Barabási and R. Albert, Science 286, 509 (1999).
- (3) H. Li and M. Maresca, IEEE Trans. Comput. 38, 1345 (1989).
- (4) W. E. Leland, M. S. Taqqu, W. Willinger, and D. V. Wilson, Comput. Commun. Rev. 23, 283 (1993).
- (5) M. S. Taqqu, W. Willinger, and R. Sherman, Comput. Commun. Rev. 27, 5 (1997).
- (6) M. E. Crovella and A. Bestavros, IEEE/ACM Trans. Netw. 5, 835 (1997).
- (7) R. Pastor-Satorras, A. Vázquez, and A. Vespignani, Phys. Rev. Lett. 87, 258701 (2001).
- (8) R. Albert, H. Jeong, and A.-L. Barabási, Nature (London) 401, 103 (1999).
- (9) B. Tadić, Int. J. Bifurca. & Chaos (to be published).
- (10) R. Guimerá, A. Díaz-Guilera, F. Vega-Redondo, A. Cabrales, and A. Arenas, Phys. Rev. Lett. 89, 248701 (2002).
- (11) L. Zhao, Y.-C. Lai, K. Park, and N. Ye, Phys. Rev. E 71, 026125 (2005).
- (12) P. Holme, Adv. Complex Syst. 6, 163 (2003).
- (13) B. Tadić, Physica A 293, 273 (2001).
- (14) B. Tadić, and G. J. Rodgers, Adv. Complex Syst. 5, 445 (2002).
- (15) B. Tadić, S. Thurner, and G. J. Rodgers, Phys. Rev. E 69, 036102 (2004).
- (16) C.-Y. Yin, B.-H. Wang, W.-X. Wang, T. Zhou, and H.-J. Yang, Phys. Lett. A 351, 220 (2006).
- (17) W. -X. Wang, B. -H. Wang, C.-Y. Yin, Y. -B. Xie, and T. Zhou, Phys. Rev. E 73, 026111 (2006).
- (18) P. Echenique, J. Góez-Gardes, and Y. Moreno, Phys. Rev. E 70, 056105 (2004).
- (19) L. A. Braunstein, S. V. Buldyrev, R. Cohen, S. Havlin, and H. E. Stanley, Phys. Rev. Lett. 91, 168701 (2003).
- (20) W. E. Leland, M. S. Taqqu, W. Willinger, and D . V. Wilson, IEEE/ACM Trans. Netw. 2, 1 (1994).
- (21) V. Paxson and S. Floyd, IEEE/ACM Trans. Netw. 5, 226 (1997).
- (22) A. Feldmann, A. C. Gilbert, P. HUang, and W. Willinger, Comput. Commun. Rev. 29, 301 (1999).
- (23) C. -X. Yang, S. -M. Jiang, T. Zhou, B. -H. Wang, and P. -L. Zhou, 2006 International Conference on Communications, Circuits and Systems Proceedings, (IEEE Press, pp.1740-1743, 2006).
- (24) M. Faloutsos, P. Faloutsos, and C. Faloutsos, Comput. Commun. Rev. 29, 251 (1999).
- (25) R. Percacci and A. Vespignani, Eur. Phys. J. B 32, 411 (2003).
- (26) M. Takayasu, H. Takayasu, T. Sato, Physica A 233, 924 (1996).
- (27) K. Fukuda, H. Takayasu, M. Takayasu, Fractals 7, 23 (1999).
- (28) M. Takayasu, K. Fukuda, H. Takayasu, Physica A 274, 140 (1999).
- (29) M. Takayasu, H. Takayasu, K. Fukuda, Physica A 277, 248 (2000).
- (30) T. Zhou, G. Yan, B.-H. Wang, Z.-Q. Fu, B. Hu, C.-P. Zhu, and W.-X. Wang, Dyn. Contin. Discret. Impuls. Syst. Ser. B-Appl. Algorithm 13, 463 (2006).
- (31) G. Yan, T. Zhou, B. Hu, Z. -Q. Fu, and B. -H. Wang Wang, Phys. Rev. E 73, 046108 (2006)
- (32) A. S. Tanenbaum, Computer Networks (Prentice Hall, Engle-wood Cliffs, NJ, 1996).
- (33) C. Huitema, Routing in the Internet (Prentice Hall, Upper Saddle River, NJ, 2000).
- (34) M. E. J. Newman, Phys. Rev. E 64, 016132 (2001).
- (35) T. Zhou, J. -G. Liu, and B. -H. Wang, Chin. Phys. Lett. 23, 2327 (2006).
- (36) Using the efficient paths instead of the shortest paths in the definition of betweenness centrality.
- (37) W. E. Leland, M. S. Taqq, W. Willinger, and D. V. Wilson, Proc. ACM SIGCOMM, San Francisco, CA, USA, 23(4), 183 (1993).
- (38) A. Erramilli, O. Narayan, and W. Willinger, IEEE/ACM Trans Netw. 4, 209 (1996).
- (39) K. Park and W. Willinger, Self-Similar Network Traffic: An Overview, in Self-Similar Network Traffic and Performance Evaluation, (Wiley-Interscience, pp.1-39, 2000).
- (40) A. Holt, IEE Proc.-Commun. 147(6), 317 (2000).
- (41) L. Yao, M. Agapie, J. Ganbar and M. Doroslovacki, Communications, ICC ’03 IEEE International Conference, pp.1611 (2003).
- (42) T. Karagiannis, M. Molle and M. Faloutsos, IEEE Internet Computing 8(5), 57 (2004).
- (43) C. K. Peng, S. V. Buldyrev, S. Havlin, M. Simons, H. E. Stanley and A. L. Goldberger, Phys. Rev. E, 49, 1685 (1994).
- (44) C. K. Peng, S. Havlin, H. E. Stanley and A. L. Goldberger, Chaos 5, 82 (1995).
- (45) Y. H. Liu, P. Gopikrishnan, P. Cizeau, M. Meyer, C. K. Peng and H. E. Stanley, Phys. Rev. E, 49, 1390 (1999).
- (46) A. Bunde, S. Havlin, J. W. Kantelhardt, T. Penzel, J. -H. Peter, and K. Voigt, Phys. Rev. Lett., 85, 3736 (2000).
- (47) L. M. Xu, P. C. Ivanov, K. Hu, Z. Chen, A. Carbone, and H. E. Stanley, Phys. Rev. E, 71, 051101 (2005).
- (48) Z. Chen, K. Hu, P. Carpena, P. Bernaola-Galvan, H. E. Stanley, and P. C. Ivanov, Phys. Rev. E, 71, 011104 (2005).
- (49) H. -J. Yang, F. -C. Zhao, L. -Y. Qi, and B. -L. Hu, Phys. Rev. E, 69, 066104 (2004).
- (50) S. -M. Cai, P. -L. Zhou, H. -J. Yang, C. -X. Yang, B. -H. Wang, and T. Zhou, Chin. Phys. Lett. 23, 754 (2006).
- (51) P. -L. Zhou, S. -M. Cai, T. Zhou, and Z. -Q. Fu, 2006 International Conference on Communications, Circuits and Systems Proceedings, (IEEE Press, pp.1744-1748, 2006).