Comment on “Analysis of the Spatial Distribution Between Successive Earthquakes” by Davidsen and Paczuski
Davidsen and Paczuski [1] claim to have found evidence contradicting the theory of aftershock zone scaling in favor of scale-free statistics. We present four elements showing that Davidsen and Paczuski’s results may be insensitive to the existence of physical length scales associated with aftershock zones or mainshock rupture lengths, so that their claim is unsubstantiated.
Firstly, the power law exponent of their probability density distribution (pdf) for distances between pairs of successive earthquakes in southern California is less than . Therefore the exponent cannot hold for the tail because the pdf cannot be normalized and hence can at most describe an intermediate asymptotic (if any). The real tail of the pdf must behave differently, independent of any finite size scaling.
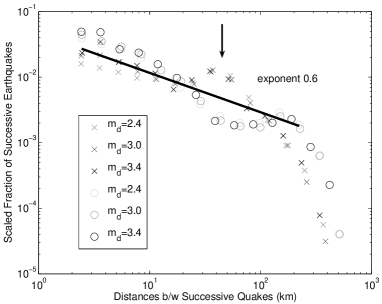
Secondly, we performed tests that show the extreme sensitivity of the suggested power law to the duration of the catalog. We took the same catalog from the Southern California Earthquake Data Center as in [1] with the same parameters but contrasted in Figure 1 the highly active 6-month period from June 1, 1992 until December 31, 1992 including the June 28 M7.3 Landers earthquake (crosses) with the remainder of the catalog both before and after Landers (circles). Firstly, we see that removing 6 months of data from a 17 year period causes the power law to disappear. Secondly, the Landers aftershocks show clear signs of scales, such as the bump marked by an arrow, which may be connected with the simultaneous aftershocks of the June 28 M Big Bear event and the July 11 M Mojave earthquake and the rupture length of Landers.
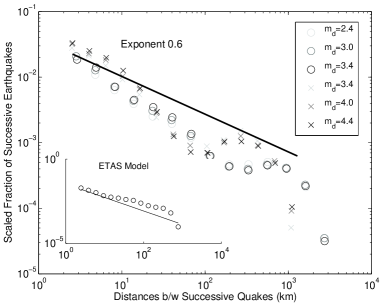
Thirdly, we repeated the same analysis for Japan and northern California and found no evidence of robust power laws. For Japan (Figure 2, circles), we used the JMA catalog from January 1984 to December 2001 within by above magnitude thresholds and resulting in and pairs with distances larger than km, respectively. For northern California (Figure 2, crosses), we used data in the period from January 1984 until December 2004 (28274 events above magnitude ). Our results suggest that the power law found by Davidsen and Pazcuski [1] may not be robust with respect to location, catalog and window size.
Finally, we show in the inset of figure 2 that a model [2] that explicitely obeys aftershock zone scaling can reproduce the observed histogram, demonstrating that the statistic may not be sensitive to the scales. We simulated a seismic catalog using a 3D version of the ETAS model [2] that explicitely includes the scale of each mainshock rupture length in the spatial aftershock decay distribution with distance according to and initiated the catalog with a Landers-like mainshock. We used the parameters (, background=5.0 per day in a 700km by 700km window). We show that the same analysis of data generated with aftershock zone scaling leads to an apparent power law that shows no sign of the aftershock zone scale .
References
- (1) J. Davidsen and M. Paczuski, Phys. Rev. Lett. 94, 048501 (2005).
- (2) Ogata, Y., J. Am. Stat. Assoc. 83, 9 (1988).
M.J. Werner 1 and D. Sornette2,3,
1 IGPP, UCLA, and ESS, UCLA, California 90095-1567, USA
2 LPMC, CNRS UMR 6622 and Univ. Nice, 06108 Nice, France
3 MTEC, ETH Zurich, Switzerland