An Optimal Lookup Table Construction for Charge Division with respect to Efficiency Flatness.
Abstract
Static lookup tables as often used in the position calculation electronics in position sensitive detectors suffer from the well known problem that the propagation of digitization errors in the division leads to unequal efficiencies for the different output channels. In this paper we present a solution to the construction of such a lookup table which is optimal in the sense that the least possible efficiency errors are committed in the class of monotone lookup tables. The obtained resolution is comparable to what is obtained using the standard implementation of the fixed point division. After a theoretical explanation, we present some experimental results confirming our claim.
P. Van Esch 111Corresponding author
F. Millier
Institut Laue Langevin
6, rue Jules Horowitz
BP 156
F-38042 Grenoble
France
1 Introduction
Resistive charge division is a well-known technique for determining the position of the impact of an ionizing particle along a resistive electrode read out by charge amplifiers on both sides. If X is the charge measured at side A and Y is the charge at side B, then the position can ideally be calculated from the dimensionless number:
| (1) |
Several electronic techniques exist to calculate the relative position P from the electronic signals X and Y. Although analog treatment has been used in the past with success, the progress in ADC converters and digital circuitry promotes an all-digital solution. Moreover, the existence of large EPROM memories invites the use of an extremely simple design, which is often used in correspondence with position sensitive detectors: a lookup table which associates which each couple the position . In practice, we’ve build a circuit with two 11-bit inputs for and and one 8-bit output for .
2 Digitization Problem
Although the task of filling in the lookup table may seem simple (use the digitized values of X and Y, and calculate P, rounded to 8-bit accuracy) it leads to an unequal efficiency of each of the 256 channels due to digitization effects. Perfectly uniform irradiation would then lead to unequal intensities observed in the different channels. In the rest of this paper, we will refer to this assignment as the ’standard position calculation’. The quantization effect and the reasons why they are sometimes a problem are well-described in [1]. In this paper we set out to find the best possible lookup table which reduces this effect maximally, without compromising the resolution.
The effect can be explained as follows: a true value X will be represented by its digitized counterpart and a true value Y will be represented by . So a digital couple represents a square in the plane with center of gravity . The standard way of assigning this point (and so all couples in the square we’re considering) to a position bin is by calculating:
| (2) |
and after digitization:
| (3) |
Here, is the number of bits in the output (for 256 position channels, it is equal to 8). The problem arises because this assignment maps the whole square of values to the value as determined by the exact position of its center, and the distribution of these center points is not uniform over the 256 position channels. The probability for a point to be solicited depends on through the pulse height spectrum of the incident radiation.
We make one fundamental hypothesis: we assume that the pulse height spectrum of the captured radiation is independent of position. So we’re actually considering an event distribution which factorizes in the variables E and P:
| (4) |
We know (the pulse height spectrum, assumed independent of the position), and we want to find out from . However, technically, we’re working in the variables X and Y, so we have:
| (5) |
So our task is to extract from . Working directly in the digitized variables (but analytically continuing them…), we have the following coordinate transformation:
| (6) |
The Jacobean of the transformation , so we obtain:
| (7) |
This suggests that points which are geometrically uniformly distributed in the plane (as our digitized couples are) have a weight equal to in the image. It would hence be logical that each bin of the image (each digitized slice of the variable P) contains as much as possible an equal total weight of over each of the points assigned to the bin in the lookup table. Of course there is the constraint that the P’-value of each couple should still be close to the nominal P-value of the chosen bin (otherwise the resolution of our image will suffer seriously). We propose a method which satisfies both requirements.
3 Proposed method
There are already several successful techniques that are proposed to tackle this problem: [2] proposes to assign the (X,Y) point partly to different P-bins ; [3] extends the effective word length over which the division is worked out. [4] partly uses a lookup table to invert (X+Y) and uses a processor to calculate the final position. However, all these techniques change the basic electronic architecture and do not use a simple lookup table. [5] and [6] have written about half-analog methods, using logarithmic amplifiers. [6] has moreover proposed a more classical method of correcting the image off line with efficiency correction coefficients which can be calculated from the pulse height distribution. He points out that this gives rise to increased statistical errors. [1] does give an improved way of calculating a lookup table, but the method is sub-optimal, although probably sufficient for many applications.
We set out to find a mathematically optimal solution of constructing a lookup table. An optimal solution can eventually be used as a benchmark to compare to other techniques.
We first create a list L of all possible pairs of which there are, in our case, . We define a function , that maps the set of integers onto the set of couples in lexical order:
| (8) |
Next, ordering the couples according to their P’ value given in equation 2 comes down to the definition of a permutation p of elements, defined as follows:
| (9) |
The list of the pairs when is running from to is the list of position-ordered couples. We assign a (non normalized) weight to each element in this list in the following way:
| (10) |
with
| (11) |
Taking the normalized, cumulative sum in the order of the list , we finally obtain:
| (12) |
The new mapping is now defined as:
| (13) |
Here we used the inverse permutation , to obtain a final mapping in lexical order, which is necessary to practically program the EPROM memory. In this way, each of the bins has very close to the same summed weight of points in it. We also respect the order of the value so that a couple with a higher value can never be assigned to a lower bin than a couple with a lower value. Within the family of all possible lookup tables which respect the order of , the proposed method gives us the optimal solution concerning the flatness of the efficiency, by construction. Indeed, the construction here proposed makes the efficiencies (the sum of the weights) equal, up to one single effect, that is: in the order of , one has to decide whether a last point will still be attributed to the lower bin (and in that case, the extra weight of this single point might give us a total sum slightly above ), or we might decide to attribute it to the next bin so that the lower bin has a total sum slightly under . Any lookup table construction respecting the order of will have to make this decision and hence at least this error, but in our case, it is the only error. Moreover, apart from this decision on these pivotal points, the proposed lookup table is unique. Hence any other lookup table will give worse efficiency errors. Although quite computing intensive, resolving for the permutation of 4 million pairs of numbers is now within reach of a modern personal computer and can be accomplished in a matter of minutes.
Given that we have now the optimal solution concerning efficiency flatness, we will have to investigate what happened to the position resolution. It turns out that the error in position thus committed is not much larger than the normal quantization error of the standard method (which is optimal with respect to the position resolution). This is understandable, because in the limit of very high binning in X and Y (for the same resolution in P), that is, in the continuum limit, the difference between the standard method and our newly proposed technique vanishes. Indeed, if we work in the real variables (X,Y), limited to the square , let us define digitized variables:
| (14) |
with N the very wide word length of the converters. The accumulated non normalized weight in output channel n (one of the 256), using our new definition of weight, but using the standard assignment, can be approximated very well by an integral:
| (15) |
| (16) |
We now see that the standard assignment already makes the weights accumulated in each position bin equal, so we would obtain exactly the same assignment using our new technique (because the lookup table doing this is unique), whatever pulse height spectrum is used. It also means that if we can estimate the loss in resolution (which will turn out to be insignificant) in a low-bit word example, this will give us an upper limit on the resolution loss. We will study a Monte Carlo example to have an idea of what happens.
4 Monte Carlo simulation.
In order to illustrate the problem and its proposed solution, we simulate the behavior in the case of a low-bit example: we suppose that the incoming signals X and Y are digitized on 6 bits, and that we calculate the position on 6 bits (64 positions). We take as a spectrum an inverted Raleigh distribution, leading to the probability density function:
| (17) |
The precise choice of this distribution doesn’t really matter, it just grossly looks like a true thermal neutron spectrum (using He-3 as a converter gas and in the proportional region) and is mathematically well defined. The proposed ”spectrum” is displayed in figure 1. We simulated points with a uniform position distribution and an energy distribution drawn from the above spectrum. Introducing the digitization according to a 6 bit scale for X and Y, we observe, using the standard position calculation, a severe digitization influence (with spikes of the order of 25 %) on the uniformity of the response of the system, as displayed in figure 2, full line.

Using the newly proposed technique, we obtain the distribution of the calculated position in figure 2, dashed line. The uniformity is clearly superior in the this case. The price to pay is a very small decrease in resolution. Let us investigate how severe it is. The quantization error in the case of the classical calculation is of course close to a uniform distribution with a standard deviation of . Using the Monte Carlo data, we find a standard deviation of 0.292. The standard deviation of the error using the new mapping is measured to be 0.298 when using a uniform weight over all couples (X,Y). The two distributions of the position errors are shown in figure 3. We hence observe a relative loss in resolution of no more than about 2%. Essentially, the resolutions can be said to be equivalent, because this tiny decrease in resolution shouldn’t affect the spatial resolution of the overall system, which shouldn’t be determined by the number of output bins, but by physical processes and noise limiting the intrinsic resolution of the detector.


If we quantify the non-uniformity by calculating the standard deviation of the bin contents (using our sample of 1000000 events) we find the residual standard deviation before quantization is 133.3 counts (per cell) where we expect 125. Using the standard way of calculating positions, we have a non-uniformity of 1686.7 counts, and this is reduced to 388.5 counts using the newly proposed technique.
However, in order for this to hold it is important that the true spectrum in the data matches closely the spectrum used in the design of the lookup table. If we shrink the spectrum of the data by 5% (applying a factor 0.95 to the original spectrum used to construct the table), the good uniformity of the position histogram is partly gone. The standard technique gives us a non-uniformity of 1902.3 counts while the new technique obtains 794.2 counts. A shrinking of 10% leads to a standard non-uniformity of 2236.3, while the proposed technique obtains 1424.0 counts. Although still better, this indicates the need to match closely the spectrum used in the composition of the table to the actual spectrum that will be used in order to take the full advantage of the method. For proportional counters used in thermal neutron detection, this is a reasonable requirement as the spectrum is very stable (and also rather broad). On the other hand, given the very small word lengths in this example, this simulation is a particularly severe test for our method and in practice the sensitivity to a change in spectrum is smaller, as will be shown in the next part.
5 Experimental verification
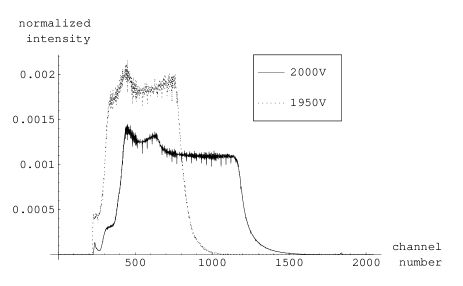
Using an Am-Be thermal neutron source, a 40 cm long position-sensitive He-3 neutron detector available from Reuter-Stokes of the type RS-P4-0814-2, and two 3V/pC amplifiers with an overall gaussian shaping time of 1.4 microseconds, we bias the detector at 2000V. This uses almost the full dynamics available (2048 channels for 5 V) without saturation as illustrated in figure 4.
In order to have very high statistics in a reasonable amount of time, we put the source very close to the detector; we will have no uniform illumination, but the smooth bell form image will indicate local fluctuations in counting efficiency also clearly. Using the standard algorithm and the new technique, we obtain different images as displayed in figure 5 with the dash-dotted and the full curve, respectively.

The digitization glitches are clearly visible in the first one and buried in the statistical noise in the second. (Note that the position of the source is slightly different, as it was a manual positioning in between experiments). Let us now look at the sensitivity of the spectrum: we change the voltage from 2000 V to 1950 V and use the same lookup table (constructed for use with the 2000 V spectrum). Notice that the applied spectrum (see figure 4, dotted curve) now has changed by almost 30%. When looking at the resulting image in figure 5 (dotted curve), we notice that a small digitization error appears around channel 128, but it is still much smaller than if we would have used the standard algorithm.
We have hence experimentally illustrated that the glitches in efficiency disappear when applying our new technique. We’ve also demonstrated a certain robustness against differences between the pulse height spectrum used to construct the lookup table, and the pulse height spectrum of the detector using the lookup table.
References
- [1] H. Geesmann et al. Nucl. Instr. Meth. A307 (1991) 413
- [2] Takahashi et al. Nucl. Instr. Meth. A 373 (1996) 119
- [3] Koike et al. Nucl. Instr. Meth. A272 (1988) 840
- [4] Berliner et al. Nucl. Instr. Meth. 184 (1981) 477
- [5] C. Mori et al. Nucl. Instr. Meth. 299 (1990) 128
- [6] A. Uritani et al. Nucl. Instr. Meth. 353 (1994) 246