Critical dynamics and global persistence exponent on Taiwan financial market
Abstract
We investigated the critical dynamics on the daily Taiwan stock exchange index (TSE) from 1971 to 2005, and the 5-min intraday data from 1996 to 2005. A global persistence exponent was defined for non-equilibrium critical phenomena Janssen ; Majumdar , and describing dynamic behavior in an economic index Zheng .
In recent numerical analysis studies of literatures, it is illustrated that the persistence probability has a universal scaling form Zheng1 . In this work, we analyzed persistence properties of universal scaling behavior on Taiwan financial market, and also calculated the global persistence exponent . We found our analytical results in good agreement with the same universality.
pacs:
47.27.ebI Introduction
Problems in economy and finance have attracted the interest of statistical physicists all over the world. Using the tools developed for statistical physics, like phase transitions, critical exponents, mean field approximations, renormalization group Didier , persistence probability Majumdar1 ; Li ; Constantin .
In recent years the detrended fluctuation analysis (DFA) method Carbonea ; Ausloos ; Vandewalle ; Matia ; Oswiecimka ; Schmitt has become a widely used technique for the determination of (mono-) fractal scaling properties and the detection of long-range correlations in noisy, nonstationary time series Vandewalle . In many of non-equilibrium systems, the persistence has been found to decay as a power-law at time series, . Hurst exponent and persistence exponent in these financial time series are investigated in numerical and analytical Constantin .
We calculated the experimental data with the daily Taiwan stock exchange index (TSE) from 1971 to 2005, and the 5-min intraday data from 1996 to 2005. In this work, we analyzed persistence properties of universal scaling behavior on Taiwan financial market.
II Method
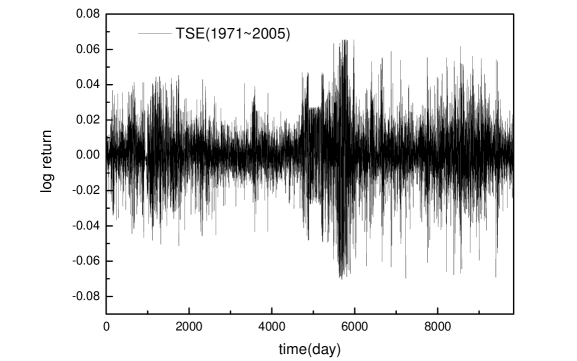
We consider a set of data recorded the daily Taiwan stock exchange index (TSE) from 1971 to 2005. Let be the stock index at discrete times , . The final transaction time is denoted by . Then, the log-return price is defined as
| (1) |
where is time interval. In this paper, we analyzed daily data; day.
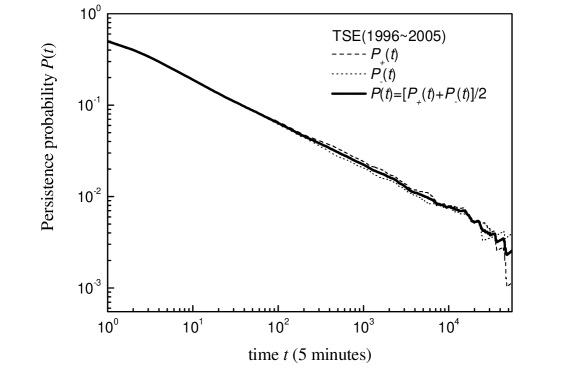
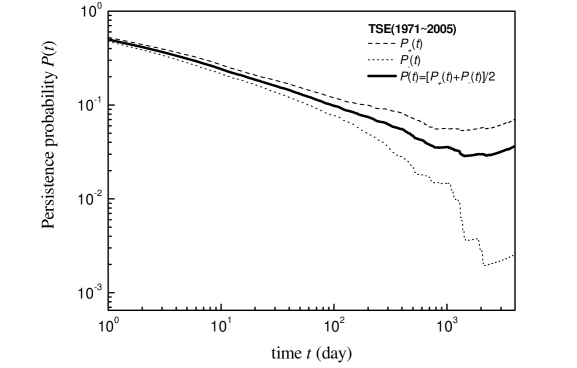
Let us denote the value of the TSE at a certain time as . is the probability that the value of the TSE has never gone down to the value in time , for . i.e., is the probability that the value of the TSE has never gone up to the value in time , for . The persistence probability is .
The persistence probability has a power-law behavior
| (2) |
For the cumulative time series of the log-return price variables is defined as
| (3) |
where is the average value of log-return price. is divided into disjoint segments of length . , , is constant. Since the length of the series is often not a multiple of the considered
| (4) |
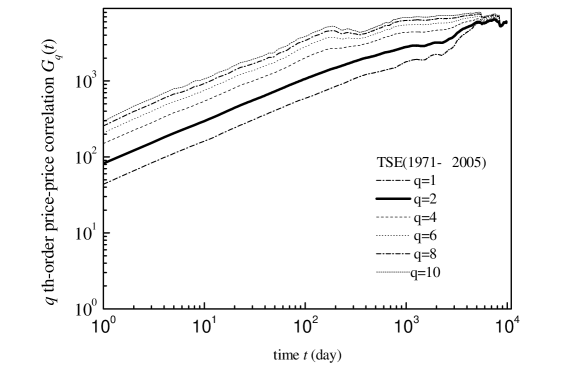
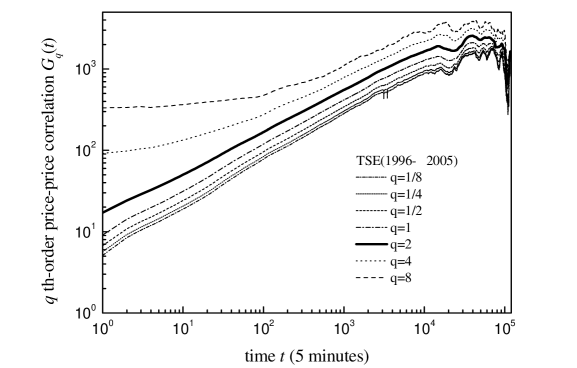
The generalized th-order price-price correlation function is defined as
| (5) |
where is the stock price and the average is over all the initial times . has a power-law behavior
| (6) |
where is called the generalized Hurst exponent.
The generalized fluctuation function is defined as
| (7) |
The generalized th-order fluctuation function is defined as
| (8) |
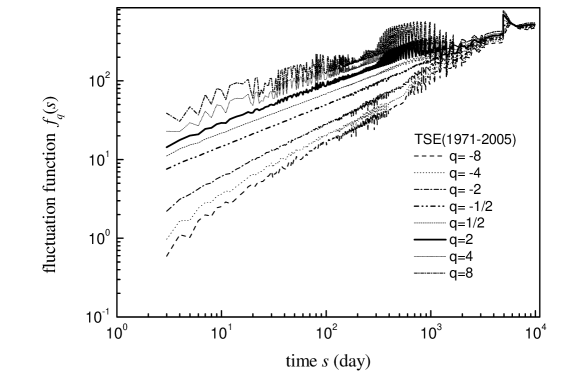
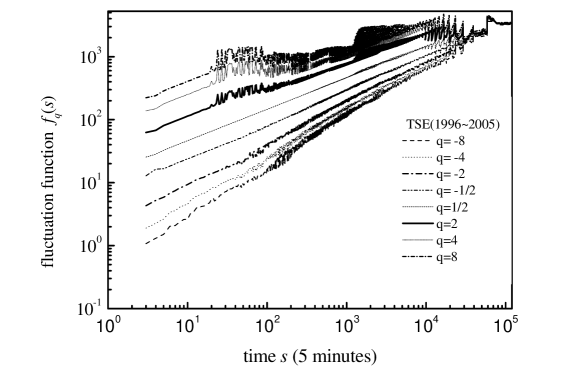
By construction, since we use a linear fit for simplicity, is defined for . The scaling form of the correlation function provides the family of generalized Hurst exponents . For reasons that will become clearer very shortly we also introduce the dimensionless fluctuation function is defined as
| (9) |
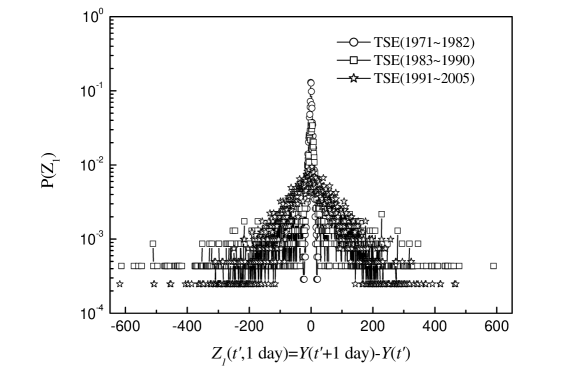
Let us denote the value of the TSE at a certain time as . We calculate the pdf of the index changes
| (10) |
III Discuss and Results
A ”persistence exponent” is defined for non-equilibrium critical phenomena. Based on large amounts of data compiled in past years, especially those records in minutes or seconds, it becomes possible to perform relatively accurate analysis and to study the fine structure of the dynamics. In Fig. 2 and 3, we observe the persistence probability that at least up to least up to 250. The slope of persistence probability estimation from the initial time to 200.
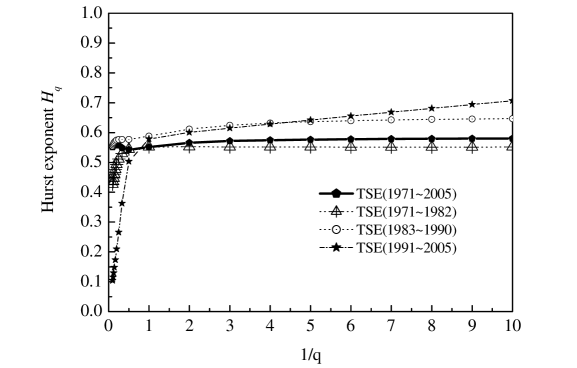
The price evolution is multifractal if the exponent hierarchy varies with , otherwise is fractal in the theory of surface dynamical scaling referred to as multiaffine and self-affine, respectively. In particular, for , we recover the fractional Brownian motion case described by the well-known Hurst exponent, . The bridge between these two analyses is provided by the second-order Hurst exponent associated with the correlation function of the stock price, which has been shown to be simply related to the persistence exponent through .
We note that this relation holds for any zero-mean process (not necessarily Gaussian Hansen ; Maslov )that satisfies requirements above.
| Time | ||
|---|---|---|
| 1971 - 1982 (daily) | 0.54 | 0.41 |
| 1983 - 1990 (daily) | 0.58 | 0.34 |
| 1991 - 2005 (daily) | 0.50 | 0.42 |
| 1971 - 2005 (daily) | 0.54 | 0.46 |
| 1996 - 2005 (5 minutes) | 0.52 | 0.46 |
IV Conclusion
We analyze the daily Taiwan stock exchange index (TSE) from 1971 to 2005 and the 5-min intraday data from 1996 to 2005. The persistence exponent associated with the power-law decay of the average probability.
Our studies base on the persistence probability analysis of the critical behavior in an economic index, and the numerical estimation of the persistence exponent with Hurst exponent .
V References
References
- (1) H. K. Janssen, B. Schaub, and B. Schmittmann, Z. Phys. B 73 (1989), 539.
- (2) S. N. Majumdar, Dibyendu Das, Phys. Rev. E 71 (2005), 036129.
- (3) B. Zheng, Mod. Phys. Lett. B 16 (2002), 775.
- (4) B. Zheng, Int. J. Mod. Phys. B 12 (1998), 1419.
- (5) D. Sornette, A. Johansen, Phys. A 245 (1997), 411.
- (6) S. N. Majumdar, A. J. Bray, S. J. Cornell, and C. Sire, Phys. Rev. Lett. 77 (1996), 3704.
- (7) Z. B. Li, L. Schulke and B. Zheng,Phys. Rev. Lett. 74 (1995), 3396.
- (8) M. Constantin and S. Das Sarma, Phys. Rev. E 72 (2005), 051106.
- (9) A. Carbonea, G. Castellia, H.E. Stanley, Phys. A 344 (2004), 267.
- (10) M. Ausloos and K. Ivanova, Comput. Phys. Commun. 147 (2002), 582.
- (11) N. Vandewalle and M. Ausloos, Eur. Phys. J. B4 (1998), 257.
- (12) K. Matia, Y. Ashkenazy, and H. E. Stanley, Europhys. Lett. 61 (2003), 422.
- (13) P. Oswiecimka, J. Kwapien, and S. Drozdz, Physica A 347 (2005), 626.
- (14) F. Schmitt, D. Schertzer, and S. Lovejoy, Int. J. Theor. (5)Appl. Finance 3 (2000), 361.
- (15) A. Hansen, T. Engoy, and K. J. Maloy, Fractals 2 (1994), 527.
- (16) S. Maslov, M. Paczuski, and P. Bak, Phys. Rev. Lett. 73 (1994), 2162.