Strong ExB shear flows in the transport barrier region in H mode plasma
Abstract
We report the first experimental observation of stationary zonal flow in the transport barrier region of the H mode plasma. Strong peaks in shear mark the width of this region. Strong low-frequency ( 0.6 kHz) zonal flow is observed in regions of increased , suggesting substantial contribution of zonal flow to the spatial modulation of radial profiles. Radial localization of the zonal flow is correlated with a region of zero magnetic shear and low-order (7/5) rational surfaces.
pacs:
52.25.Fi, 52.25.Gj, 52.55. sTransport barriers (TBs) are radially localized regions in toroidal plasma where radial transport of particles or energy is drastically reduced. In the high confinement mode (H mode) Wagner1982 , the presence of a TB is manifested as a steep density (or temperature) gradient near the plasma boundary. The top of this region is sometimes referred to as a pedestal.
Characteristics of the H mode edge TBs are important. Spatial structure of a TB is closely related to the global stability, confinement and the plasma performance (for a review see, for example, Fujisawa_PPCF_2003 ). Understanding and predicting characteristics of the TBs has become a focus of the international fusion community (see, e.g., Hatae2001 ; Fujita2002 ). The ultimate goal of these studies is the optimization of the radial profiles of the plasma parameters in the future fusion reactor ITER .
The formation of a TB has been ascribed to the generation of a sheared radial electric field (or E B flow, where E is the electric field and B is the magnetic field) which leads to the reduction in turbulence and transport Terry2000 ; Gohil_PPCF_2002 ; Hahm_PPCF_2002 . However, the physics of the TB formation is not yet well understood. Experimental studies of TBs are restricted due to difficulties in measuring radial parameter profiles with sufficient spatial and temporal resolution.
In this Letter we report detailed experimental studies of the TB structure in H mode of the H-1 heliac. It is shown for the first time, that distinct features in the electron density profile, marking the pedestal and the foot of TB, spatially coincide with radially localized strongly sheared E B flows. These radial regions are also identified as regions where strong stationary zonal flows are localized in H mode. The radial localization of zonal flows also coincides with the position of a low-order rational surface and a minimum in the magnetic shear. These results confirm, to some extent, a hypothesis based on results of the gyrokinetic simulations that strong zonal flows developing near rational surfaces can provide a trigger for the TB formation Waltz2006 .
We present results obtained in the H-1 toroidal heliac Ham90 (major radius of = 1 m and mean minor plasma radius of about m) under the following plasma conditions (see, for example, Sha02a and references therein): m-3, eV, eV in argon at filling pressure of 10-5 Torr and at low magnetic fields, T. Such plasma is produced by 80 kW of the radio-frequency waves at 7 MHz. Several combinations of Langmuir probes (single, triple probes) are used to characterize plasma parameters, such as the electron density, electron temperature, and electrostatic potential, as described in Sha02b . Probes are also used to characterize poloidal and toroidal wave numbers of turbulent fluctuations Shats_PPCF_06 .
The high confinement mode observed in H-1 Sha99 is similar to H mode in tokamaks. Typical electron density and plasma potential profiles are illustrated in Fig. 1 for low (L) and H modes. L and H modes are achieved respectively above and below critical magnetic field Sha99 . When the magnetic field is close to the critical value, spontaneous L-H transitions are observed. In these discharges, a triple probe is used to measure the electron density and potential on a shot-to-shot basis. Excellent reproducibility of the measurements allows reliable determination of profiles without perturbing plasma by the probe arrays.
Despite large differences in electron temperature, density, and magnetic field, plasmas in H-1 and in the TB regions of large tokamaks, are dimensionally similar. This dimensional similarity has been discussed in Punzmann2004 , where it has been shown that the width of TB measured in ion gyroradii is very similar to that in, for example, DIII-D tokamak. However in absolute units, the TB width in H-1 is substantially broader (30-40 mm) than that in larger experiments with stronger magnetic fields and lighter ions. This, in combination with low electron temperature in H-1, opens an opportunity to study structure of the TB using probes with sufficiently high spatial resolution.
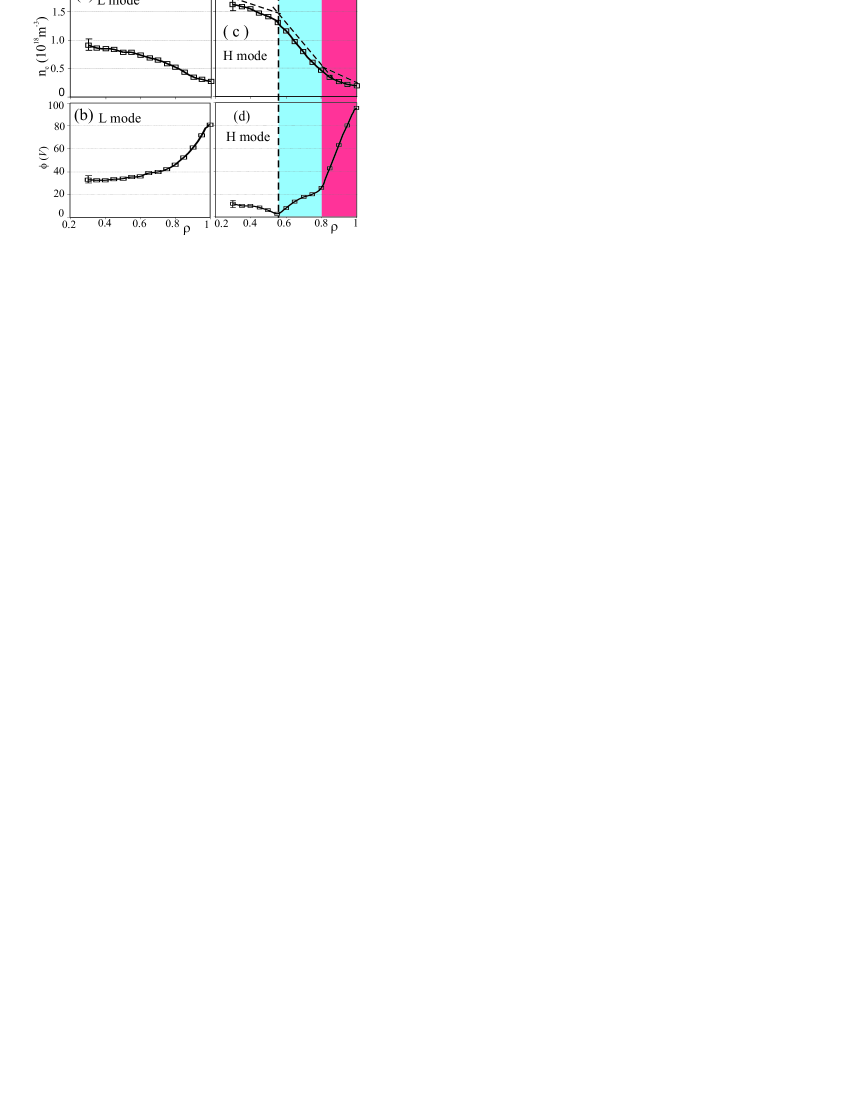
The development of the TB in H mode plasma in H-1 is illustrated in Fig. 1. Radial profiles of the electron density and the plasma potential in L mode are rather featureless as seen in Fig. 1(a,b). In H mode, the central density doubles while the plasma potential becomes more negative in the central region and more positive at the edge (Fig. 1(c,d)). The increase in the density coincides with the formation of the characteristic kink in the density profile at about , referred to as the pedestal. The profile outside the pedestal can be approximated by a straight line (Fig. 1(c)). The profile of the plasma potential also shows two characteristic kinks: one at the top of the TB, and the other at , which we will refer to as the foot of the TB. The third kink in the plasma potential is seen near the last closed flux surface () and is due to the reversal of the radial electric field from negative (inside) to positive (outside). We use dashed guide lines and shading throughout the paper to mark two radial regions of interest: (I) - a region between the top and foot of the TB, and (II) - a region between the foot and the last closed flux surface.
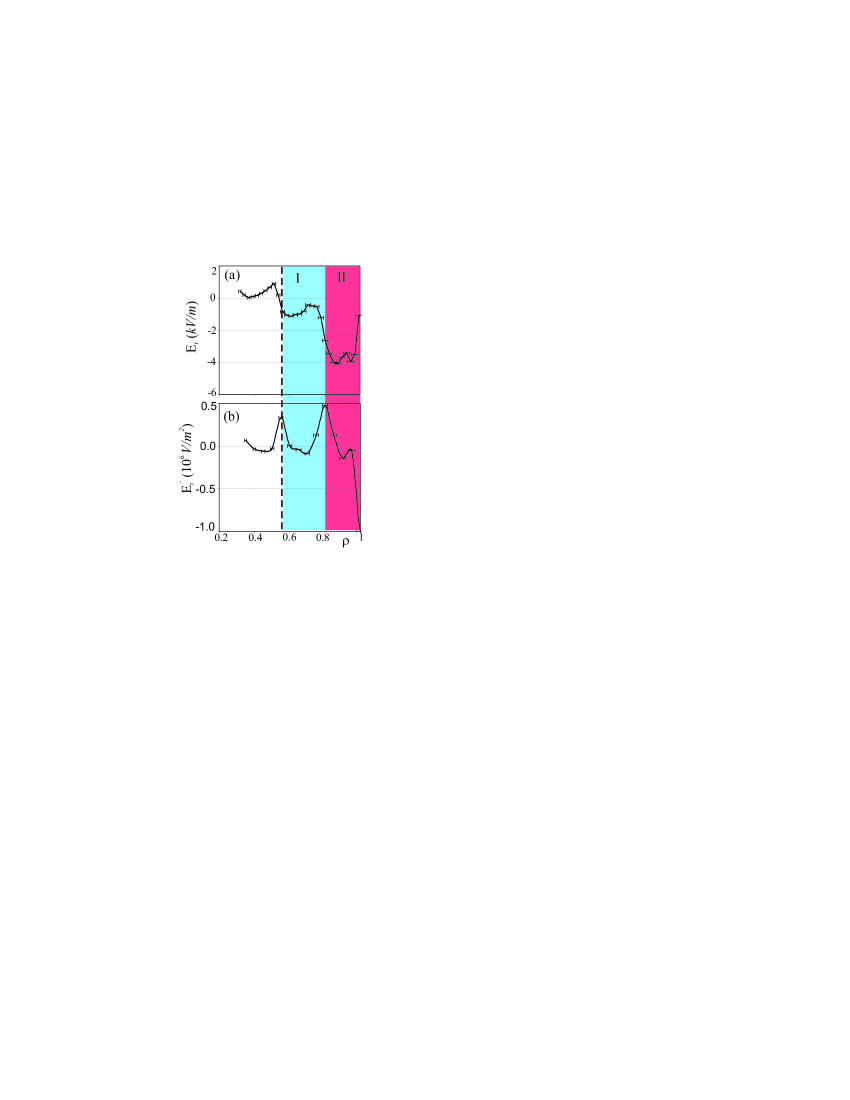
Profiles of the radial electric field and its shear , derived from the radial profile of the plasma potential are shown in Fig. 2. Since is computed by differentiating radial profile of the plasma potential, the (negative) maxima of the radial electric field can not be determined exactly. Three regions are seen: slightly positive inside the top of the transport barrier, substantial negative -1 kV/m in region I, and even more negative -4 kV/m in region II. Correspondingly, the has distinct peak at the top, at the foot of the transport barrier and at the last closed flux surface.
Fluctuations in the electron density and potential are strongly reduced in a broad range of frequencies from L to H mode as discussed in Shats_PRE_05 . However, the low frequency ( 0.6 kHz) spectral feature increases in some radial regions, which will be discussed later. The power spectra of the fluctuations in the plasma potential, , at various radial positions in H mode are shown in Fig. 3(a). The low-frequency feature ( kHz) is dominant in H mode. Poloidal wave number of this low frequency component is measured using two poloidally separated probes. Measured poloidal wave number of m-1 at kHz is indicative of the mode number . The toroidal mode number is estimated using toroidally separated probes, as described in Shats_PPCF_06 , and shows . Hence the strong low frequency fluctuations in the plasma potential are identified as stationary zonal flows. It should be noted that it is usually difficult to align toroidally separated probes to exactly the same poloidal position. As a result, a phase shift between toroidally separated probes will occur due to the uncertainty in the poloidal separation between the probes, :
| (1) |
where and are toroidal and poloidal separation between the probes respectively, and is known from the phase difference between the probes which are poloidally separated. In case of a zonal flow, , the second term on the right-hand side becomes zero (since ), such that the poloidal uncertainty becomes unimportant and the toroidal wave number can be reliably estimated by measuring .
Spectra similar to those in Fig. 3(a) have also been observed in the Compact Helical System (CHS) using heavy-ion-beam probe Fujisawa_PRL_04 . In that experiment, low frequency potential structures were also identified as stationary zonal flows.
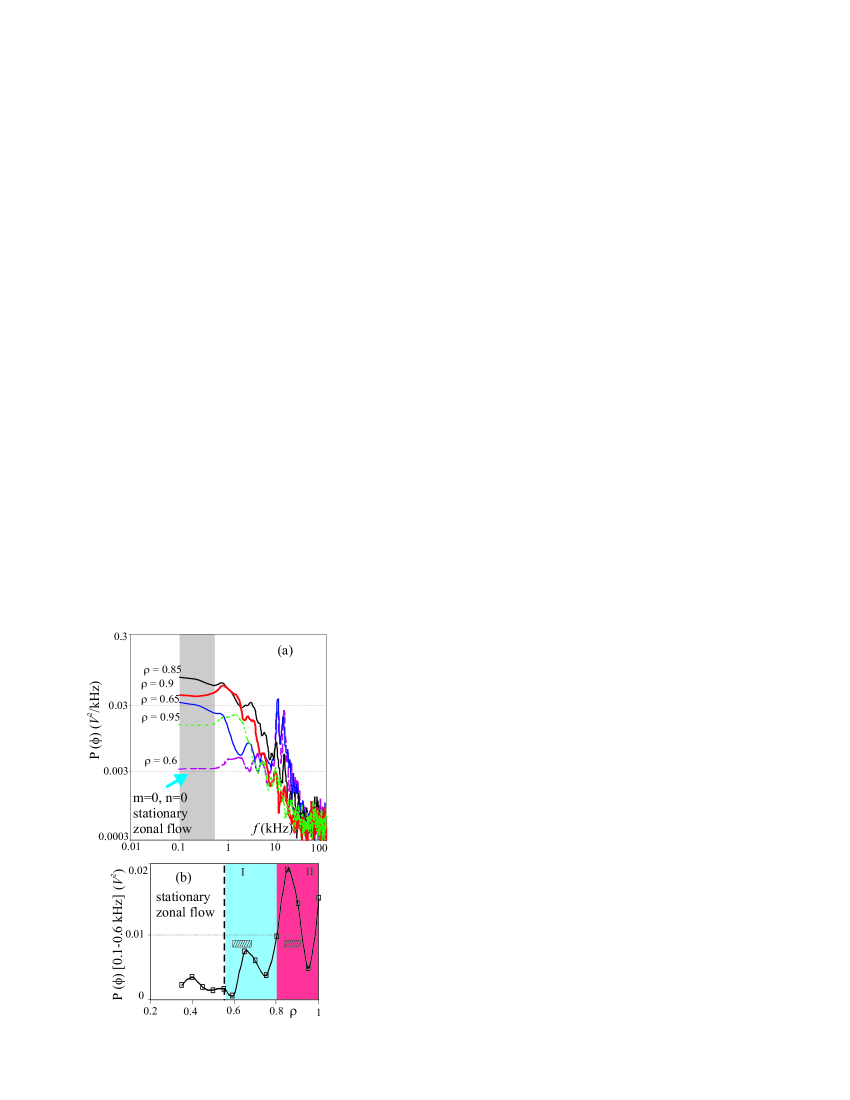
The spectral power density of the zonal flow (shaded spectral region of kHz in Fig. 3(a)) varies along the radius. Radial profile of the spectral power density of the zonal flow in H mode is presented in Fig. 3(b). Stationary zonal flow is a band-like structure localized in radial region of .
Two hatched boxes drawn in Fig. 3(b) indicate the uncertainty in the radial positions of the (negative) maxima in regions I and II ( Fig. 2(a)). It can be seen that the zonal flow maximum spatially coincides with the maximum in (negative) . This suggests that stationary zonal flow directly contributes to mean and may be responsible for the ”corrugation” of the profile seen in Fig. 2(a).
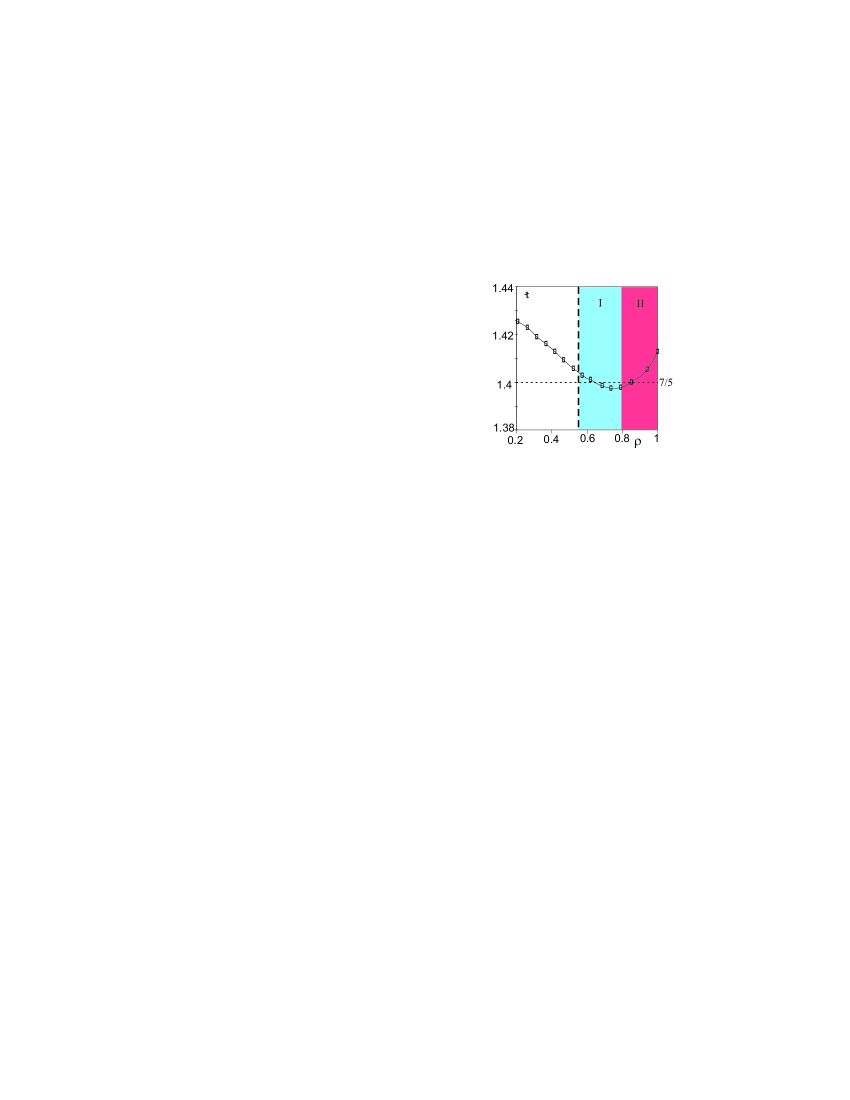
The list of spatially coinciding phenomena in this plasma is complemented by the observation that the TB region appears in the vicinity of the zero magnetic shear in this magnetic configuration. The computed radial profile of the rotational transform (where is the safety factor) is shown in Fig. 4. In addition to zero shear at 0.75, = 1.4 = = 7/5 rational surfaces are present in both zones I (at 0.65) and II (at 0.85). The accuracy of the computation has been verified using experimental electron beam mapping Shats_RSI_95 . The existence of the 7/5 rational surfaces is also confirmed by the observation of the chain of magnetic islands in the region of . The plasma current in the H-1 heliac is negligibly small ( A) and does not affect the vacuum magnetic structure.
A possible role of low-order rational surfaces in the formation of H mode has been recognized since the first observation of H mode in stellarators Wagner_PPCF_94 ; Ascasibar_PPCF_2002 . Spatial correlation of the rational surfaces with the stationary zonal flows, seen in Fig. 3(b) and Fig. 4, may be indicative of the generation of stationary zonal flows due to the influence of the rational surfaces, as suggested in Hidalgo_PPCF_2001 .
Formation of the TB and strong stationary zonal flow is also observed during spontaneous L-H transitions in H-1, described in Punzmann2004 . Fig. 5(a) shows temporal evolution of the mean plasma density during spontaneous L-H transition. In this discharge the mean electron density jumps from about m-3 to almost m-3 in about one millisecond. Similarly to stationary H mode discharges described above, strong zonal flow in the TB region is observed in the H mode stage of discharges with spontaneous transitions. The spatial correlation of the TB regions and stationary zonal flow in the spontaneous transitions is also observed.
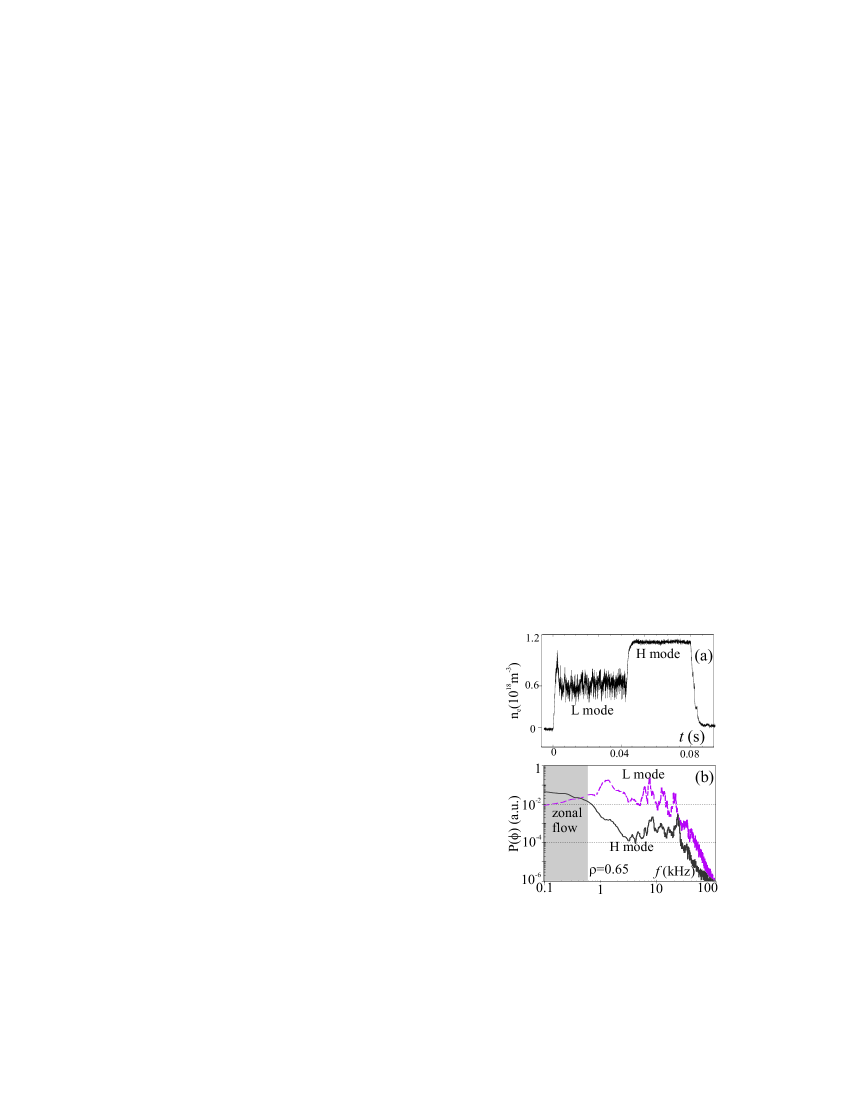
In Fig. 5(b), the change of the fluctuation power spectra across the L-H transition at the radial position of is illustrated. It can be seen that across the transition, fluctuations in the broad spectral range from 0.6 to 100 kHz are reduced, while the spectral power of low-frequency zonal flow, kHz, is increased.
Many of the ingredients of the TB physics presented in this paper have been discussed with regard to H modes in tokamaks and stellarators. For example, the role of the low-order rational surfaces Garcia_PoP_2001 ; Hahm_PPCF_2002 , the role of zonal flows in L-H transition Fujisawa2006 , modification of the profiles by non-neoclassical (turbulence-driven) effects Diamond1991 ; Terry2000 ; Wagner2006 .
Here we present for the first time experimental evidence that zonal flow, which develop near the = 7/5 rational surfaces, is spatially correlated with distinct regions of the radial electric field inside the TB region in the H mode plasma. The resulting strong peaks in shear coincide with the kinks in the density profile in H mode, suggesting that the strong peaks in the define the position and the width of the TB. Similar physical picture has recently emerged as a result of analysis of gyrokinetic simulations of DIII-D tokamak discharges Waltz2006 . Corrugations in the radial profiles of electron density, temperature and radial electric field in DIII-D are observed near low-order rational surfaces. The development of strong zonal flows and strong shear layer in these plasma regions suggests the development of zonal flow as a trigger for the TB formation.
Since zonal flows are usually thought of as turbulence-driven flows, possible mechanisms of the zonal flow enhancement and sustainment in H mode, when the level of turbulence is substantially reduced, need to be explained. It has been suggested in Shats_PRE_05 , that the redistribution of spectral energy from a broad range of intermediate scales into a stationary zonal flow is the mechanism of the zonal flow enhancement during L-H transitions. The result shown in Fig. 5(b), to large extent confirms this hypothesis in a radial region close to the transport barrier. Also in Shats_PRE_05 we presented experimental evidence that the nonlocal spectral transfer of energy from the unstable drift wave is responsible for the sustainment of zonal flow in H mode, as has been proposed in Balk_JETP_90 . Further theoretical work in this direction is needed.
Acknowledgements.
The authors would like to thank Santhosh Kumar for providing computed data on rotational transform.References
- (1) F. Wagner et al., Phys. Rev. Lett. 49, 1408 (1982).
- (2) A. Fujisawa, Plasma Phys. Controlled Fusion 45, R1 (2003).
- (3) T. Hatae et al., Nucl. Fusion 41,285 (2001).
- (4) T. Fujita, Plasma Phys. Controlled Fusion 44, A19 (2002).
- (5) ITER physics expert groups on confinement and transport and confinement modelling and database, et al., Nucl. Fusion, 39,2175 (1999).
- (6) P. Terry, Rev. Mod. Phys. 72, 109 (2000).
- (7) P. Gohil, Plasma Phys. Controlled Fusion 44, A37 (2002).
- (8) T.S. Hahm, Plasma Phys. Controlled Fusion 44, A87 (2002).
- (9) R.E. Waltz et al., Phys. Plasmas 13,052301 (2006).
- (10) S.M. Hamberger et al., Fusion Technol. 17, 123 (1990).
- (11) M.G. Shats and W.M. Solomon, Phys. Rev. Lett. 88, 045001 (2002).
- (12) M.G. Shats and W.M. Solomon, New Journal of Physics 4, 30 (2002).
- (13) M.G. Shats et al., Plasma Phys. Control. Fusion 48, S17 (2006).
- (14) M.G. Shats et al., Phys. Rev. Lett. 77, 4190 (1996).
- (15) H. Punzmann and M.G. Shats, Phys. Rev. Lett. 93, 125003 (2004).
- (16) M.G. Shats et al., Phys. Rev. E 71, 046409 (2005).
- (17) A. Fujisawa et al., Phys. Rev. Lett. 93, 165002 (2004).
- (18) F. Wagner et al., Plasma Phys. Control. Fusion 36, A61 (1994).
- (19) M.G. Shats et al., Rev. Sci. Instrum. 66, 1163 (1995).
- (20) E. Ascasibar et al., Plasma Phys. Control. Fusion 44, B307 (2002).
- (21) C. Hidalgo et al., Plasma Phys. Control. Fusion 43, A313 (2001).
- (22) L. Garcia et al., Phys. Plasmas 8, 4111 (2001).
- (23) A. Fujisawa et al., Plasma Phys. Control. Fusion 48, A365 (2006).
- (24) P.H. Diamond and Y.B. Kim, Phys. Fluids B 3, 1626 (1991).
- (25) F. Wagner et al., Plasma Phys. Control. Fusion 48, A217 (2006).
- (26) A.M. Balk et al., Sov. Phys. JETP 71, 249 (1990).