Opinion dynamics and synchronization
in a network of
scientific collaborations
Abstract
In this paper we discuss opinion dynamics in the Opinion Changing Rate (OCR) model, recently proposed in Ref. [1]. The OCR model allows to study whether and how a group of social agents, with a different intrinsic tendency () to change opinion, finds agreement. In particular, we implement the OCR model on a small graph describing the topology of a real social system. The nodes of the graph are scientists partecipating to the Tepoztlán conference, celebrating Alberto Robledo’s 60th birthday, and the links are based on coauthorship in scientific papers. We study how opinions evolve in time according to the frequency rates of the nodes, to the coupling term, and also to the presence of group structures.
, , ,
1 Introduction
In the last years
there has been an increasing interest in statistical physics for
interdisciplinary applications. Not only
biology, economy and geology, but also soft sciences [2]
like sociology or cognitive sciences
have been involved. An effort in this sense
has also been advocated in order to strengthen the scientific aspect of these disciplines [3]. At the same time, the study of complex networks, concerning both their structure and their dynamics,
has seen an explosive evolution [4, 5, 6].
This field is probably only in its infancy and
will likely reinforce the interdisciplinary new directions of contemporary statistical physics.
Within this scenario, many sociophysics papers have been published and new models have
been proposed for studying in particular opinion dynamics and
consensus formation [7, 8, 9, 10, 11, 12].
Although in many cases such models offer at the moment an oversimplified description
of a real social system, they can be hopefully very useful in the
long term.
In this paper we discuss opinion formation mechanisms, and in particular
we study the implementation on a real social network of a
recently proposed model,
the Opinion Changing Rate (OCR) model [1].
The latter is a modified version of the Kuramoto model [14, 15, 16]
adapted to the social context. The OCR model
allows to explore the possible role of synchronization in the process of opinion formation.
In previous works we have considered a group of fully coupled agents with a
different natural tendency () to change opinion.
Here we extend the study to a system of agents on a small graph representing a
real social network, namely the network of scientific collaborations
among statistical physicists in which Alberto Robledo is involved.
The paper is organized as follows. In section 2 we review the main
features of the OCR model. In section 3 we explain how the network
has been constructed. There we study its structural properties with particular
attention to the subdivision in community structures and we
discuss the results of numerical simulations of the
the OCR model on the network.
Conclusions are drawn in section 4.
2 The Opinion Changing Rate (OCR) model
Many of the most popular opinion formation models
have the limitation of not
taking into account the individual inclination to change,
a realistic feature of any individual.
In fact each one of us changes idea, habits, style of
life or way of thinking in a different way, with a different velocity.
There are conservative people
that strongly tend to maintain their opinion or their style
of life against everything and everyone.
There are more flexible people that change ideas very easily
and follow the current fashions and trends. Finally, there are
those who run faster than the rest of the world anticipating
the others. These different tendencies can be interpreted
as a continuous spectrum of different degrees of natural
inclination to changes.
In a recent paper [1] we showed how such a personal inclination
to change, randomly distributed in a group of individuals,
can affect the opinion dynamics of the group itself.
Switching from the question
”Could agents with initial different opinions reach a final agreement?”
into the more realistic one
”Could agents with a different
natural tendency to change opinion reach a final agreement?”,
we introduced a new idea, the natural
opinion changing rate, that is very similar to the
characteristic frequency of an oscillator. In such a way,
one can treat consensus as a peculiar kind of synchronization
(frequency locking) [13], a phenomenon which has been very well studied in different contexts
by means of the Kuramoto model[14, 15, 16].
The Kuramoto model of coupled oscillators is one of the simplest
and most successful models for synchronization.
It is simple enough to be analytically solvable, still retaining
the basic principles to produce a rich variety of dynamical regimes
and synchronization patterns.
The most interesting feature of the model is that,
despite the difference in the natural frequencies of the
oscillators, it exhibits a
spontaneous transition from incoherence to collective synchronization
beyond a certain threshold of the coupling strength [16].
The existence of such a critical threshold for synchronization is
very similar to the consensus threshold found in the majority of the opinion formation models.
Thus we modified the Kuramoto model in order to study synchronization mechanisms in consensus formation.
In our model each oscillator represents an agent corresponding to a node of a given network and
the topology of the network fixes the neighborhood of every agent.
The dynamics of a system of individuals is governed by the following set of differential equations:
| (1) |
where is the opinion of the th agent at time . Here the opinions have a very general meaning and can represent the style of life, the way of thinking or of dressing etc, thus they can be usefully represented by means of unlimited real numbers . Opinions interact by means of the coupling term, where is the coupling strength and is the degree (i.e. the number of first neighbors) of each agent. The exponential factor in the coupling term, tuned by the parameter , ensures that opinions will not influence each other any longer when the reciprocal distance exceeds a certain threshold. This is perhaps the most remarkable feature of the OCR model with respect to the Kuramoto model, since it allows the system to reach an asymptotic stationary state where the configuration of opinions does not vary any longer. The parameter appears also as a factor of the sine in the coupling term and simply rescales the range of the coupling strenght. 111Please notice that, due to a misprint, this factor before the sine term is missing in formula (7) of ref.[1] We typically adopted the value =3, which ensures a consistent behavior of the exponential decay. Finally, the ’s - corresponding to the natural frequencies of the oscillators in the Kuramoto model - represent here the so-called natural opinion changing rates (ocr), i.e. the intrinsic inclinations of the agents to change their opinions. For this reason we called our model: the Opinion Changing Rate (OCR) model [1]. The values ’s, which do not depend on time, are distributed in a uniform random way with an average . In this way we can simulate the behaviour of both conservative individuals, characterized by small values of (), and more flexible people, with high values of (). Agents going against the mainstream can be also simulated, by choosing negative values for their ocr.
In Ref.[1], we studied the opinion dynamics of the OCR model considering
a fully connected network.
The numerical simulations were performed typically
with agents and with a uniform distribution of the
initial individual opinions in the range [-1,1].
The natural ocr were
taken from a uniform distribution in the range [0,1].
By solving numerically the set of ordinary differential equations
(1) as a function of the coupling strength , we observed
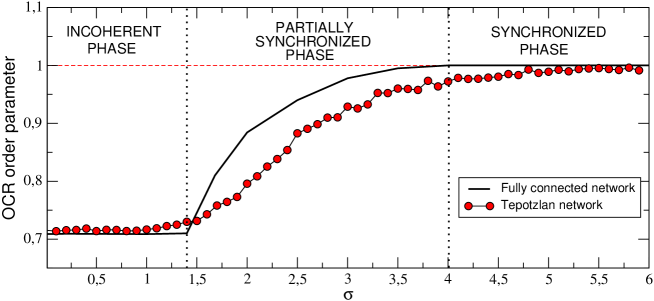
a transition from an incoherent phase (for ), in which people
tend to preserve different opinions according to their natural rate ,
to a partially synchronized phase, where people share a small number of opinions,
and, finally, to a fully synchronized one (for ) in which all the people change
opinion with the same rate and share a common social trend.
In order to measure the degree of synchronization of the system,
we adopted an order parameter related to the standard deviation of the
opinion changing rates and defined as
,
where is the average over all individuals of .
From such a definition it follows that
in the fully synchronized phase and in the incoherent or
partially synchronized phase.
In Fig.1 we report as a full line the asymptotic (stationary) value of the order parameter
as a function of for a fully connected system,
as reported in Ref.[1]. A phase transition occurs at .
A further analysis of the model showed that in the region
(belonging to the partially synchronized phase) an equilibrium between
conservative and progressist components (a sort of bipolarism) can be observed.
Conversely, out of this window, the system rapidly reaches a final configuration
consisting in many small opinion clusters (anarchy) or in a single large
cluster (complete consensus).
Moreover, starting the system with all the agents sharing the same opinion
and for ,
one observes an interesting kind of metastability: even though we are in the partially
synchronized phase, the system relaxes to the partially synchronized state
only after a metastable regime, where the opinions remain synchronized.
The duration of such a metastable regime
was observed to diverge when the value of approaches .
| Group 1 (G1) | Bukman, Hernandez-Saldana, Indekeu, Majoral, Moyano, |
| Robledo, Widom | |
| Group 2 (G2) | Abe, Anteneodo, Borland, Gell-Mann, A.Plastino, A.R.Plastino, |
| Rajagopal, Tamarit, Thurner, Tirnakli, Tsallis | |
| Group 3 (G3) | Andronico, Baldovin, Caruso, Crucitti, Latora, Pluchino, |
| Rapisarda, Tadic | |
| Group 4 (G4) | Barré, Bouchet, Dauxois, Campa, Giansanti, Mukamel, Ruffo, |
| Stella, Yamaguchi | |
| Group 5 (G5) | Cohen, Beck, Rizzo, Swinney |
| Group 6 (G6) | J.Andrade, Coniglio, Dawson, Franzese, Havlin, Herrmann, |
| Leyvraz, Mantegna, Sciortino, Stanley |
3 The OCR model on a real network of scientific collaboration
In this section we study the dynamical evolution of the OCR model on the
topology of a real social network, namely
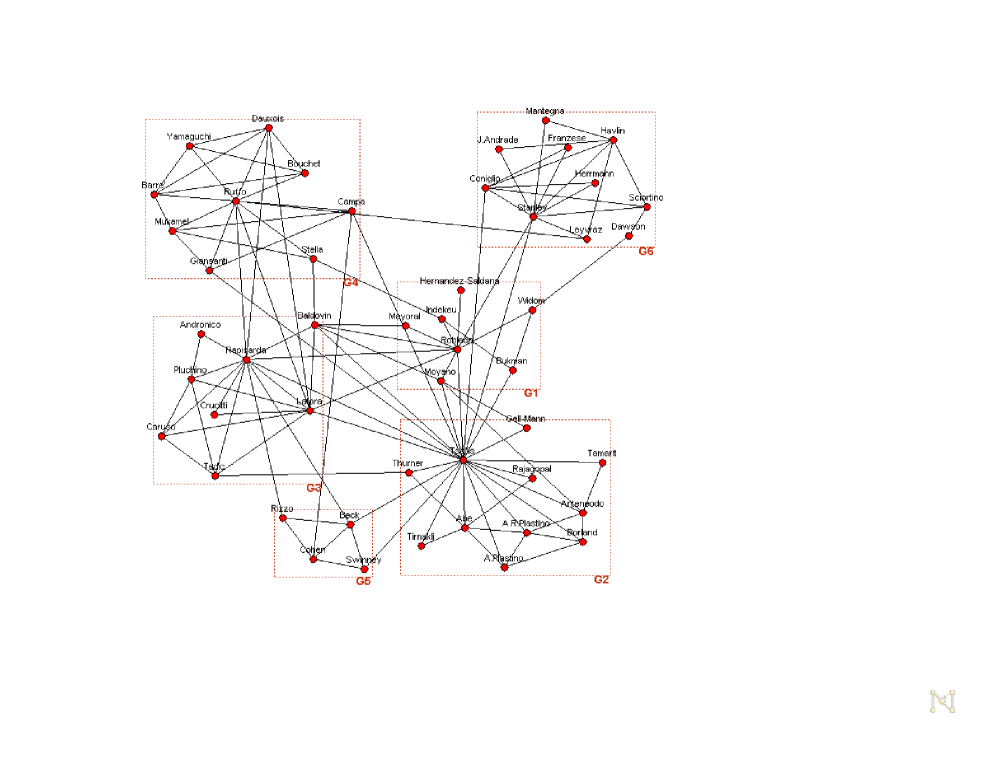
the network of scientific collaborations shown in Fig.2. Such a network is made of
nodes and links.
The nodes of the network represent some of the people
who attended the Tepoztlán conference, celebrating Alberto Robledo’s 60th birthday,
including also other scientists who collaborate with them.
For this reason we named it the Tepoztlán Network (TN).
The graph has been constructed by using information on coauthored scientific
publications from the cond-mat archive at arXiv.org and from the web engine Google scholar.
The resulting graph is simple and unweighted [6]. In fact,
a link between node and node indicates that the two respective agents share at least
one scientific preprint or co-editorship, which reveals the existence of
a scientific collaboration.
Of course some links could be likely missing, but it is not very important here
if such a network is fully realistic or not. Actually what we want to do is to see how groups of collaborating people ”sharing the same opinion” or the same
scientific interests evolve in time according to the natural tendency
to change opinion (i.e. the natural ocr) of their members, the topology of the network and
the strength of interaction .
In order to find the best modular division of the nodes of the graph
into groups or communities (i.e. subsets of nodes which are more densely linked when
compared to the rest of the network),
we have used the Girvan-Newman (GN) algorithm for the detection
of community structures [17].
This is a hierarchical divisive algorithm, based on the progressive removal
of the edges with the highest score of betweenness, the latter being a measure
of the fraction of shortest paths that are making use of a given edge.
The GN algorithm produces a hierarchical tree of communities starting with a single community
including all the nodes of the graph, and ending into a set of communities
of isolated nodes.
But which of these nested subdivisions describes the real community structure
of the network ?
To answer this question it was introduced the so-called
modularity [17], a variable that quantifies the
degree of correlation between the probability of having an edge joining
two sites and the fact that the sites belong to the same community.
Actually, given an arbitrary network
and an arbitrary partition of that network into communities, it
is possible to define a size matrix whose elements represent the fraction of total links
starting at a node in partition and ending at a node in partition
. Clearly the sum of any row (or column) of , namely , corresponds to the fraction of links connected to
.
For a random network, that does not exhibits any community structure,
the expected value of the fraction of links within
partitions would be simply the probability that a link
begins at a node in , , multiplied by the fraction of links
that end at a node in , . So the expected number of
intra-community links is just . On the other hand,
we know that the real fraction of links exclusively within a partition is
. So, we can compare the two directly and sum over all the
partitions in the graph, thus obtaining exactly the definition of modularity:
| (2) |
It is easy to see that if we take the whole
network as a single community, or if the network is a random one, we get the minimum value ;
on the other hand, values approaching the maximum value indicate strong community
structure. In practice, however, never reaches the value and,
for networks with an appreciable subdivision in classes, it
usually falls in the range [,].
If we apply such a method to the Tepoztlán network, we find that the best subdivision
is the one in six groups , , , , and
shown in Fig.2. This division has the considerable modularity value of .
We report the detailed list of the members of the six groups in Table 1.
It is noticeable that such a subdivision reproduces quite well (even if not exactly)
the real scientific groups of the
Tepoztlán collaboration network, at least according to our perception. Thus in the following
we will adopt it in order to characterize clusters of agents sharing the
same opinion in the context of the OCR model.
Now let us integrate model (1) numerically over the TN.
In this case the ’s become the opinions of the agents of the TN at time and
the ’s represent their natural ocr.
Of course it would be difficult to hazard any hypotesis about the conservative or progressist
natural inclinations of the TN people, thus we will randomly choose the ’s
from a uniform distribution .
Finally, as already pointed out before, and represent, respectively, the neighborhood and the
degree of node -th.
First of all, starting from a uniform distribution on opinions into , we have verified that
also in this case a transition from an homogeneous phase toward a synchronized one occurs around
the critical value of the strength of interaction.
Such a behavior is visible in Fig.1, where we plot with full circles the order parameter versus
for the OCR model on the Tepoztlán network, averaged over 100 realizations and
compared with that one obtained for the fully connected network
(full line) discussed before. Notice that, in the TN case, the transition is smoother and the curve
fluctuates more than the other one.
This is due to the small number of nodes of the collaboration network, N=49,
if compared to that one of the fully connected system, N=1000.
In the next paragraph we will see that a narrow window inside
the partially synchronized phase results to be the most interesting region
of the diagram.
3.1 Evolution of an initial state of synchronized opinions
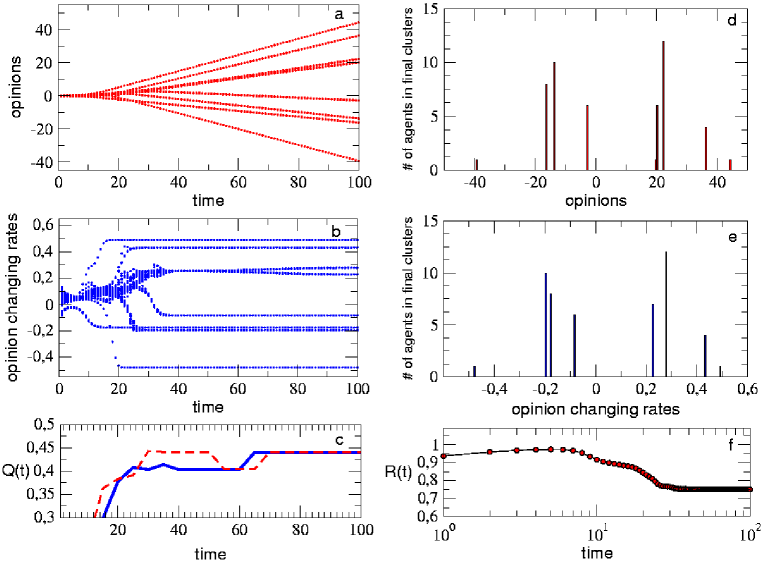
In Fig.3 we show the time evolution of the Tepoztlán network community for and for an initial state with all the members sharing the same opinion . The natural ocr have been randomly chosen again in the range . In panels (a) and (b) we plot the evolution of the opinions and of the opinion changing rates over 100 time steps (please notice that the uniformly distributed natural ocr represent also the initial conditions for the ocr variables ). We can see that, after an initial short metastable transient in which both the opinions and the opinions changing rates stay synchronized (in fact , as shown in panel (f)), the system rapidly clusterizes with a branching process strongly affected by the topology of the network. The respective asymptotic stationary configurations of clusters are shown in panels (d) and (e). Finally, in panel (c) the step-by-step modularities for both the opinion clusters configurations (dashed line) and the ocr clusters configurations (full line) are also reported. From the value that characterizes the metastable configuration with only one large cluster, both modularities increase to a value in the asymptotic stationary state (d)-(e). It is important to notice that these two final configurations, since they are time invariant, must necessarily consist of the same number of clusters (even if arranged in a different order) with the same people inside, otherwise they would be dynamically unstable.
| Group 1 (0.49) | Sciortino(0.49) |
| Group 2 (0.43) | Abe(0.49), Campa(0.42), Rajagopal(0.38), Tirnakli(0.28) |
| Group 3 (0.28) | Andronico(-0.28), Baldovin(0.34), Caruso(-0.20), Crucitti(0.21), |
| Latora(0.40), Pluchino(0.32), Rapisarda(0.34), Tadic(0.41), | |
| Beck(0.07), Cohen(0.40), Rizzo(0.08), Swinney(0.42) | |
| Group 4 (0.23) | Bukman(0.17), Indekeu(0.36), Widom(0.47), Stella(0.19), |
| Dawson(-0.07), A.R.Plastino(0.15), Mukamel(0.26) | |
| Group 5 (-0.08) | Barré(-0.07), Bouchet(0.01), Dauxois(0.28), Giansanti(-0.12), |
| Ruffo(-0.16), Yamaguchi(0.12) | |
| Group 6 (-0.17) | J.Andrade(-0.46), Coniglio(-0.11), Franzese(-0.32), Havlin(-0.04), |
| Herrmann(-0.21), Leyvraz(-0.37), Mantegna(0.21), Stanley(-0.21) | |
| Group 7 (-0.20) | Anteneodo(-0.20), Borland(-0.24), Gell-Mann(-0.23), |
| Tamarit(-0.40), Thurner(-0.30), Tsallis(-0.19), | |
| Hernandez-Saldana(-0.28),Majoral(-0.27), | |
| Moyano(-0.03), Robledo(-0.17) | |
| Group 8 (-0.48) | A.Plastino(-0.48) |
The interesting result of the simulation is that the clusters of panel (d)-(e) show
a good overlap with the real communities of the Tepoztlán network shown in Fig.2.
This can be verified comparing the groups’ structure of Table 1 with that one
reported in Table 2, representing the
final clusters configuration of the ocr plotted in panel (e).
In correspondence of each group in Table 2 the ocr value of the cluster is reported,
together with the ocr of each member of the cluster itself
(notice that the ocr of each cluster is rather close to the average
of the ’s of its members).
It is important to stress that people
in each final cluster, evidently due to the strong influence of the network topology on the
mutual interactions, manage to maintain synchronized opinions
despite their different natural inclinations (see panel (a)).
On the other hand, during the branching evolution people with similar
tend to merge together in the same cluster while people with very different
tend to escape from a given cluster (see panel (b)).
The competition between these two opposite effects can explain why some of the groups well distinct in Table 1, merge in Table 2 (e.g. G1-G2 or G3-G5),
why new groups come up (see Group 2 in Table 2)
and why agents with a very high absolute value of
run alone at the extremes of the ocr range.
Consequently the resulting modularity of the asymptotic clusters configuration shown in Table 2 ()
is smaller than the modularity of the ”real” configuration ().
We checked that even if the details of the simulation of Fig.3 change for different runs
with different random realizations of , and the final modularity can
vary too, the global picture described before remains qualitatively the same,
provided that the interaction strength would stay around .
For values noticeably higher or lower than the system, respectively,
either remains synchronized forever or quickly esplodes in very small clusters.
3.2 Evolution of the coauthorship groups in the opinion space
In this subsection we want to explore what happens if we start the system
with six different clusters of synchronized opinions corresponding to the six real communities
of the Tepoztlán network, in order to see how the OCR dynamics affects the stability of the groups.
Of course also in this case the details of the simulations will depend on the
initial distribution of the ’s.
But, again, we are mainly interested in studying the global picture emerging from
the dynamical competition between the different natural
ocr of the agents in each group and the opinion constraints imposed by the topology
of the network.
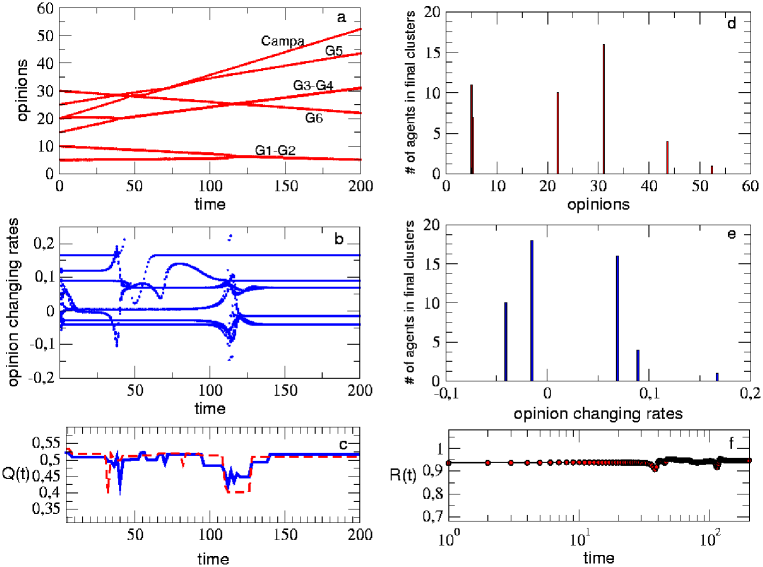
In the simulation shown in Fig.4 we set again .
Then we chose, for each one of the six groups of Table 1, a different initial opinion,
common for all its members, while the natural rates ’s were randomly selected in the range .
The initial opinion of each group is reported in Table 3.
Like in the previous section, in panels (a) and (b) of Fig.4 we show the time evolution of the
opinions and the opinion changing rates , while in panel (c) the respective modularities
are plotted. Finally, in panels (d) and (e), we show the asymptotic clusters configuration for
both the opinions and the ocr, and in panel (f) the time behavior of the order
parameter is reported.
| G1: x(0)=5 - | Bukman, Hernandez-Saldana, Indekeu, Majoral, Moyano, |
| Robledo, Widom | |
| G2: x(0)=10 - | Abe, Anteneodo, Borland, Gell-Mann,A.Plastino, A.R.Plastino, |
| Rajagopal, Tamarit, Thurner, Tirnakli, Tsallis | |
| G3: x(0)=15 - | Andronico, Baldovin, Caruso, Crucitti, Latora, Pluchino, |
| Rapisarda, Tadic | |
| G4: x(0)=20 - | Barré, Bouchet, Dauxois, Campa, Giansanti, Mukamel, Ruffo, |
| Stella, Yamaguchi | |
| G5: x(0)=25 - | Cohen, Beck, Rizzo, Swinney |
| G6: x(0)=30 - | J.Andrade, Coniglio, Dawson, Franzese, Havlin, |
| Herrmann, Leyvraz, Mantegna, Sciortino, Stanley |
| Group 1: | Bukman(0.07), Hernandez-Saldana(-0.11), Indekeu(0.15), |
| x(200)=5.05 | Majoral(-0.10), Moyano(-0.01), Robledo(-0.07), Widom(0.19), |
| Abe(0.20), Anteneodo(-0.08), Borland(-0.09), Gell-Mann(-0.09), | |
| A.Plastino(-0.19), A.R.Plastino(0.06), Rajagopal(0.15), | |
| Tamarit(-0.16), Thurner(-0.12), Tirnakli(0.11), Tsallis(-0.07) | |
| Group 2: | J.Andrade(-0.18), Coniglio(-0.05), Dawson(-0.03),Franzese(-0.13), |
| x(200)=21.95 | Havlin(-0.01), Herrmann(-0.08), Leyvraz(-0.14), Mantegna(0.08), |
| Sciortino(0.20), Stanley(-0.08) | |
| Group 3: | Andronico(-0.11), Baldovin(0.13), Caruso(-0.08), Crucitti(0.08), |
| x(200)=31.02 | Latora(0.16), Pluchino(0.12), Rapisarda(0.14), Tadic(0.17) |
| Barré(-0.02), Bouchet(0.00), Dauxois(0.11), Giansanti(-0.04), | |
| Mukamel(0.10), Ruffo(-0.06), Stella (0.07), Yamaguchi(0.05) | |
| Group 4: | Cohen(0.16), Beck(0.02), Rizzo(0.03), Swinney(0.17) |
| x(200)=43.54 | |
| Group 5: | Campa(0.16) |
| x(200)=52.33 |
Let us follow the time evolution of the opinion clusters in panel (a) of Fig.4 along 200 time steps.
One can see that groups G1 and G2 merge at , due to their initial position and
to their similar average ocr. Almost immediately a fast agent (Campa, with )
leaves the group G4 and goes ahead to its natural ocr,
resisting alone until the end of the simulation (see next Table 4).
Meanwhile, what remains of G4 merges with G3 at ,
and at the new resulting group survives to the collision with group G6,
already survived to previous superpositions with G5 and Campa around .
On the other hand, looking to panel (b), the opinion changing rates
follow a more pronounced branching evolution, where the agents rearrange their
ocr until a final stationary state is reached.
However, as previously stressed, the asymptotic configurations shown in panels (d) and (e)
must be the same.
Notice that the two main rearrangements in panel (b), around and ,
correspond to the main cluster collisions in panel (a) and also to the sudden falls
of modularity in panel (c).
In Table 4 we report the detailed composition of the
asymptotic opinion clusters of panel (d), together with their position in the opinion space.
Comparing it with the starting configuration of Table 3, we see that
the real groups of the Tepoztlán network are quite stable, at least for ,
despite the random choice of the natural changing rates of their members.
Apart from one agent of group G4, and apart from a couple of fusions (G1-G2 and G3-G4),
the structure of the groups seems to have been preserved by the dynamics,
surviving to various collisions in the opinion space.
This is confirmed by the final modularity , not much smaller then
the original one , and also by the constant behavior of the
order parameter in panel (f).
Changing the initial distribution of ocr, the evolution of the each member can change, but the qualitative behaviour is the same.
4 Conclusions
In this paper we have discussed opinion dynamics in a real social network, by considering the OCR model introduced in ref.[1]. In particular we have investigated a network of scientific coauthorship, inspired to Alberto Robledo’s collaborations. The results demonstrate that the topology of the network is a fundamental ingredient in the opinion dynamics and in the evolution of the composition of scientific groups. The use of the OCR model seems very promising for studying the dynamics of opinion formation. Further analysis with different kinds of networks are in order to draw more definitive conclusions.
5 Acknowledgements
We would like to dedicate this paper to Alberto Robledo, wishing him a long and very productive continuation of his brilliant academic career.
Two of us (A.P.) and (A.R.) would like to thank the organizers for the warm hospitality and the financial support.
References
- [1] A.Pluchino, V.Latora and A.Rapisarda Int. J. Mod. Phys. C, 16, No.4, 515-531 (2005)
- [2] L.D.Kiel, E.Elliot Chaos theory in the social sciences The University of Michigan Press (1996) L.Tesfatsion, Economic agents and markets as emergent phenomena, PNAS, vol.99 (2002) 7191-7192 J.M.Epstein and R.Axtell, Growing Artificial Societies (1996) MIT Press, Cambridge MA W.B.Arthur, S.N.Durlauf and D.A.Lane, The Economy as an Evolving Complex System II, Addison-Wesley, Reading, MA, vol. XXVII R. Axelrod, J. Conflict Resolut. 41, 203 (1997). S. Fortunato, On the Consensus Threshold for the Opinion Dynamics of Krause-Hegselmann, cond-mat/0408648 at www.arXiv.org, to appear in Int. J. Mod. Phys. C 16, issue 2 (2005).
- [3] In praise of soft science Editorial (2005), Nature, 435(7045), 1003.
- [4] R. Albert and A.-L. Barabási, Rev. Mod. Phys. 74, 47 (2002).
- [5] M.E.J. Newman, SIAM Review 45, 167 (2003).
- [6] S. Boccaletti, V. Latora, Y. Moreno, M. Chavez and D.-U. Hwang, Phys. Rep. 424, 175 (2006) and refs. therein.
- [7] D.Stauffer, Sociophysics Simulations (2003) in ’Computer Simulations’, Co-published by the IEEE CS and the AIP D.Stauffer, Sociophysics Simulations II: Opinion Dynamics (2005) arXiv:physics/0503115
- [8] R. Hegselmann and U. Krause, Journal of Artificial Societies and Social Simulation 5, issue 3, paper 2 (jasss.soc.surrey.ac.uk) (2002).
- [9] K. Sznajd-Weron and J. Sznajd, Int. J. Mod. Phys. C 11, 1157 (2000). G. Deffuant, D. Neau, F. Amblard and G. Weisbuch, Adv. Complex Syst. 3, 87 (2000). S. Galam, Physica A 336 (2004) 49 and refs. therein.
- [10] E. Ben-Naim, P. Krapivsky and S. Redner, Physica D 183, 190 (2003).
- [11] A.T.Bernardes, D.Stauffer and J.Kertész, Eur.Phys.J. B 25, 123-127 (2002) M.C.Gonzales,A.O.Sousa and H.J.Herrmann, Int. J. Mod. Phys. C, 15, No.1, 1-13 (2004) D.Stauffer, Montecarlo simulations of the Sznajd model, J.of Artificial Societies and Social Simulations (2002) vol.5, no.1
- [12] S.Fortunato, V.Latora, A.Pluchino and A.Rapisarda International Journal of Modern Physics C 16, 1535 (2005) and A. Pluchino, V.Latora, A. Rapisarda, Eur. Phys. Journ. B 50 (2006) 169.
- [13] S. Boccaletti, J. Kurths, D.L. Valladares, G. Osipov and C.S. Zhou, Phys. Rep. 366, 1 (2002).
- [14] Y. Kuramoto, in it International Symposium on Mathematical Problems in Theoretical Physics, Vol. 39 of Lecture Notes in Physics, edited by H. Araki (Springer-Verlag, Berlin, 1975).
- [15] Y. Kuramoto, Chemical Oscillations, Waves, and Turbulence (Springer, Berlin, 1984).
- [16] S. H Strogatz, Physica D, 143 1 (2000).
- [17] M. Girvan and M. E. J. Newman, Proc. Natl. Acad. Sci. USA 99, 7821 (2002). M.E.J. Newman and M. Girvan Phys. Rev. E, 69, 026113 (2004).