Equilibrium study of Protein/DNA Complexes from Crystal Structure Data
Abstract
From the crystal structure data and using the concept of equilbrium statistical mechanics we show how to calculate the thermodynamics of protein/DNA complexes. We apply the method to the TATA-box binding protein (TBP)/TATA sequence complex. We have estimated the change in free energy and entropy for each of the base pair (bp). The local rigidity of the DNA is estimated from the curvature of the free energy. We also estimate the free energy gain of the protein due to bond formation with a particular bp. We thus figure out the bps responsible for specific binding.
pacs:
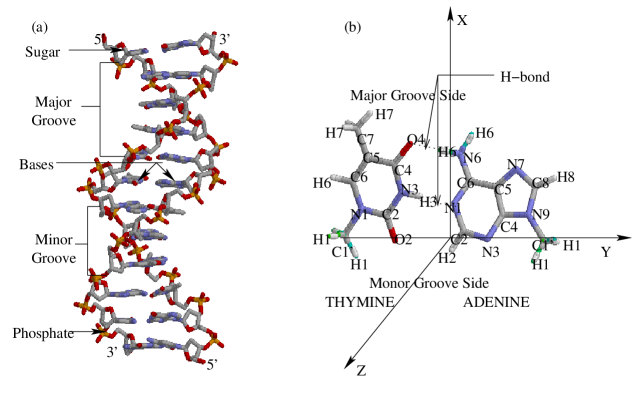
82.39.Pj, 87.15. Rn, 87.15.-vAll the cellular processes in life are controlled by two biopolymers, namely, protein and nucleic acid along with many smaller molecules like lipid, carbohydrate, water etc. via their specific and non-specific interactions. The aminoacids form the primary structure of a protein moleculecell . On the other hand, the strutural unit of an antiparallel double helical deoxiribo nucleic acid (DNA) moleculecell ; caladine , as shown in Fig. 1(a), is the nucleotides consisting of 5-carbon neutral sugar (deoxyribose), nitrogen-containing purine (adenine, A and guanine, G) or pyriminine (thymine, T and cytosine, C) hydrophobic bases attached to the sugar, the former in turn attached to a negatively charged phosphate group. The Watson-Crick base pairs (bp), namely A with T and G with C, remain at the core of the double helix with strong inter-basepair stacking, while the phosphates line up the periphery. Functional groups of the bases (amino, imino or keto) capable to form hydrogen bonds (H-bond) with functionally important protein molecules, are exposed towards the solvent within the two grooves: major or minor as shown in Fig. 1(b).
The protein synthesis in an organism is controlled via gene expressioncell . It consists of two parts: (i) transcription, the synthesis of ribo nucleic acid (RNA) from DNA and (ii) translation, the synthesis of protein from RNA. For initiation of transcription, a transcription factor comprising a class of protein including RNA polymerase needs to bind to the specific site of DNA (promoter) that encodes for the given protein (gene). Obviously, one major thrust in biochemical research aims at understanding protein/DNA interaction. Some of the issues of immense biochemical importance are: (i)Energetics involved in the complex formation; (ii) time scale related to different degrees of freedom of DNA bp in the complex formation; (iii) kinetics of binding. Apart from pedagogical interest, these issues are extremly important application in drug designing, macromolecule recognition etc.
In this paper we show how the x-ray crystal structure data can be utilized to understand the thermodynamics of protein/DNA complex at the level of bp, using the fundamental concepts of equilbrium statistical mechanics. We have build up from the crystallographic data both for complexed and the free state, the free-energy of deformation in six degrees of freedom of a bp in a given DNA sequence, treating the bp as a rigid plane. We can thus estimate the change in free energy of the -th bp upon the complex formation. We further identify from the crystallographic data the H-bonded atoms of a given protein residue with the given bp and estimate the energy of binding which is essentially the free energy gain upon complexation, if the complex formation is energy dominated, especially at low temperatures. One can thereby estimate the free energy gain of the protein, upon complexation at the -th bp by accounting for the accompanied ion and water release. sheds some light on the time scale of DNA bp dynamics within the elastic approximation. We apply this analysis to the particular complex of TBP/TATA sequence DNA. The TBP/TATA box complex is one of the most important and well studied protein/DNA complex jmb1996 ; Biophysical 1998 ; jmb2001-16 ; NAR-2006 ; ref1-jmb-01 . Crystal structures of TBP/TATA box show that TBP binds through minor groove to severly deformedkim consensus TATA sequence, namely, TATA(T/A)A(T/A)N, where the bases in one of the strands have been indicated, (T/A) being either thymine or adenine and N any of the four bases. The functional groups in the minor groove are incapable to provide enough discriminatory H-bond partners to TBP for specific binding. An indirect mode of recognition has been proposed to explain TBP/TATA sequence specific binding. Here the DNA becomes structurally rigid in severely deformed conformation that allows the TBP to form adequate H-bonds. However, it has been found from the previous bioinformatics study that DNA becomes more flexible upon protein binding olson-PNAS . Our analysis on TBP/TATA box complex sheds some light on this specific binding mode which is of profound biological interest.
We have taken structures of the available TBP/TATA-sequence complexes solved by x-ray crystallography at a resolution better than 2.5 from the Protein Data Bank (PDB)PDB footnote1 . The temperature of the selected complexes is in the range K and the pH ranges within . We have taken all such TBP/TATA sequence complexes as independent data set. For all the selected complexes TBP binds to a ten bp highly conserved (%) DNA CTATAAAAGG sequence in one strand ( to ) along with the normal Watson-Crick base pairing in the opposite strand. We have taken two consecutive bps in to direction and construct a mean axis system with respect to which the bp geometrical parameters are definedNUPARM . We define base normal, , as the vector normal to mean bp plane defined by all ring atoms of the -th base, obtained from the coordinate of different atoms listed in the PDB files. We further take the bp normal, , as the mean of of two paired bases, normalized to unit vector. The bp long axis, , is the vector along the line joining atoms of the bps, as shown in Fig. 1(b). The bp short axis, is the vector normal to both and and pointing towards the major groove side of the bp. The base-base vector, , is the vector joining the centers of two consecutive bps and mean doublet z-axis, . The bp parameters have been calculated using the relations: Tilt, ; roll, ; twist, ; Shift, ; Slide, and Rise, .
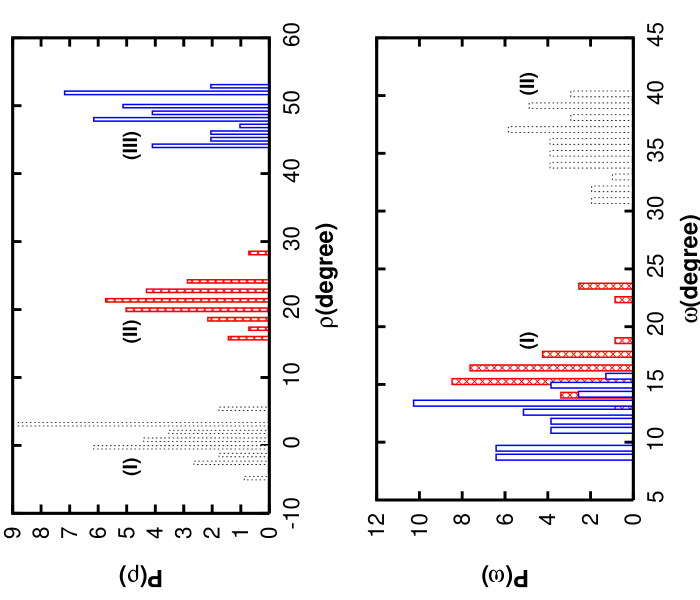
We generate histogram for each of the local parameters of the TATA sequence DNA complexed with TBP. Fig.2(a) shows typical histogram for . There are three distinct sets of histogram: Set I shows the data for the first bp, set II shows data for the fifth bp and set III shows that for the second bp. In set I, the mean value of lies within the range which is similar to that known in the free casefree . So bps in set I has almost no roll deformation due to complexation. On the other hand in set III, where the mean value of is within , exhibits the maximum deformation due to complexation. The mean value of in set II lies within . Fig. 2(b) shows the histograms, for . Here the mean value of for the first bp is , comparable to mean in the free casefree . The mean value of corresponding to the second and the sixth bp are and respectively, exhibiting large deformation in . The histogram for the corresponding to all bp have the mean values similar to the known tilt value in free case ()free , having insignificant effect of complexation.
We further find the atoms of the protein residues forming H-bonds to the bases in a given bp along with the sugar ring and the phosphate groups attached onto it. Here H-bond analysis has been done with the help of pyrHBfind softwarepyrhb . The binding region is primarily located between the fourth and the seventh bp. There are direct H-bonding at the fifth and the sixth bp between base and amino acid residues, asparagine and tryptophan. Fig. 3(a) shows the probability of finding H-bonds through sugar, phosphate and base in the vicinity of the -th bp. Maximum number of H-bonding, three with the bases, two with the phosphate oxygen and one with the sugar, is observed at the vicinity of fifth bp. There is a substantial number of H-bonding through the sixth bp as well. Binding through sugar dominate the between fifth to seventh bp, the maximum being at the sixth bp. The correlation between the deformation of DNA and the binding pattern is better revealed from the inset of Fig. 3(a), where the H-bonding energy footnote2 between the bound part of the bp and the protein residue, is plotted against bp. We find that the classical electrostatic part has dominant contribution to in all the cases. has a funnel structure between the third and the seventh bps, having a minimum kcal/mole at the fifth bp. At the seventh bp, where protein residues do not directly interact with the base but interact with the backbone, is relatively small, kcal/mole. Similarly, at the second and the nineth bp where the phosphate oxygen interacts with polar amino acid residues is kcal/mole. Thus the base binding contributes an energy kcal/mole at the fifth and the sixth bps. This additional energy can be defined as that due to the specificity of the base binding, the specificity being larger at the fifth bp. Note that the binding process makes the bps energetically inhomogeneous which is particularly remarkable for the fifth, sixth and the seventh bp, each of them being A. The data corroborates to the deformation data in Figs 2(a) and (b), namely, the and the data group together for the bps in the region of stronger binding. and for the second and the eighth bp are distinct from the others, despite having relatively weaker . has weak local minima at these bps. This indicate that the protein binding may initiate at these two metastable points, having strong mechanical deformation.
We calculate the free energy of deformation per complex at the -th bp, , where denotes any of the six bp parameter, , being the Boltzmann constant and T the temperature. Fig. 3(b) shows for roll of the fifth, sixth and the seventh bp. has a minimum having a fair degree of harmonicity, typical for an elastic degree of freedomchaikin , with deviations only for values far away from the minimum. We find similar trend in all other free energy profiles. The curvature of the free energy at the minimum is a measure of the local rigidity corresponding to the bp parameter. The inset of Fig. 3(b) shows the curvature at different bp for the rotational parameters, , . The data show large local rigidity for the bp with large . One can estimate the frequency of small oscillations about the equilibirum from the curvature data by having the moment of inertia of a bp with respect to the relevant axis of rotation. The time period corresponding to the rotational parmeter ranges between 30-50 ps which is comparable to solvation time scale of water molecules in the vicinity of protein/DNA complexskpal .

We also estimate and . To this end we selected the fifth and the sixth bp, where the base binding gives specific stability to the complex. We compare the results to these of the seventh bp, having no H-bonding with base and the free bp doubletfootnote3 . Fig. 3(b) shows the free energy for the free case as well. The second column of Table 1 shows that the change in curvature, in , compared to the free case, is largest at the fifth bp. The difference in free energy minima between the complex and the free case gives for bp parameter so that . The third column of Table I shows for and . We find that for all , indicating that after complexation the DNA goes to a thermodynamically more favoured state. The fourth column of Table I shows the loss of entropy of DNA estimated within the harmonic approximation. The dependence in the entropy loss indicates that different amount of heat generated as the H-bonds are formed at different bp in the complex. The free energy gain upon complexation at the -th bp is given by: , where and are the free energy cost for water and ion released respectively upon bond formation at the -th bp. We take for low temperature , ignoring the entropy effects due to the bond vibrations. However, the water and the ion releases are entropy driven processes. When TBP binds to the TATA sequence 19 water molecules are released from the interfacial sufracewater-release . We find that seven phosphate groups in the TATA sequence are neutralized by seven positively charged amino acid residues. So we expect that upon complex formation on an average 14 ions are released from the interfecial suface. The entropy gain () due to the displaced ions and water molecules is estimated to be footnote4 . Thus can be estimated and shown in the last column of Table I where we observe that the free energy gain by the protein is maximum at the fifth bp. We thus find that the change in curvature and the maximum gain in thermodynamic free energy of different components in the TBP/TATA sequence complex are strongly correlated. The metastable complex through binding at the second and the eighth bp is stabilized by enhanced base binding at locally more rigid fifth bp. This mechanism holds the key to the indirect recognition of the TBP/TATA sequence complex. Earlier attempt olson-PNAS might have missed enhanced local rigidity by taking average over all protein/DNA complexes.
| Fifth | -0.23 | 0.0025 | -5.7 | -48.9 |
| Sixth | -0.25 | 0.0021 | -5.47 | -41.26 |
| Seventh | -0.23 | 0.0003 | -4.77 | -17.12 |
In summary we show here an approach based on the equilibrium statistical mechanics how crystal strucrure data is used to obtain the bp-wise stability of a protein/DNA complex. Our analysis shows that the maximum specificity of the TBP/TATA sequence complex comes from H-bonding with the fifth bp where the changes in the rigidity are the maximum, though the binding may proceed from the second and the eigthth bp. Even though our analysis has been in the crytal phase, recent studies indicate that the enzymatic properties of protein and nucleic acids remain intact in the crystal phasebanetal . Hence, our predictions should hold even for TBP/TATA complex in the solution phase, pertinent to the in-vivo situations. Our predictions may be verified by single molecule experiments where the H-bond forming abilty of different bp of the TATA-box sequence can be selectively altered by thio-substitution. We would point out that our analysis is quite general and can be applied to any protein/Nucleic acid complex. We shall report such detailed analysis in future publications.
Acknowledgements.
SS thanks the CSIR for financial support.References
- (1) B. Alberts et al., Mol. Biol. of The Cell (Garland Science, 2002).
- (2) C. R. Calladine et al., Understanding DNA (Elsevier, 2004).
- (3) Z. S. Juo et al., J. Mol. Biol. 261, 239 (1996).
- (4) L. Pardo et al., Biophys. J. 75, 2411, (1998).
- (5) A. H. Elcock and J. A. McCammon, J. Am. Chem. Soc. 118, 3787, (1996).
- (6) H. Faiger et al., Nucleic Acids Res. 34, 104, (2006).
- (7) G. Guzikevich-Guerstein and Z. Shakked, Nature Struct. Biol. 3, 32,(1996).
- (8) J. L. Kim et al., Nature. 365, 520 (1993).
- (9) W. K. Olson et al. Proc. Natl. Acad. Sci. USA 95, 11163, (1998).
- (10) H. M. Berman et al. Nucleic Acids Res. 28, 235, (2000)
- (11) The PDB identifires of the selected complexes are 1qn3, 1qn4, 1qn5, 1qn6, 1qn7, 1qn8, 1qn9, 1qna, 1qnb, 1qnc, 1c9b, 1cdw, 1jfi, 1ngm, 1nvp, 1tgh, 1vol, 1ytb.
- (12) D. Bhattachryya and M. Bansal, J. Biomol. Struct. Dynam. 8, 539, (1990).
- (13)
- (14) S. Mukherjee et al. J. Phys. Chem. B 109, 10484, (2005).
- (15) For ab Initio quantum chemical calculation we use the GAMESS software. The hydrogen atomic position of each of the case then optimized with HF/6-31G(2p,2d) basis sets, by freezing the heavy atoms. The electrostatic part of the interaction energy is divided by dielectric constant between protein-DNA interfaces (4.0).
- (16) P. M. Chaikin and T. C. Lubensky, Principles of Condensed matter Physics (Cambridge, 1998).
- (17) A. H. Zewail et al. Proc. Natl. Acad. Sci. USA 100, 13746, (2003).
- (18) The PDB identifires of the selected complexes are 1en3, 1en8, 1fq2, 1hq7, 1ikk, 1ilc, 1jgr, 1lp7, 1n4e, 1s23, 307d.
- (19) S. Khrapunov and M. Bernowitz, Biophys. J. 86, 371, (2004).
- (20) P. Nissen et al. Science, 289, 920 (2000).
- (21) Entropy of the ion and water estimated via , where is the density of ion/water around DNA density , is the bulk ion/water density and N is the number of ion/water released.
- (22) T. V. Chalikian (et al.) Biophys. Chem. 51, 89, (1994).