A simple model of reactor cores for reactor neutrino flux calculations for the KamLAND experiment
Abstract
KamLAND is a reactor neutrino oscillation experiment with a very long baseline. This experiment successfully measured oscillation phenomena of reactor antineutrinos coming mainly from 53 reactors in Japan. In order to extract the results, it is necessary to accurately calculate time-dependent antineutrino spectra from all the reactors. A simple model of reactor cores and code implementing it were developed for this purpose. This paper describes the model of the reactor cores used in the KamLAND reactor analysis.
keywords:
Neutrino oscillation , Reactor antineutrino , Fission rate calculation , Nuclear fuel , KamLANDPACS:
14.60.Pq , 28.41.Ak , 28.50.Hw, , , , , , , and
1 Introduction
The KamLAND (Kamioka Liquid Scintillator Anti-Neutrino Detector) experiment [1] is a reactor neutrino oscillation experiment with a very long baseline. The experiment detects low energy antineutrinos (’s) coming from a number of reactors at a typical distance of 180 km away from the detector. KamLAND showed evidence for reactor disappearance in 2003 [2], and evidence for the distortion of the energy spectrum, which is consistent with neutrino oscillation, in 2005 [3]. In order to extract the oscillation signal, the KamLAND experiment compares the observed and expected energy spectra. Due to the effect of neutrino oscillation, the energy spectrum changes as follows in the two-neutrino mixing case,
| (1) |
where is the energy, is the energy spectrum in the absence of neutrino oscillation and is the expected energy spectrum with neutrino oscillation. is the difference of the squared neutrino masses, , and is the distance between the detector and the source. The oscillation parameters, and , are determined from the frequency and amplitude of this change. The time dependence of the number of ’s per unit power generation changes as much as 10% because the components of nuclear fuel change during the burnup. It is therefore necessary to trace the burnup effect for each reactor. However, for the case of KamLAND, there are many reactors that contribute events and it is practically impossible to calculate the burnup effect using a detailed simulation for all the reactors. This paper describes a simple reactor model with which to accurately calculate the spectrum of each reactor using the routinely recorded reactor operation parameters. The parameters include the time-dependent thermal output, burnup, and enrichment of exchanged fuel and its volume ratio.
2 Antineutrino generation in reactors
2.1 Expected reactor antineutrino spectrum
Nuclear reactors are rich sources. The fission products are generally neutron rich nuclei and undergo successive -decays, each yielding one . About 6 ’s are produced per fission along with an average energy release of MeV. A typical reactor operating at 3 GW thermal output produces ’s per second. At the same time, nuclear transmutation through neutron absorption and beta decays of the fuel elements changes the composition of the nuclear fuel. In particular, plutonium is created due to neutron capture by . The plutonium production scheme is shown below. The produced 239Pu and 240Pu are also fissile isotopes and contribute to the power and generation;
The four main isotopes, , , and , contribute more than 99.9% of the total power generation. Contributions from other elements can be safely ignored. The component of nuclear fuel changes as a function of “burnup”, which is defined as the time integrated thermal output per initial nuclear fuel mass ,
| (2) |
The commonly used unit is giga-wattday/ton. The burnup is a basic parameter which indicates the condition of nuclear fuel. For constant thermal output operation, the burnup is proportional to the operation time. Typical nuclear fuel resides in the reactor core for 3-5 years and total thermal output is designed to be 30 MW/t. Therefore, at the end of about one year of each operation cycle, incremental burnup from the beginning of cycle (BOC) reaches approximately 10 GWd/t.
The production rate of reactor ’s is obtained from the fission rates and the energy spectra per fission. In the KamLAND data analysis, we compare the experimental data with the expected neutrino flux of a superposition of all the reactor cores in the integral live time period of the detector. The energy spectrum of the expected reactor flux is written as,
| (3) |
where is the energy spectrum per fission of each fissile isotope, is the distance from the reactor to KamLAND, is the oscillation probability, and is the time-dependent fission rate of each isotope in each reactor.
2.2 Antineutrino detection
The KamLAND detector consists of 1 kton of liquid scintillator surrounded by 1879 17/20-inch-diameter photomultiplier tubes. In the liquid scintillator, ’s are detected through the inverse -decay reaction with protons,
| (4) |
The cross section is closely related to the neutron lifetime and known with 0.2% accuracy [4]. The energy threshold of this reaction is 1.8 MeV and the ’s produced in the -decays of and in nuclear fuel do not contribute to the reaction. The positron and its annihilation gammas produce scintillation light which is proportional to . The visible energy spectrum can be written as,
| (5) |
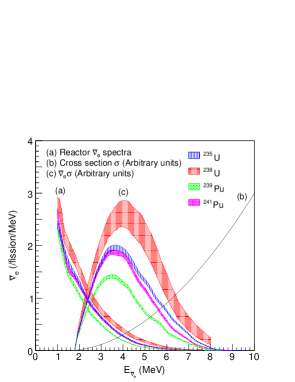
where is the number of target protons in the detector and is the inverse -decay cross section. Fig. 1 shows the neutrino energy spectrum of each fissile isotope, the inverse -decay cross section, and the produced visible energy spectra in the detector.
| Isotopes | ||||
|---|---|---|---|---|
| 1 | 1.52 | 0.60 | 0.87 | |
| 0.56 | 0.08 | 0.30 | 0.06 | |
| 0.61 | 0.13 | 0.20 | 0.06 | |
Above the 3.4 MeV energy KamLAND analysis threshold, the comparisons of the observed no-oscillation ’s are listed in Table 1. There are significant differences in the number of detected ’s per fission. This means that the spectrum depends on the fuel component and burnup. The number of observed events from a typical reactor core decreases by from the BOC to . Thus when calculating the flux, it is necessary to know the dependence of the fuel components on the burnup. The contributions of the isotopes to the total number of fission rates in a typical reactor core are also listed in Table 1. It must be noted that although generates a larger number of neutrinos per fission, the contribution to the number of observed events is only . The shaded regions of the neutrino spectra shown in Fig. 1 indicate the uncertainty in the spectra. Accordingly, the uncertainty in the total number of observed ’s above the 3.4 MeV energy threshold is 2.5%.
2.3 Commercial reactors in Japan
During the measurement period of KamLAND in Ref. [3] (from 9 March 2002 to 11 January 2004), 52 commercial reactors in 16 electric power stations and a prototype reactor operated in Japan. All Japanese commercial reactors are light water reactors (LWRs), 29 are boiling water reactors (BWRs) and 23 are pressurized water reactors (PWRs). Both types of LWRs use 3-5% enriched uranium fuel. Generally, reactor operation stops once a year for refueling and regular maintenance. During the refueling, one fourth of the total nuclear fuel is exchanged in BWRs and one third in PWRs.
To calculate production rates of reactor ’s, knowledge of the correlation between the “core thermal output” and the fission rates is required. The core thermal output is defined as the thermal energy generated in the reactor cores, and it is calculated by measuring the heat balance of the reactor cores. The heat taken out by the cooling water, , is the dominant dissipation source of the reactor energy. Other contributions are less than 1%. Therefore, the uncertainty of the calculated core thermal output is dominated by the accuracy of measuring which itself is dominated by the accuracy of measuring the flow of the coolant. The accuracy of the flow of the coolant in turn is determined by the uncertainty of the feedwater flowmeters, which are calibrated to within 2%. In the KamLAND experiment, a value of 2% is used as the uncertainty of the core thermal output.
All Japanese reactors have a contribution of more than % to the total reactor flux at the location of KamLAND and about half of reactors contribute between 1% and 7%. Therefore, to accurately calculate the total flux in the KamLAND experiment, it is required to trace the time variation of the fission rate of all the reactors. To calculate , it is necessary to understand the burnup process of nuclear fuel. The process of burnup is complicated and depends on the type of core, history of the burnup, initial enrichment, fuel exchange history, etc. Detailed simulations exist that calculate the change of the fuel components in accordance with the burnup. The simulation uses the “reactor core analysis method”, which traces the burnup effect of the three-dimensional fuel component in the reactor core. Ideally, it is desirable to perform the simulation for all the reactor cores. However, it is practically impossible to perform such a detailed simulation for all the commercial reactors, because it is very labor intensive. Based on the above circumstances, we have developed a simple core modeling scheme and calculation code which can be used to calculate easily without reducing accuracy. We required that the discrepancy of the energy spectrum from our simplified model be less than 1% from the detailed method. In our model, the burnup effect of the fission rate of each fissile isotope in the entire core is approximated phenomenologically using reactor operation parameters of the nuclear reactor and calculated based on a reference reactor core. All of these parameters have been recorded regularly by the nuclear power station, so we can use them to calculate the fission rates without requiring additional effort from the electric power company. The details of this method are described in the next section.
3 Fission rate calculation
3.1 Reactor core analysis
| Core number | Core type | Cycle number | ||
| 1 | BWR | 1 | 2.2 | 100 |
| 2 | 3.0 | 40 | ||
| After 3 | 3.0 | 25 | ||
| 2 | BWR | 1 | 2.2 | 100 |
| 2 | 3.4 | 25 | ||
| After 3 | 3.4 | 29 | ||
| 3 | BWR | 1 | 2.5 | 100 |
| 2 | 3.4 | 28 | ||
| After 3 | 3.4 | 26 | ||
| 3.4 | 28 | |||
| 3.4 | 29 | |||
| 3.7 | 26 | |||
| 4 | BWR | After 3 | 3.7 | 26 |
| 5 | BWR | After 3 | 3.4 | 23 |
| 3.4 | 28 | |||
| 6 | PWR | 1 | 2.2 | 100 |
| 2 | 3.5 | 33 | ||
| After 3 | 3.5 | 33 |
To study the burnup effect of the fission rate in nuclear fuel, sample reactor cores under actual operating conditions listed in Table 2 were analyzed with the detailed core simulation. These reactor cores were selected to represent typical reactor cores in Japan and the target nuclear fuel was chosen to represent typical uranium based nuclear fuel including the initial reactor operation periods. This analysis used the Core Management System (CMS) codes from Studsvik of America, CASMO[6]/SIMULATE[7]. This system performs core calculations by combining “two-dimensional multi-group fuel-assembly” analysis and “three-dimensional few-group full core” analysis. These codes have been extensively compared with measurements. The comparison [8] of the calculated isotopic concentrations provided by the CMS codes with experiments was carried out for the spent nuclear fuel discharged from a BWR type reactor core in Japan. The fuel pin averaged discrepancies between calculated and measured isotopic concentrations are less than 7% for the four main fissile isotopes. According to the contributions of the fissile isotopes to the number of observed ’s from a typical reactor core listed in Table 1, these discrepancies of the isotopic concentrations correspond to less than of the number of observed ’s per unit energy release.
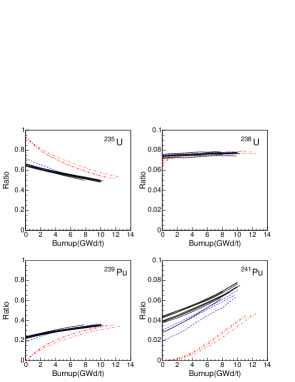
The results of calculations of the burnup effect on the relative fission rate of each fissile isotope in the BWR type reactors listed in Table 2 are shown in Fig. 2. Hereafter, burnup will be defined as the incremental burnup from the BOC. From Fig. 2, it is clear that the dependence of burnup can be classified in two groups: reactors in their initial fuel cycle, right after commissioning, and reactors in their second and higher fuel cycle. Reactor cores in the initial operation period, which starts without plutonium, are called “Initial cores”. In the initial core, the fission rates of increase rapidly from zero after the BOC, and fission rates of increase gradually following . After a few fuel exchanges, the burnup effect in a particular operation period is independent of the fuel cycle. This is called “Equilibrium core”. Because the burnup effect is large in initial cores and small in equilibrium cores, the dependence of the burnup effect on the nuclear fuel parameters is calculated separately for the two cases.
3.2 Initial cores
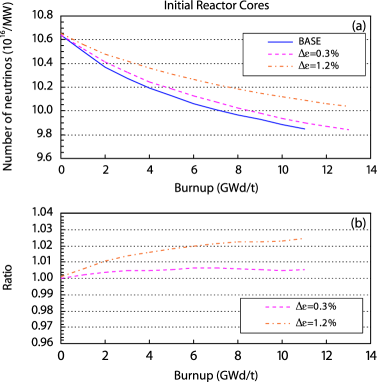
The burnup dependence of the number of reactor ’s between 1.0 MeV and 8.5 MeV energy produced in typical initial reactor cores is shown in Fig. 3. To extract the dependence on the enrichment, a core with a high enrichment of 3.4% is included in this comparison. As shown in Fig. 3, the number of neutrinos decreases with the burnup because of variation of the fuel components. In highly enriched fuel, the speed of the decrease is slow. It can be explained by the fact that in highly enriched fuel has a larger contribution to the total fission rate. Therefore the enrichment dependence of the burnup effect can be represented by transforming the burnup effect in a specific nuclear fuel.
To study the effect of fuel enrichment, we vary to first order, substituting , the number of generated ’s can be written as
| (6) |
where is the burnup and
| (7) |
If we know the value of , the number of ’s can be estimated using a function of burnup for a reference value of enrichment, . Here, the normalization factor of the burnup, , is defined as,
| (8) |
Fig. 4 shows values of in typical reactor cores based on the burnup effect in Fig. 3. The factor is approximately constant with respect to the burnup over the complete fuel cycle (Fig. 4(a)) and can be represented by a linear function of the new fuel enrichment (Fig. 4(b)). In other words, can be considered to be constant, and the number of ’s is approximated as
| (9) |
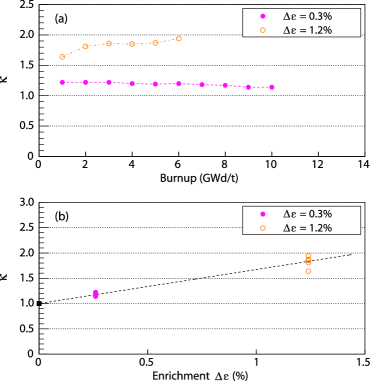
In the present work, the value of is determined by the burnup at the end of cycle (). The parameters for the actual reactor conditions were obtained using the detailed core simulation, and for the BWR () and PWR () cores, respectively.
This simplified reactor core model has so far only been used to calculate the number of ’s. However, the neutrino oscillation experiment requires the energy spectrum. The burnup effect on the energy spectrum reflects variation of the composition of the fissile isotopes. We assume for the simple core model that the fission rates of all fissile isotopes have the same burnup effect as when calculating the number of ’s. The model assigns the same corrections for the new fuel enrichment to the burnup effect to the fission rates. The accuracy of this treatment is estimated in a later sub-section by comparing the results from our model to the detailed core simulation. The systematic uncertainty of the energy spectrum is also described there.
3.3 Equilibrium cores
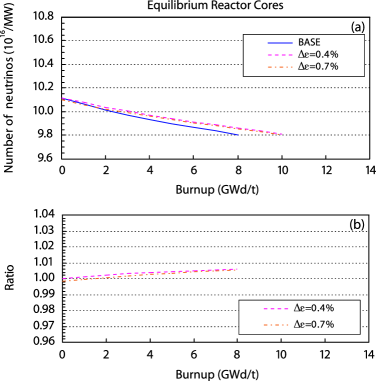
The burnup dependence of the number of reactor ’s in typical equilibrium cores with exchanged fuel volume ratio of approximately 25% is shown in Fig. 5. The relative differences of the number of ’s are already less than 1% over the complete fuel cycle. To account for the influence of the new fuel, we apply the methodology of the fission rate calculation for the initial core to the equilibrium core. Nuclear fuel in equilibrium cores contains both new and old fuel. The arrangement of new and old nuclear fuel rods is adjusted to burnup equally in the reactor core. We treat the fission rate uniformly throughout the core. Under the assumption that the fission rates of these two components do not have locational dependence, the complete fission rate as a function of the burnup of in an equilibrium core with the exchanged fuel volume ratio and the new fuel enrichment is represented as a combination of the fission rate of the new fuel and of the rest
| (10) | ||||
where is the estimated fission rate in the initial core with the fuel enrichment of based on the reference initial core, and is the estimated fission rate in the equilibrium core with the exchanged fuel volume ratio and the new fuel enrichment based on the reference equilibrium core. Similarly to the initial core calculation, is obtained by linear approximation of the burnup effect in a reference equilibrium core. The values of are and for the BWR () and PWR () cores, respectively.
In addition to the above approximation, accumulation of fissile isotopes produced by neutron absorption, particularly produced from the U-Pu chain, depends on the averaged absolute burnup of nuclear fuel at the BOC. Correction to the fission rate of each isotope is performed as an additional contribution using the averaged absolute burnup at the BOC,
| (11) |
where is the fission rate of each isotope for the incremental burnup from the BOC, . The correction term is defined as
| (12) |
where is the correction factor for each fissile isotope and is the averaged absolute burnup at the BOC in the reference equilibrium core. In actual reactor cores, the averaged absolute burnup at the BOC is limited to . The effect of this correction to the fission rate is for all fission isotopes except for in BWRs, for which the fission rate is corrected by .
3.4 Systematic uncertainties
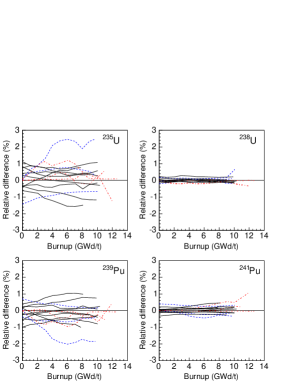
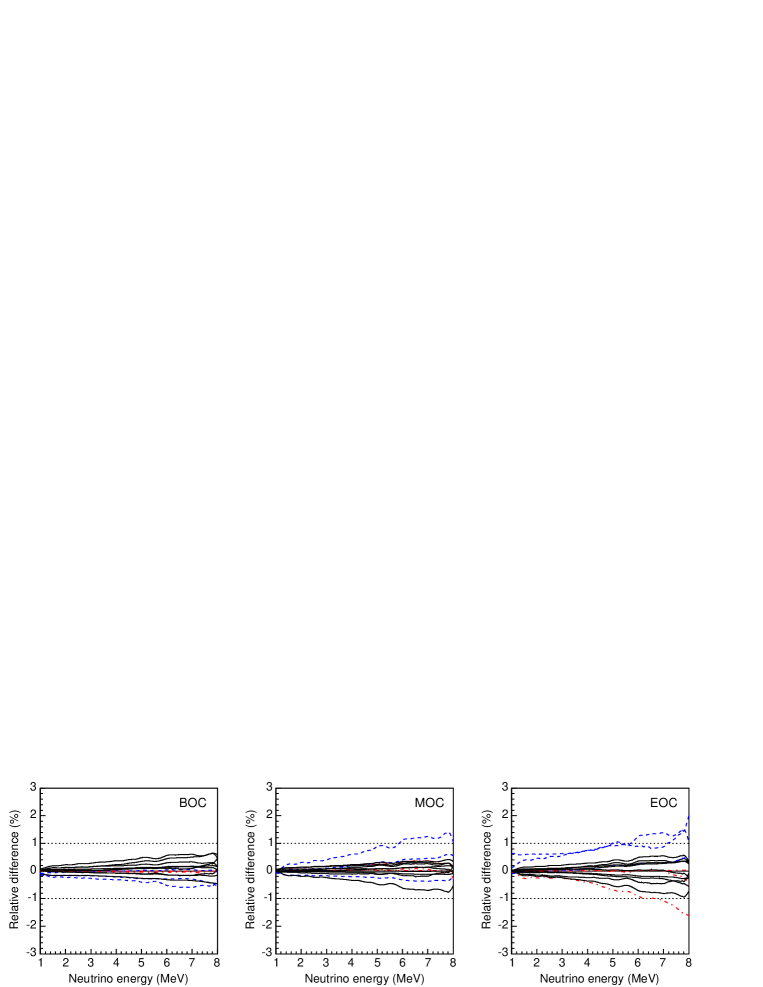
To estimate the accuracy of our simplified calculation method, we compare our calculations with the detailed reactor core analysis performed using parameters from commercial reactors listed in Table 2. The relative differences in the calculated fission rates of each fissile isotopes in BWR type reactors are shown in Fig. 6. In this figure, the difference is defined as . The difference of the detailed method and simple method is less than 3%. At the same time, the relative differences in the energy spectra for different values of burnup in BWR type reactors are shown in Fig. 7. The energy spectrum in the equilibrium cores agrees with the detailed method within 1%. Because the fission rate of each isotope per unit energy generated is balanced between the isotopes, differences in the energy spectrum are suppressed. The discrepancies are large in the high energy region in a initial cycle core and second cycle cores. The maximum discrepancy is 2.0% in a second cycle core. However, due to the large number of existing Japanese reactors, the contribution from second cycle cores is small at the KamLAND experiment and can be neglected. The reactor flux calculation is well performed with an accuracy of 1% in the number of observed ’s in all reactor cores, which is smaller than the uncertainty of the spectra and the reactor core thermal output.
4 Summary
To calculate flux, reactor cores can be successfully modeled using only a few reactor operation parameters. The results of our simplified reactor model agree with detailed reactor core simulations within 1% for different reactor types and burnup. This error is taken into account in the KamLAND reactor neutrino analysis. The simplified model may be applicable to future long-baseline reactor neutrino experiments which make use of several reactors.
5 Acknowledgements
The authors would like to thank M. P. Decowski for helpful discussions on this paper. This work was supported by the Center of Excellence program of the Japanese Ministry of Education, Culture, Sports, Science and Technology. The authors gratefully acknowledge the funding support.
References
- [1] KamLAND Collaboration, A. Suzuki et al., in Proceedings of the 7th Euromicro Workshop on Parallel and Distributed Processing, Funchal, Portugal, 1999 [Nucl. Phys. (Proc. Suppl.) B77, 171 (1999)]; http://www.awa.tohoku.ac.jp/KamLAND/.
- [2] KamLAND Collaboration, K. Eguchi et al., Phys. Rev. Lett. 90, 021802 (2003).
- [3] KamLAND Collaboration, T. Araki et al., Phys. Rev. Lett. 94, 081801 (2005).
- [4] P. Vogel and J. F. Beacom, Phys. Rev. D 60, 053003 (1999); A. Kurylov et al., Phys. Rev. C 67, 035502 (2003).
- [5] : K. Schreckenbach et al., Phys. Lett. B 160, 325 (1985); : A. A. Hahn et al., Phys. Lett. B 218, 365 (1989); : P. Vogel et al., Phys. Rev. C 24, 1543 (1981).
- [6] M. Edenius, K. Ekberg, B. H. Forssen, D. Knott, CASMO-4 - A Fuel Assembly Burnup Program - User’s Manual. Studsvik Report. Studsvik of America (1993).
- [7] J. A. Umbarger, A. S. Digiovine, SIMULATE-3 - Advanced Three-Dimensional Two-Group Reactor Analysis Code - User’s Manual. Studsvik Report. Studsvik of America (1992).
- [8] D. Fujiwara and S. Kosaka, Isotopic concentration and criticality analyses of BWR spent nuclear fuel using CASMO. Proceedings of International Conference on the New Frontiers of Nuclear Technology : Reactor Physics, Safety and High-Performance Computing (PHYSOR 2002), Seoul, Korea, 2002.